Abstract
Using a templated Mind Genomics program coupled with artificial intelligence, school age students created an experiment to assess what ordinary people think will be the situation of the 3rd grade mathematics class. Artificial intelligence (Idea Coach) enabled the researchers to create four questions about the nature of the mathematics class, and for each question to create four answers. A total of 110 respondents of varying ages each evaluated systematically created, unique combinations of the answers, with the process enabling the researcher to create individual level equations (models) for each respondent, one model for ‘agreement’ based on direct ratings, the second model for ‘engagement’ based on response time. Two clear mind-sets of people emerged; MS1 focusing on the predicted technical accoutrements of the 3rd grade math class, MS2 focusing on the predicted education process of the 3rd grade math class. The templated Mind Genomics approach opens up a new vista of opportunities for educating students how to think about problems, as well as letting the curiosity of students produce insights into their daily lives from topics that are relevant to them.
Introduction
One can scarcely read stories about education without getting a sense that the K-12 education in the United States may be deteriorating [1], and that one of the most severe issues is the decline in the mathematical performance of young people [2]. Educators struggle with how to remedy this situation [3,4], as many simply throw up their hands in frustration. Going in a different direction, the authors have pioneered the use of research to understand the social issues of today as seen by young people [5]. We are so accustomed to reading research designed by professionals about topics relevant to education and similar ‘worlds of the young’ that we fail to realize that we might well learn a great deal by having the young people act as researchers, rather than having fully developed professionals do the research. Of course, the immediate reaction might be that only a professional knows how to ask the right question, use the appropriate scale, and interpret the results. Young students might be observed and talked to but are not typically considered to be able to do independent research about a topic, or if they are, the research is couched in a simplistic style deemed appropriate for the not-quite-intellectually-developed student researcher.
In a previous set of studies, the authors have begun to work with school age students as researchers, with these researchers familiar with the process, and using a template which guides them. The process is called Mind Genomics, an emerging science of everyday life, a science which allows people to create everyday scenarios of what reality might be like, and have real people respond to these scenarios [5,6]. Mind Genomics began as a branch of mathematical psychology [7], but within a decade its ability to uncover how people respond to mixtures of ideas or features brought it to the attention of consumer researchers at The Wharton School of The University of Pennsylvania. The outcome was the migration of the esoteric field of ‘conjoint measurement – a basic form of fundamental measurement’ into the world of applications of everyday life [8].
The Mind Genomics process proceeds in a step-wise manner, using a templated program, along with an artificial intelligence ‘Idea Coach’. The process is arranged in a fashion which encourages the young researcher, teaching the topic, as well as well as allowing the researcher to do the empirical testing of the stimuli, and receive a report in real time, and a full analysis with 30 minutes after the end of the study.
We present the results of a study designed by the senior author, a third-grade student in a local public school in the Bronx, New York, USA. It is important to note that when young students are the researchers, following a templated approach but at the same time with new material, they are experiencing the specifics, the discipline, and intellectual excitement and the professional development of a science. Finally, as we proceed into the method, it is important to realize that the structured approach embedded in the Mind Genomics process ends up producing results worthy of publishing, with such results giving information both about how a young person thinks about the world, and about the strength of that thinking in the minds of older people.
The Mind Genomics process follows a series of steps, from design to analysis. Figure 1 shows the process in simple summary. The six screen shots show the process from naming the study (Panel A), choosing the four questions (Panel B), choosing four answers to a question (Panel C), creating a self-profiling questionnaire (Panel D), introducing the topic to the respondent (Panel E), and presenting the rating question and the rating scale (Panel F). It is important to keep in mind that these panels prevent the templated system for Mind Genomics, and were completed, without any help, by an eight-year third grade student, who had previous experience with setting up Mind Genomics studies on the BimiLep platform. No effort was made to edit the setup, reflected in the language used by the research for the introduction to the topic and the rating scale.
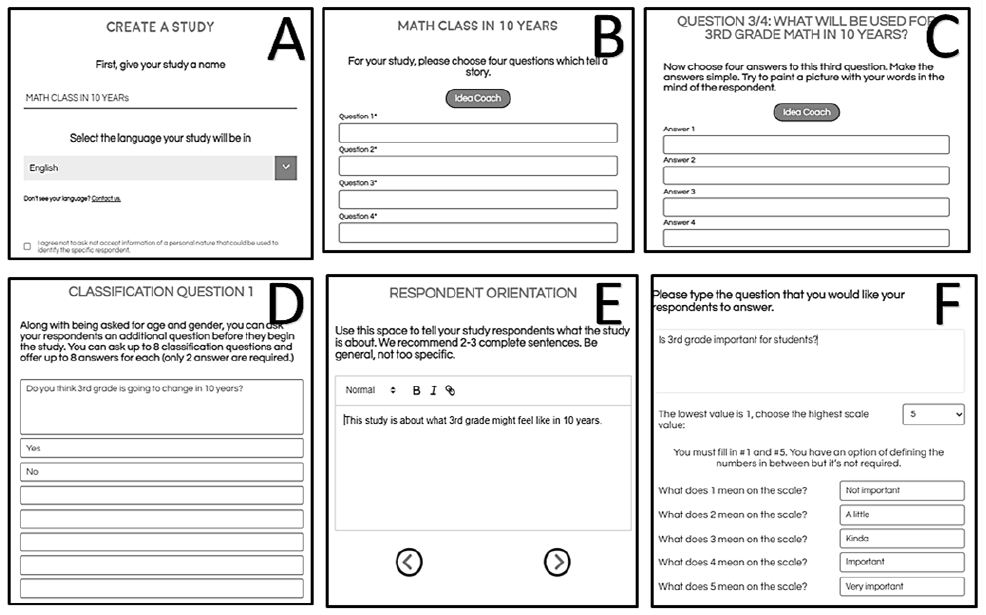
Figure 1: The template for the BimiLeap project set up
During the three plus decades of the evolution of Mind Genomics, a continuing block has been the inability of researchers to think in a critical manner, developing questions and answers. Often, with practice, the individual becomes facile in developing a ‘story’ from a set of questions. The answers to the questions are easy, but it is the story, the questions, which are difficult, and often lead the prospective research to abandon the effort.
The recent efforts in artificial intelligence have created the possibility to develop questions and answers. Artificial intelligence is embedded in a query system, Idea Coach, itself now an integral part of the BimiLeap platform. Figure 2 shows the use of Idea Coach to describe the topic in a special ‘box’ (Panel A), after which the Idea Coach returns with up to 30 questions shown in part in Panel B. Scrolling down would reveal the additional questions which Idea Coach generated. The process can be repeated, either with the same text shown Panel A for a number of new questions along with dome old questions, or with new text. Panel C and D show the same process. The researcher has already selected the four questions. When it comes time to create four answers to each question, the researcher can either provide her or his answers, or use Idea Coach to suggest 15 answers to the question. The researcher can select several and return for another 15 answers.
The importance of an Idea Coach for young researchers cannot be overstated. The Idea Coach does exactly what it says it does, namely coaches the student in the process. Observations with the young students as researchers reveals that they begin by relying on the Idea Coach, but at some point, they ‘get it’, and begin to combine Idea Coach with their own ideas, and then stop using Idea Coach for certain types of issues and questions.
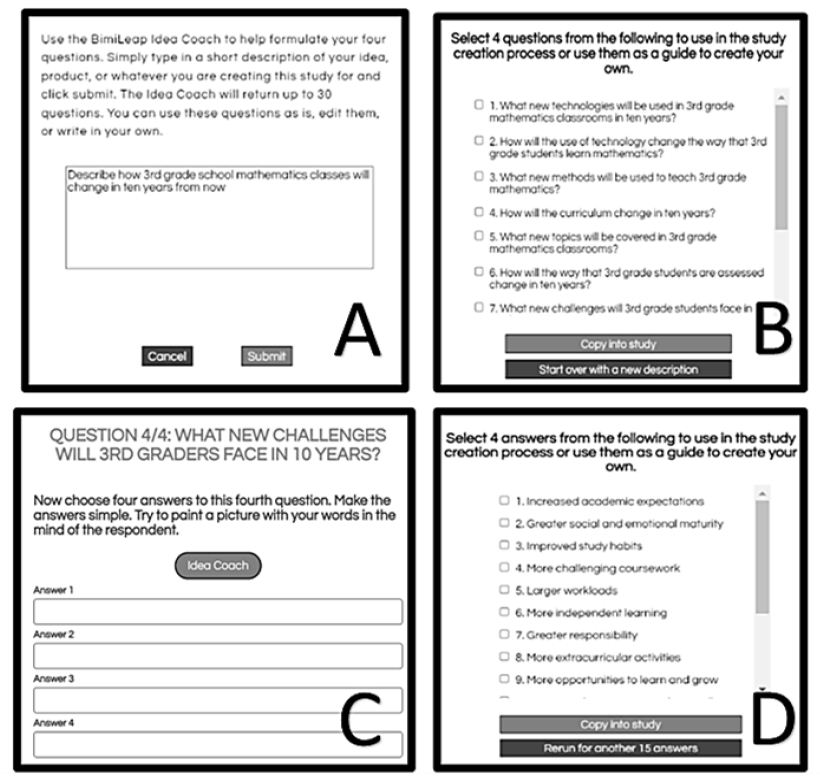
Figure 2: The Idea Coach process to develop questions based on the description of a topic (Panels A and B), and to develop answers based upon a specific question (Panels C and D).
Explicating the Mind Genomics Process: Case History of Mathematics I the 3rd grade
The best way to understand the emerging science of Mind Genomics is through case histories, studies of topics that might well be disregarded as being overly simple, almost trivial. Yet properly designed and executed, the studies reveal both the mind of the researcher and the mind of the respondent who is testing the stimuli developed by the researcher. Our study of the future of mathematics in the third grade is just such as example. It tells us the topics of interest to a young researcher, herself in the 3rd grade, and the reactions of people to her ideas. The actual study can be found in www.BimiLeap.com. The study itself can be easily replicated or modified, quickly and inexpensively. We present the results from one such study, designed in December 2022, run with five respondents, that part taking about 90 minutes, and then the completion of the study in February 2023, that part taking about 30 minutes.
Step 1
Give the study a name. Figure 1, panel A, shows the first screenshot, instructing the respondent to choose a name, select a language for the respondent-facing screens, and then agree not to ask for personal information that could identify the respondent. For those cases when the respondent is to be identified, there is an open-ended question where the respondent can provide identifying information, but only at the discretion of the respondent.
Step 2: Create/Select four Questions
Figure 1, panel B, shows the next screenshot, instructing the researcher to provide questions which tell a story. At first, researchers reporting having a difficult time at first. It is at this stage that the researcher becomes nervous. Figure 2 screens A and B show the Idea Coach, which enables the researcher to type in a description of the study (Figure 2, Panel A, top). Idea Coach returns with up to 30 questions, and does so several times if desired. The researcher can use the same description or a different description each time in Figure 2, Panel A. Each time, whether the description is repeated is changed, Idea Coach will come back with a new set of 30 questions, some the same, many different. Figure 2, Panel B shows an example of the questions as returned from one run of the Idea Coach. Table 1 shows the four questions finally selected.
Table 1: The four questions and the four answers (elements) for each question. The questions and their answers were generated by the Idea Coach using artificial intelligence.

Step 3
Select/create four answers to each question. Creating answers to questions appears to be easier for researchers than creating questions, perhaps because of our education which stresses answering direct questions. Figure 1C shows the BimiLeap screen requesting four answers from question C: What will be used for 3rd grade math in 10 years? The researcher can either create four answers or use the Idea Coach to create answers that can be edited (see Figure 2C and 2D). The Idea Coach has been set up to use artificial intelligence to provide sets of 15 answers to each question. The Idea Coach can be interrogated several times to get a sense of the variety of answers available for the question. Thus the Idea Coach serves both as a facilitator of the research process, and as a way to help the researcher learn the topic by the traditional question/answer process, the Socratic method.
Step 4: Create a Set of Self-profiling Questions
The questions deal with WHO the respondent is (demographics), what the respondent DOES (behaviors), what the respondent BELIEVES (attitudes). The BimiLeap program is automatically set to ask for the respondent’s gender and age, leaving eight open questions, each with eight possible answers. Figure 1D shows the only classification question inserted by the researcher ‘Do you think the 3rd grade is going to change in 10 years?
Step 5: Create an Orientation Statement Which Introduces the Respondent to the Topic (Figure 1E)
The objective of Mind Genomics is to determine how the different elements or answers ‘drive’ the response. The standard strategy is to provide the respondents with as little up-front information as possible, indeed simply introducing the topic. For other uses, such as the law (REF), the respondent introduction might be far more detailed because of the necessity of ensuring that the background to the case is understood. That is not the issue for most research, however.
Step 6: Create a Rating Scale (Figure 1F)
The rating scale is typically a short category or Likert scale, as many as nine answers, but shorter scales as well, comprising seven or five scales. Other scales with other points can be used, but for the most part author HRM, with thirty years of experience, has found that shorter scales are easier for the respondent to use, and often can be labelled, as done here. Note once again that the labelling was done by the elementary school-age researcher, without any guidance. Thus the monotonicity of the scale is maintained, but the language is that of a third grade student.
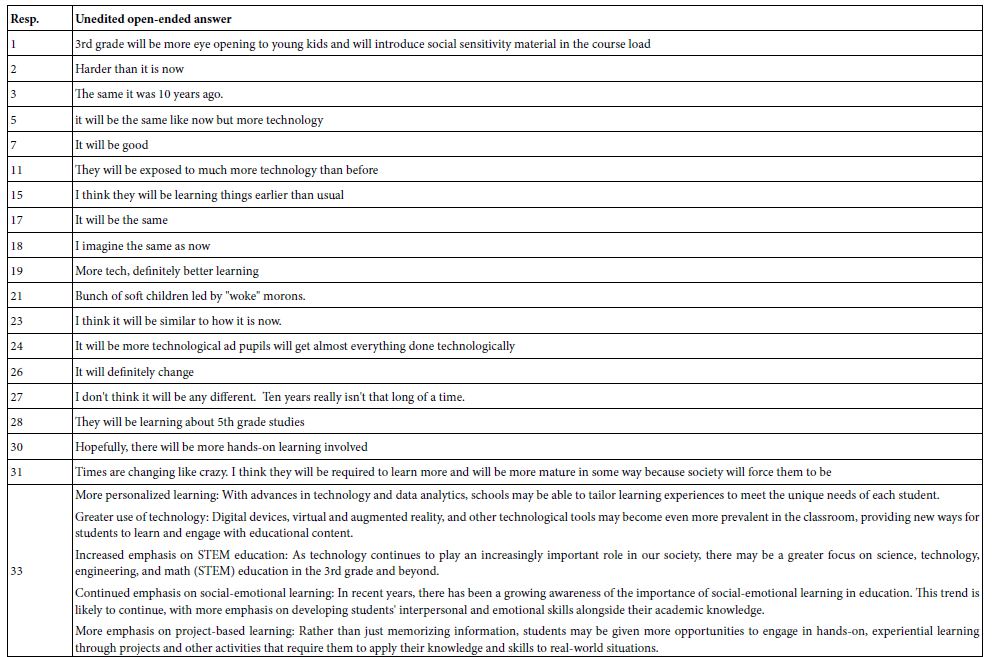
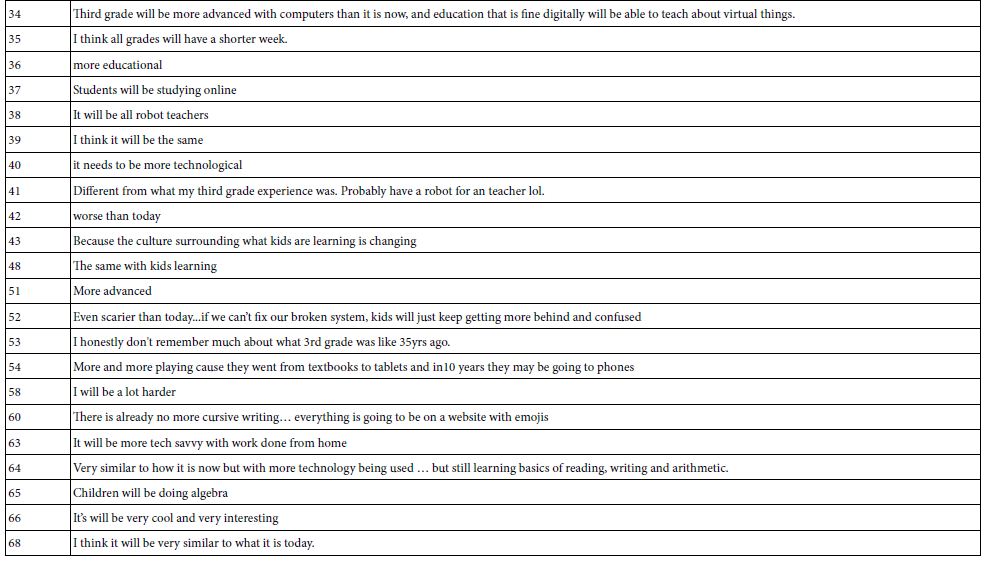
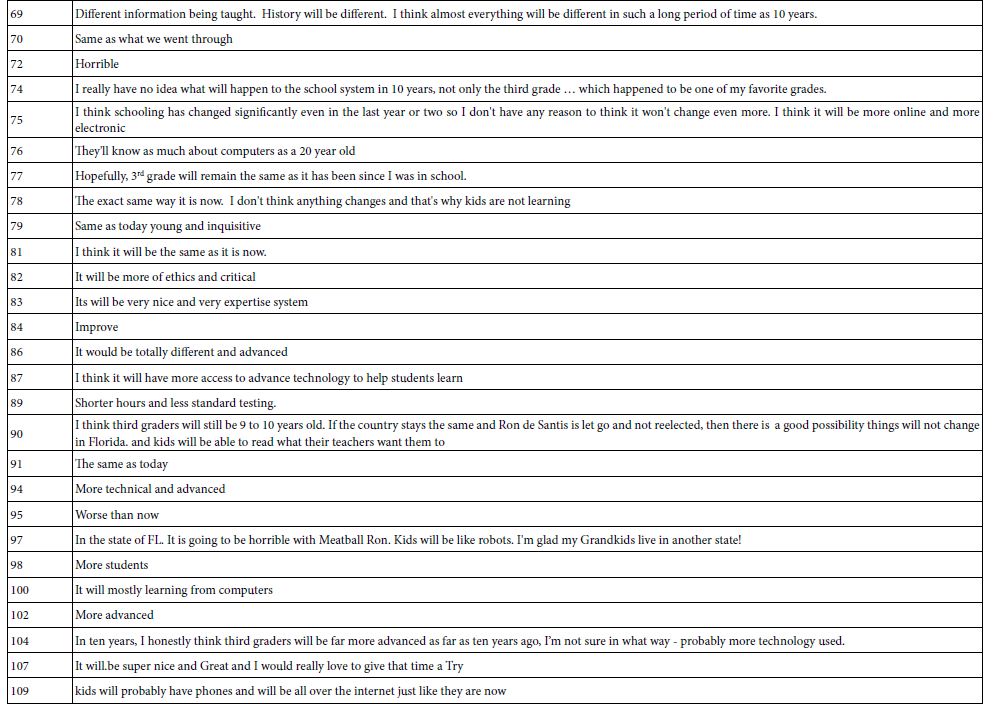
Step 7: Instruct the Respondent to Answer an Open-ended Question
The open-ended question is ‘how will the 3rd grade be different in 10 years?’. The Appendix shows these answers.
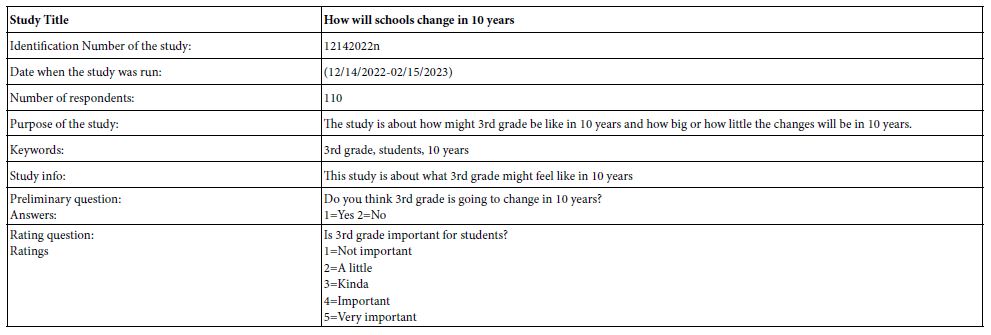
At this point, the study is set up. Table 2 shows the information for the study.
Table 2: Study information extracted from the set up
Step 8: Create 24 Unique Vignettes for Each Respondent, Using a Permutable Experimental Design
Mind Genomics works by presenting respondent with combinations of messages, so-called vignettes, comprising a minimum of two elements, and a maximum of four elements. Each question contributes at most one element (answer) to a vignette, but often contributes no element to the vignette. The composition of each vignette is dictated by an underlying experimental design, called a permutable design [9]. The design specifies the 24 combinations of elements, each element appearing exactly five times and absent 19 times. Each question contributes to 20 vignettes and does not contribute to four vignettes. Finally, the design is structured so that all 16 elements appear independently in a statistical sense, allowing the researcher (or, in our case, the BimiLeap program) to create an equation for each respondent, using statistical methods.
Each respondent evaluates a different set of 24 combinations, with a similar mathematical structure, but the composition of each of the vignettes for a respondent differs from the composition of each vignette, from every other respondent. In effect, the permutable design ends up with a similar, powerful design for each respondent, with the specific vignettes differing from one respondent. A good analogy is the MRI tool used in medicine, which takes pictures of the same tissue, the pictures from different angles. Each picture taken from a unique angle corresponds to a respondent. Eventually, one will be able to put the data together by regression to come up with a single coherent picture of the mind of the respondent.
Step 9: Execute the Study by Sending Out an Invitation to Respondents
The email invitation contains the link to the study. Figure 3 shows a screen shot of the page allowing the researcher to select the source of the respondent. Another set of screens allows the researcher to select the number of respondents, as well as the general qualifications of the respondents (country, gender, age, education, income, number of children). For more specific respondent qualifications the researcher has to go to a specialist panel provider.
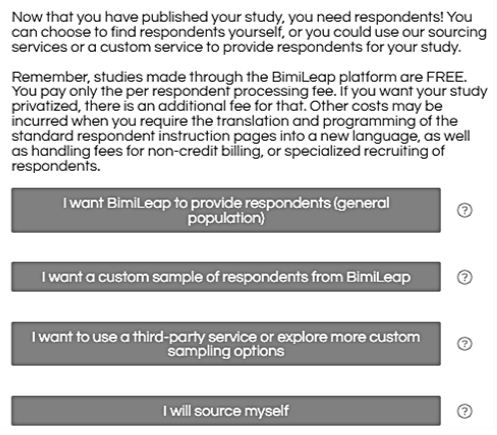
Figure 3: Respondent ‘sourcing’ page
Step 10: Acquire the Rating and the Response Time and Create a Database for Analysis
Each respondent evaluates 24 vignettes, and for each vignette assigns a rating on the 5-point scale. The BimiLeap program also records the response time, defined as the number of seconds elapsing between the moments that that the vignette appears on the respondent’s screen and the moment that the respondent assigns a rating. At that point, the screen automatically advances. Figure 4 shows a screen shot of the data available to the researcher.
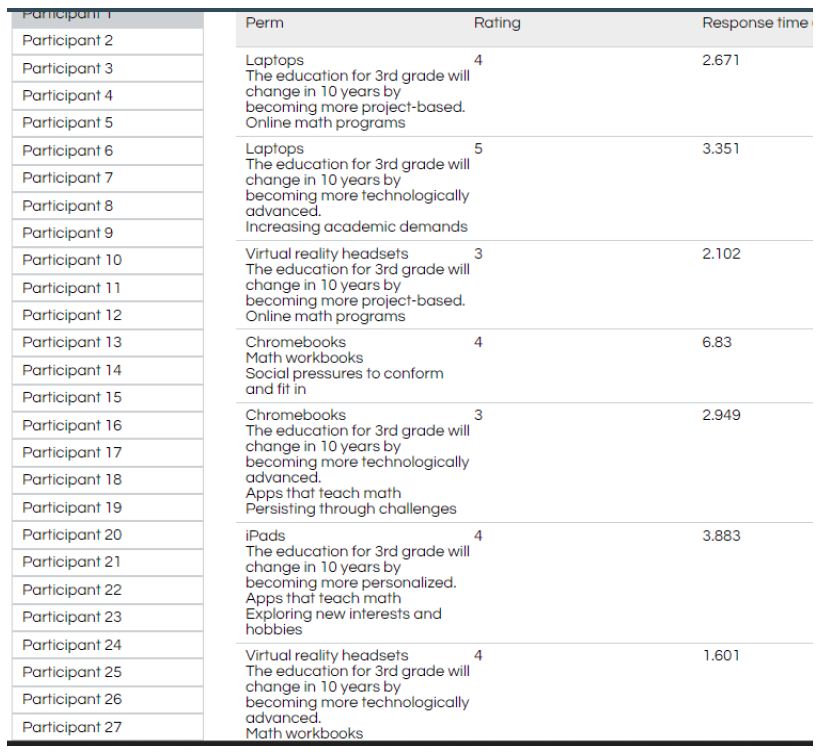
Figure 4: Screen shot of the first seven vignettes of participant (respondent) #1, along with the rating, and the measured response time in seconds.
As the respondents proceed to evaluate the 24 vignettes, some changes in the criteria may emerge. Figure 5 shows the average rating by test position, for the raw rating on the 5-point scale, for the two binary transformation (R54=Agree; R12=Disagree), and for the response time. As respondents read the vignettes from first to last, they respond more quickly, and end up agreeing more with the description. It is for that reason that we look at the data across the entire set of 24 vignettes evaluated by a respondent. Presumably, the order bias will be dissipating by then.
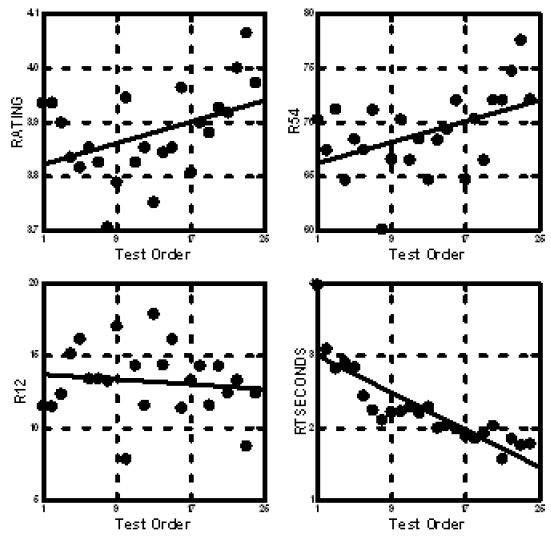
Figure 5: Average rating, transformed rating, and response time across the 24 vignettes evaluated by each individual.
One of the ongoing complaints of respondents is that they feel ‘unsure’ that they assigned the ‘right answer.’ At first, hearing that respondents want to give the ‘right answer’ may sound encouraging, the actuality is that when respondents can intuit the right answer’ the researcher may end up with a flawed study, one wherein the judgments are driven by the what the respondent feels to be a researcher expectation or acceptance. Survey research is filled with these types of biases [10], with respondents taking a stand in terms of what is the ‘politically correct’ answer, one that would be socially acceptable. Fortunately, the Mind Genomics paradigm prevents this expectation bias from exerting a strong effect because the vignettes comprise mixtures, a ‘blooming, buzzing confusion,’ in the worlds of Harvard psychologist Wm James when describing the perceptual world of a baby.
Step 11: Prepare the Database for Analysis by Regression Modeling
The objective of Mind Genomics is to link the elements in the vignette to the rating, and to the response time, respectively. In order to do this linking, viz., deconstruct the response to the vignettes into the contribution of the different elements, it is important that the data be in the correct form for the statistical analysis. The experimental design already ensures that the responses to the test stimuli can be linked to the 16 individual elements, but the data are not in the correct format.
The BimiLeap program creates a file shown in ’90 degree’ rotated form in Table 3. The columns are actually rows, and the rows are actually columns. In Table 2 the columns correspond to the vignettes, the rows correspond to the information about each vignette, Table 2 shows the first six vignettes evaluated by respondent #1. Each respondent generates 24 columns of data. The rows have information about the study, the respondent number, the information about the respondent obtained from the self-classification (gender, age, feel about the 3rd grade in 10 years), then the design of the vignette, expressed in elements present/absent (1=present, shaded; 0=absent, unshaded). The final set of rows show the response time, the rating, and the binary transform of the rating to positive/agree (R54, 5 or 4 → 100, 1, 2 or 3 →0) or negative/disagree (R12, 1 or 2 → 100, 3, 4, or 5 →0). A vanishingly small random number is added to each binary transformed rating, in order that there will be some variation in the binary variable when it acts as a dependent variable in the regression analysis.
Table 3: Example of the part of the data set. The data set is shown rotated 90 degrees

Step: 12: Create Equations Relating the Elements to the Transformed Rating
The key to the analysis is using OLS (ordinary least-squares) regression, which deconstructs the transformed binary response to the presence/absence of the 16 elements. The equation can be written either as
R54=k0 + k1(A1) + k2(A2) … k16(D4) (abscissa of Figure 5) or as R4=k1(A1) + k2(A2) … k16(D4)
The former is estimated with an additive constant, the latter is estimated without an additive constant (Figure 6).
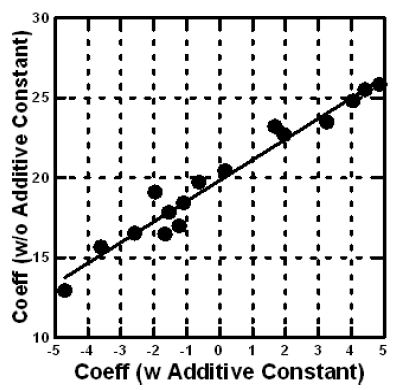
Figure 6: Scatterplot of coefficients for the total panel relating transformed binary variable R54 to the presence/absence of the 16 elements. The abscissa shows the coefficients estimated with an additive constant, the ordinate shows the coefficients for the same data estimated without an additive constant.
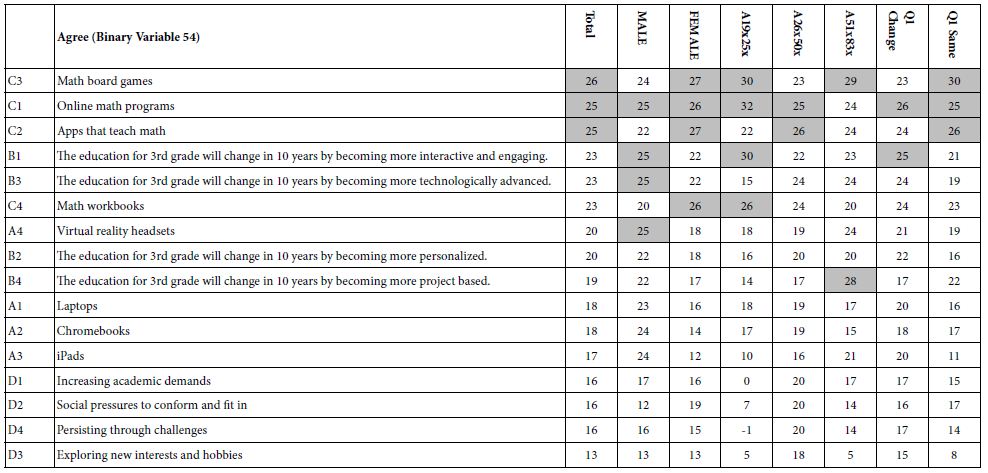
By transforming the five points on the Likert Scale to a binary scale we enable the user of the data to understand the results of the study more quickly. The reality of research is that whereas the Likert scale (viz., our 1-5 scale) is easy to create, it is hard to interpret. What exactly does a 3.5 mean. Managers who use the research are not accustomed to that type of thinking, and instead want a simple interpretation. Transforming the scale to a binary scale means that when we have a coefficient such as +26 for C3 (math board games, total pane) we can say that 26% of the time people will agree that this is likely to be the future of the 3rd grade mathematics class in 10 years. In contrast, the phrases which have little real meaning, but rather talk about challenges (D1-D4) end up generating the lowest coefficients for R54, what school will be like. Keep in mind that the respondents could not have ‘gamed’ the study
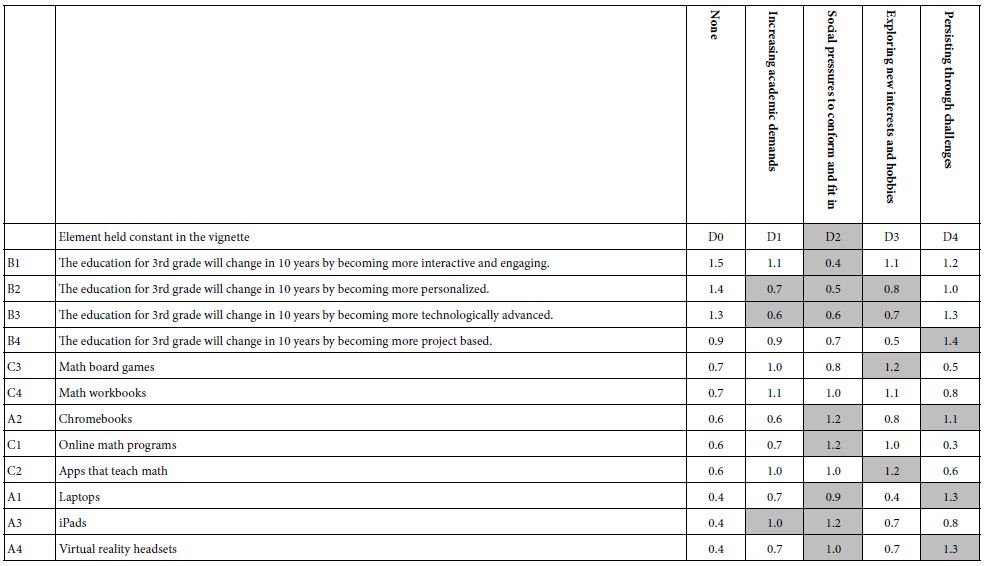
Table 4 shows the coefficients for the model relating R54 (Agree this will be the case in 10 years) to the elements. The columns show the different subgroups, viz., by gender, by age, and response to Question 1. Statements about problems (Question D) generated the lowest agreement, perhaps because they cannot be visualized.
Table 4: The coefficients for the 16 elements for Total Panel, and for each key self-defined subgroup
Step 13: Uncovering Mind-sets for the Granular Topic
A hallmark of Mind Genomics is the focus on the granular topics of the everyday, coupled with a search for different mind-sets, defined as groups of people who think in specific ways. In statistics, these mind-sets are called ‘clusters’ (REF). Clustering is usually reserved for bigger topics, especially in consumer research where the focus is on a ‘macro-level’ understanding of the differences among people in a big domain, such as ‘education in general.’ The notion of clustering people into mind-sets for the smaller, granular level issues of every day is not typically considered, usually because the effort to do the study and the large number of respondents required are prohibitive for the small-scale, local issues. The creation of Mind Genomics as an inexpensive, DIY (do-it-yourself) process, with rapid turnaround, allows Mind Genomics to approach the everyday problems with an eye towards how people make decisions, and the possible existence of different groups of mind-sets.
The process of uncovering mind-sets moves away from looking at people in terms of WJHO they are, and instead looks at people in terms of how they THINK, and more specifically how they think about a particular focused situation. Our study on what the mathematics class of the 3rd grade will look like typifies one of these granular=level examples.
The mathematics is very simple, following these well-accepted steps in clustering.
- Decide what the criterion will be. The criterion here is the pattern of values for the 16 coefficients relating the presence/absence of the element to the positive response R54.
- For each respondent, create an individual-level model relating the respondents rating of 54 to each of the 16 elements. The approach is simply regression but this time using only the data from one respondent, rather than the data from all respondents. We can use the data from one respondent because the underlying experimental design was used to construct the 24 vignettes evaluated by each respondent. Furthermore. We added a vanishingly small random number to the transformed rating (R54), whether the transformed value was 0 or 100,respectively. The small random number ensured that there would be some level of variability in the dependent variable, preventing the computer from crashing.
- The data file which emerges comprises 110 rows, one per respondent, and 16 columns, one per element The numbers in the rows are the coefficients of the equation for that individual: R54=k1(A1) + k2(A2) … k16(D4).
- The next analysis looks for common patterns across the 110 respondents, based upon the pattern of the coefficients. This analysis, clustering, is purely mathematical in nature. For the clustering used here, so-called k-means clustering [11], the computer program computed the ‘distance’ between every pair of respondents in the group of 110. The measure of distance is the quantity (1 – Pearson R) where the Pearson R is the linear correlation between two sets of numbers, here the two respondents each of whom is defined by 16 coefficients. When the correlation is perfectly linear (R=1), the distance is 0 (1 – 1=0). When the correlation is perfectly inverse (R=-1), the distance is 2 (1 – – 1=2).
- The k-means clustering program is purely objective, and has no input from the researcher. The program assigns each respondent first to one of two exhaustive and non-overlapping clusters, then to one of three exhaustive and non-overlapping clusters, etc. The assignment uses mathematical criteria.
- It is the task of the researcher to select the cluster and name it. The ideal is to use as few clusters as possible, but clusters which are clearly different and can be readily named.
- For this study, two clearly different clusters emerged, and could be named. Mind-Set 1 focuses on accoutrements and technology. Mind-Set 2 focuses on the process of education.
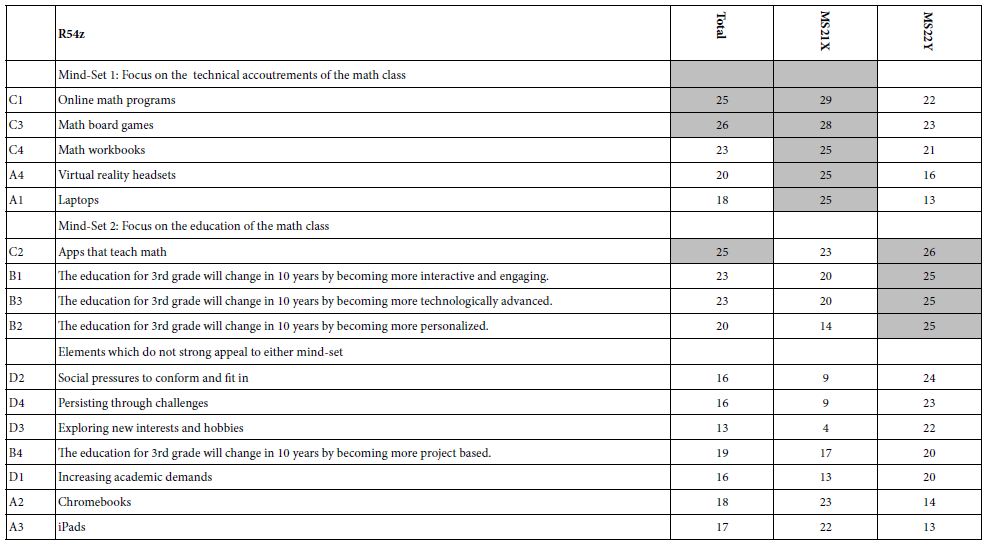
- Table 5 shows the mind-sets sorted by ‘strong’, for each mind-set, and then the elements which are not strong for either mind-set. Although the respondents may have thought that they were just guessing, the segmentation reveals clearly different, clearly meaningful mind-sets, based on the clustering.
Table 5: The coefficients for the 16 elements for Total Panel, and the two mind-sets
Step 14: Response Time and the Measurement of Engagement
In the history of experimental psychology and then later in the world of psychology in general, the notion of response time or reaction time has been considered to represent underlying, often non-conscious activities, such as engagement with the material [12,13] or active blocking of content [14]. In the world of consumer research a great deal of interest has been expended at various times to use the non-conscious measures as a perhaps a less cognitively biased measure of how a person feels. Whether these behaviors outside of conscious control are anything more than interesting measures is not relevant to this paper. What is relevant is that we know what the stimuli mean because they are phrases, we know how they drive agreement because we measure agreement, and we can estimate how much time they take to process because we measure response time to vignettes of known composition.
The equation relating the measured response time to a vignette (RT), versus the presence/absence of the elements is the same equation that we have used above: RT=k1(A1) + k2(A2) .. k16(D4).
Table 6 presents the coefficients for the response time for the total panel and for the key self-defined subgroups, gender, age, and prediction about the change in the third grade ten years out. To identify patterns, we select long response times, considering these long response times to represent engaging statements. ‘Long’ response time has been set arbitrarily at 0.8 seconds. With that in mind, Table 6 suggests two elements which are engaging, but perhaps for different reasons:
Table 6: Response times for the 16 elements, for Total Panel and for key self-defined subgroups
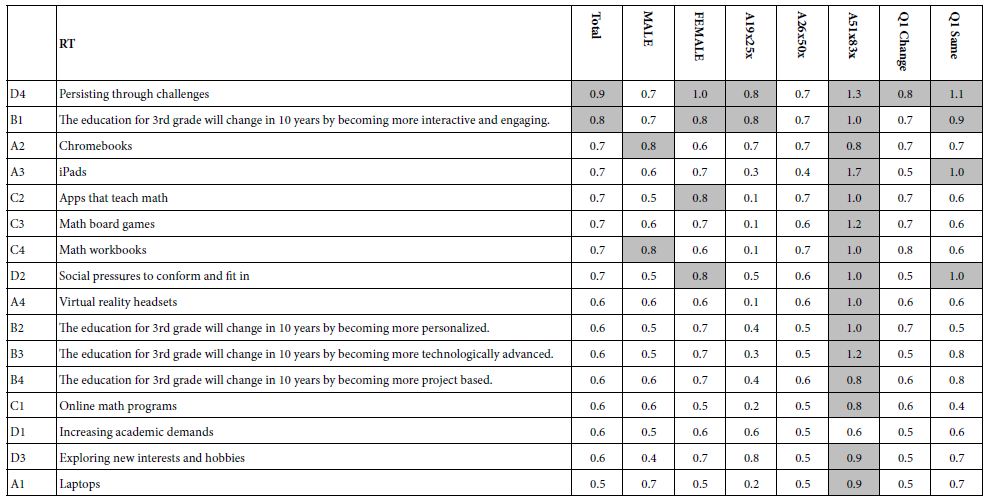
An element which paints a word picture, forcing one to think about that word picture because it describes a universally meaningful situation and presumably summons to consciousness meaningful experience: D4 Persisting through challenges.
An element which is simple, real, and meaningful. B1: The education for 3rd grade will change in 10 years by becoming more interactive and engaging.
Table 6 also reveals that the typical response time for older respondents (age 51-83) is far longer than the response time of the younger respondents. Even among the older respondents, however, some element are far more engaging than others:
A3 iPads
D4 Persisting through challenges.
C3 Math board games
B3 The education for 3rd grade will change in 10 years by becoming more technologically advanced.
Table 7 presents the response-time coefficients for the two emergent mind-sets. What is remarkable is the seeming inverse relation.
Table 7: Response times for the 16 elements, for Total Panel and for the two emergent mind-sets
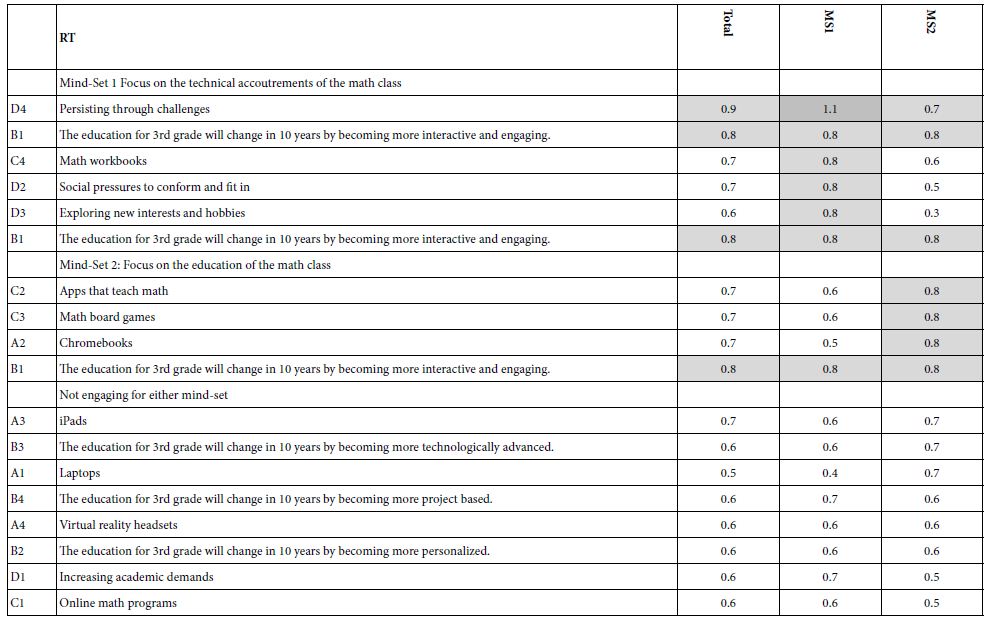
Mind-Set 1 (MS1), who appear to be focused on the technology (accoutrements of the math class) show the longest response time for elements dealing with the process and experience of education.
Mind-Set 2 (MS2), who appear to be focused on the process of education show the longest response times for elements dealing with technology.
We may have in Table 7 interesting evidence for underlying cognitive processes, namely that in an important social topic like education, people take the task seriously, and ‘figuratively’ are having difficulty processing elements with which they do not perceive to be part of the future of education.
Step 15: Uncovering Pairwise Interactions through Systematics Using Scenario Analysis
We end these steps of the Mind Genomics process by searching for hitherto unknown, often unexpected pairwise interactions between elements. Conventional research designs do not enable the research to uncover interactions unless these interactions are inserted into the study as defined test stimuli, the reaction to which can be assessed as being statistically significant or not. The key here is that that researcher must ‘know’ what pair or pairs of elements are expected to synergize with each other, or to suppress each other. The implication is that the researcher should know a great amount of topic in order to build in the interactions that can be measured.
A key benefit of the Mind Genomics process is that each respondent evaluates different combinations of elements. That means that across the 110 respondents it is likely that 90% of the combinations are different from each other. The reason for that feature is the permutation scheme, which ends up producing these different combinations. The researcher can benefit from this larger set of different combinations by selecting one specific question (e.g., Question D), and sorting the database into five groups or strata of vignettes. Each stratum of the five comprises one of the five answers to Question D (D=no answer, D1-D4=the four different answers).
Once the five strata are defined, one can create an equation for each stratum. Within a stratum the element or answer from Question D is fixed, so the independent variables are the 12 elements, A1-C4. The equation is of the same form as before: Dependent Variable=k1(A1) + k2(A2) … k12(C4). There are five such equations, whose parameters are shown in Table 8 for the dependent variable being R54 (agree), and in Table 9 for the dependent variable being RT (response time).
Table 8: Scenario analysis showing the interactive effect of the column element (difficulty) with the row element as a driver of agreement (R54).
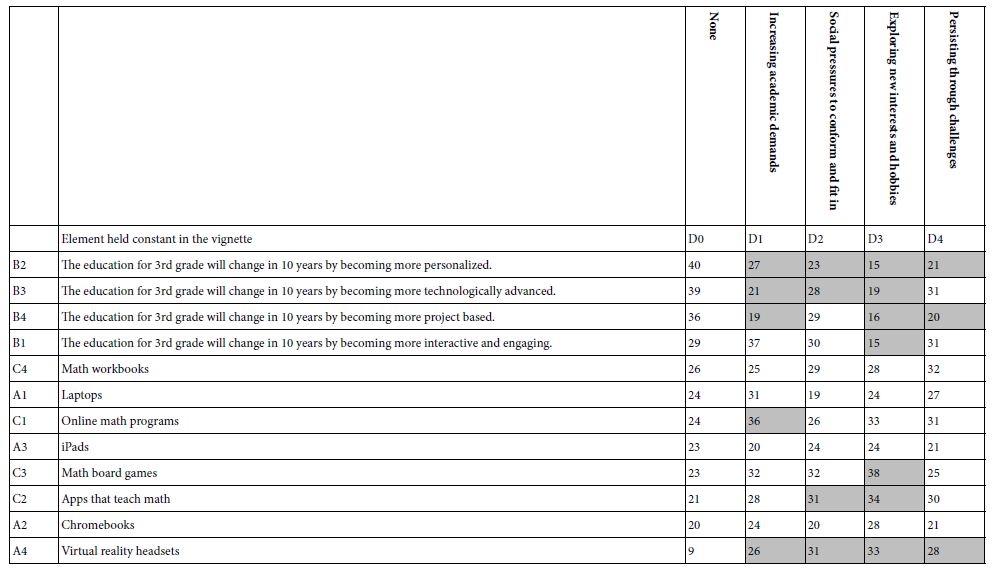
Our analysis focuses on differences due to interactions. The column elements are the difficulties that might be faced in 10 years in the 3rd grade. The column labelled D=0 corresponds to the values of the 12 elements in the absence of any element from Question D. We are searching for any element from Question D which generates more than a 10 point or greater change in either direction. The 10 points correspond to a major change.
- Agreement (R54) What is most striking is the interaction between the changes to be expected (Question B) and the difficulties to be encountered (columns). The agreement with the changes drops as one introduces the difficulties (Table 8).
- Response time (RT). A similar pattern emerges with response time. The response time gets shorter with the introduction of difficulties. It may be that to understand and comprehend difficulties takes away the attention from the other elements, such as change to be expected (Table 9).
Table 9: Scenario analysis showing the interactive effect of the column element (difficulty) with the row element as a driver of response time (RT).
Discussion and Conclusions
The literature on education is filled with studies of students and mathematics, how they learn [15,16], how to work with challenged students, and so forth [17]. These studies are done from the point of view of adults, whether those interested in the psychology of the child as the child grows (REF), or those interested in the process of education [18]. Some topics deal with the child, others with the curriculum, and best practices [19-21].
What may be missing, however, is the experimental analysis of the world according to the student. There are papers reporting observations of the student [22-25] and interviews with students [26] but few books or papers wherein the student is allowed to formulate questions as a researcher [27]. The formulation of the questions itself provides insight into the student. Just as important is the evaluation of these questions by other people, and the insights about the education from the mind of the student, as evaluated either by adults (done here), or by other students (not done here) (Table 10).
Table 10: Appendix – Responses to open-ended question about what the 3rd grade will be like in 10 years
References
- García E, Weiss E (2019) US Schools Struggle to Hire and Retain Teachers. The Second Report in” The Perfect Storm in the Teacher Labor Market” Series. Economic Policy Institute.
- Freeman B, Marginson S, Tytler R (2019) An international view of STEM education. In: STEM Education 2.0, Brill 350-363.
- Rege M, Hanselman P, Solli IF, Dweck CS, Ludvigsen S (2021) How can we inspire nations of learners? An investigation of growth mindset and challenge-seeking in two countries. American Psychologist 76: 755-767. [crossref]
- Mendoza C, Mendoza C, Rappaport S, Deitel J, Moskowitz H (2023) Empowering young researchers to think critically: Exploring reactions to the ‘Inspirational Charge to the Newly-Minted Physician’. Psychology Journal, Research Open 5: 1-9.
- Moskowitz HR, Gofman A, Beckley J, Ashman H (2006) Founding a new science: Mind genomics. Journal of Sensory Studies 21: 266-307.
- Porretta S, Gere A, Radványi D, Moskowitz H (2019) Mind Genomics (Conjoint Analysis): The new concept research in the analysis of consumer behaviour and choice. Trends in Food Science & Technology 84: 29-33.
- Green PE, Srinivasan V (1990) Conjoint analysis in marketing: new developments with implications for research and practice. Journal of Marketing 54: 3-19.
- Gofman A, Moskowitz H (2010) Isomorphic permuted experimental designs and their application in conjoint analysis. Journal of Sensory Studies 25: 127-145.
- Suchman EA (1962) An analysis of “bias” in survey research. Public Opinion Quarterly 26: 102-111.
- Likas A, Vlassis N, Verbeek JJ (2003) The global k-means clustering algorithm. Pattern recognition 36: 451-461.
- Bassili JN, Fletcher JF (1991) Response-time measurement in survey research a method for CATI and a new look at nonattitudes. Public Opinion Quarterly 55: 331-346.
- Read B, Wolters L, Berinsky AJ (2022) Racing the clock: Using response time as a proxy for attentiveness on self-administered surveys. Political Analysis 30: 550-569.
- Solarz AK (1960) Latency of instrumental responses as a function of compatibility with the meaning of eliciting verbal signs. Journal of Experimental Psychology 59: 239-245. [crossref]
- Blanton M, Stephens A, Knuth E, Gardiner AM, Isler I, et al. (2015) The development of children’s algebraic thinking: The impact of a comprehensive early algebra intervention in third grade. Journal for Research in Mathematics Education 46: 39-87.
- Campos IS, Almeida LS, Ferreira AI, Martinez LF, Ramalho G (2013) Cognitive processes and math performance: A study with children at third grade of basic education. European Journal of Psychology of Education 28: 421-436.
- Zeleke S (2004) Differences in self‐concept among children with mathematics disabilities and their average and high achieving peers. International Journal of Disability, Development and Education 51: 253-269.
- Gardner H (2006) The Development and Education of Mind. Taylor & Francis Limited.
- Akerson V, Nargund-Joshi V, Weiland I, Pongsanon K, Avsar B (2014) What third-grade students of differing ability levels learn about the nature of science after a year of instruction. International Journal of Science Education 36: 244-276.
- Hanich LB, Jordan NC (2004) Achievement-related beliefs of third-grade children with mathematics and reading difficulties. The Journal of Educational Research 97: 227-234.
- Steffe LP, Gale J (1995) Constructivism in Education (1st ed) Routledge.
- Corno L, Mandinach E (1983) The role of cognitive engagement in classroom learning and motivation, Educational Psychologist 18: 88-108.
- Fredricks JA, Blumenfeld P, Friedel J, Paris A (2005) School Engagement. In: Moore, K.A., Lippman, L.H (eds) What Do Children Need to Flourish? The Search Institute Series on Developmentally Attentive Community and Society, Springer.
- Meece J, Blumenfeld PC, Hoyle RH (1988) Students’ goal orientation and cognitive ngagement in classroom activities. Journal of Educational Psychology 80: 514-523.
- Skinner E, Belmont MJ (1993) Motivation in the classroom: Reciprocal effect of teacher behavior and student engagement across the school year. Journal of Educational Psychology 85: 571-581.
- Gill P, Stewart K, Treasure E, Chadwick B (2008) Conducting qualitative interviews with school children in dental research. British Dental Journal 204: 371-374.[crossref]
- Kellett, Mary (2005) How to Develop Children as Researchers: A Step by Step Guide to Teaching the Research Process Sage Publications Ltd.
- Luce RD, Tukey JW (1964) Simultaneous conjoint measurement: A new type of fundamental measurement. Journal of Mathematical Psychology 1: 1-27.