Abstract
71 US respondents, ages 14-19, evaluated phrases about what to do to avoid overeating. The phrases were selected by two student researchers, one in middle school, one in elementary school, using artificial intelligence. The phrases were combined according an underlying experimental design, creating 24 vignettes, with each of the 71 respondents evaluating a unique set of vignettes, rating each vignette on ‘for me versus not for me’. Clustering reveal three clearly different mind-sets about what is most relevant to the respondent; Mind-Set 1 focuses on exercise, Mind-Set 2 focuses on eating healthfully, Mind-Set 3 focuses on parental responsibility. The three mind-sets emerged clearly and dramatically, even though the respondents evaluated combinations of messages, some relevant, some not relevant.
Introduction
Obesity and diabetes are serious problems around the world. With the increasing consumption of processed foods, with the decrease in exercise as part of the sedentary lifestyle, the inevitable result is an increase in diabetes. The literature is filled with information about the problem, albeit from the point of view of the clinician seeing the patient, and from the point of view of professionals involved with public health [1-4]. There are also numerous professional nutritionists and lifestyle counselors who specialize in eating disorders, along with the many psychologists and psychiatrists who provide acute treatment for the suffering patient [5]. Diabetes is so threatening that many medical professionals are recommending bariatric surgery as a way to deal with the problem [6]. One key is educating the children to eat properly, a topic becoming increasingly relevant over the years [2,7-10].
This paper emerged from a short conversation with a colleague in Israel about the issue of obesity in young people, and the potential of that obesity to evolve into juvenile diabetes. The issue was whether one could work with student-age researchers, rather than with professionals [11]. These researchers would design the study from their perspective, rather than from the perspective of a professional. The research itself might not be as polished, but the inputs to the research might be more genuine because the ages of the researchers (Cledwin, Age 14; Ciara Age 8). These two students have already collaborated on a variety of papers, providing the inputs needed to run the study. This newest collaborative was quite easy for them, requiring about two hours to set up, and two hours to execute.
The Mind Genomics Paradigm as a Way to Understand the Mind of People
The research process used in this study is Mind Genomics, an emerging science which focuses on the decision processes of everyday experience. Mind Genomics differs from traditional psychology in that it presents systematically created combinations of descriptions of descriptions about a specific experience, obtains ratings of the combinations, and deconstructs the ratings to the contribution of each component of the combination. One might at first think that this approach is ‘roundabout’ because the typical approach is to present the individual items, the components, one at a time, get respondent ratings to each component, and then report the average rating. The reality, however, is that this ‘one at a time’ approach allows the respondent to focus on each component separately. As a result, the respondent shifts his or her criterion to be appropriate to the nature of the component, as well as tempting the respondent to outguess the researcher, looking for the ‘right answers’. Presenting combinations prevents the respondent from gaming the system, forcing the respondent to maintain the same criterion through the set of evaluations [12,13].
Demonstrating the Mind Genomics Process and Results for the Topic of ‘Preventing Childhood Obesity’
The process begins with a topic, namely childhood obesity. In the traditional Mind Genomics process, before the introduction of artificial intelligence through Idea Coach, it was the researcher’s job to create four questions which tell a story. The researcher would be presented with an empty screen, similar to the left panel of Figure 1, no questions filled in. It would be at this point when that the inexperienced researcher would experience a psychological ‘wall’, one sufficiently high to discourage. Over time, of course, and with practice, one could become sufficiently facile to fill in four questions, but the learning curve was fairly flat and long, requiring 4-5 experiences with a Mind Genomics study. That barrier, requiring the research to think of questions, sufficed to slow the acceptance of the process, although over time many people ‘stayed the course’ and became facile.

Figure 1: The request for four questions to begin the study (left panel), the Idea Coach input (middle panel) where the user describes the topic with artificial intelligence returning with up to 30 questions, and then the four selected questions (right panel).
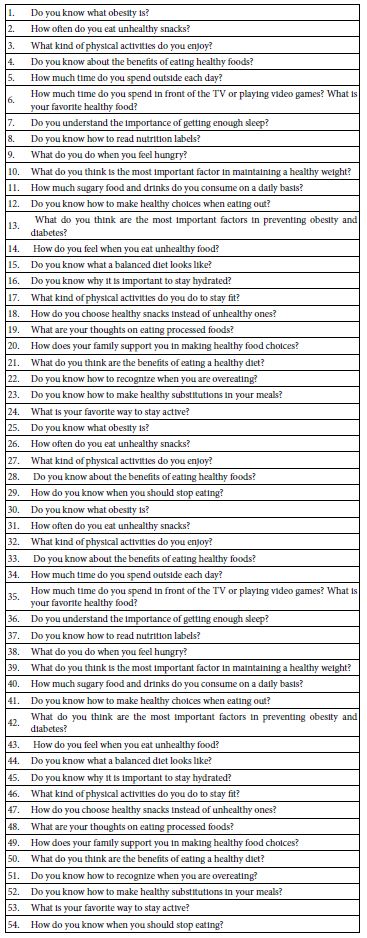
With the advent of widely available artificial intelligence though such platforms as Open AI the researcher is afforded an opportunity to write about the topic (see Figure 1, middle panel). For each description of the topic written by the researcher, Idea Coach returns with up to 30 questions. One may even use the same query or modify it, and return with additional questions, as Table 1 shows. Indeed, it has become apparent that many uses of Mind Genomics, and especially Bimi Leap, use the embedded artificial intelligence to learn about the topic in a greater depth, doing so in a self-directed, enjoyable fashion, akin to exploring to follow one’s curiosity [14].
Table 1: The first set of 30 questions returned by Idea Coach on the first ‘run’, and set of 24 questions returned on the second ‘run’.
Finally, the researcher selects the four questions from the list, provides some from the list, even editing them, and comes up with some of his or her own questions (Figure 1, right panel). Experience with Idea Coach suggests that after five or six times the researcher feels empowered by Idea Coach. It should be noted that for our student researchers who had had practice with Mind Genomics, this latest effort to create four questions ended up requiring less than 10 minutes.
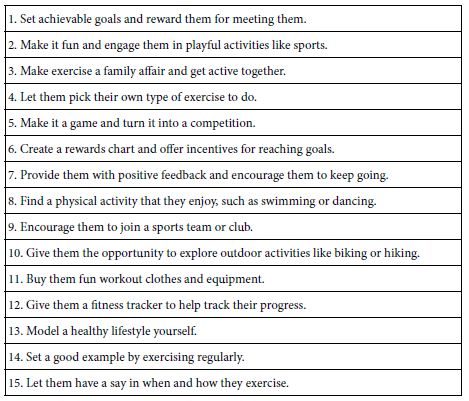
Once the researcher has completed the selection of four questions, either from one’s own knowledge or using Idea Coach, or eventually some combination of the two, the BimiLeap program requests the researcher to provide four answers to each question selected, or a total of 16 answers. For each question, invoking Idea Coach generates 15 possible answers Once again, the researcher can invoke Idea Coach many times. Table 2 shows the output of Idea Coach.
Table 2: Example of 15 answers emerging from Idea Coach to address one of the four questions selected
Before we move on to the next set up questions, it should be noted that the activity of creating questions and obtaining answers can end up as an activity itself. In the words of co-author Ciara Mendoza, the 8-year old student researcher, ‘this is so much fun…. Better than video games.’
The next and optional step creates a set of classification questions. These questions provide additional information about the respondent. In the analysis below, we will look at the respondent’s gender and age, both obtained automatically in the BimiLeap program. In addition, the researcher is able to ask up to an additional eight questions, each question with up to eight different answers. For the study here, the researcher selected seven different question. Table 3 shows the actual questions and answers. Figure 2 shows the layout for the classification questionnaire. The appendix shows the distributions of the 71 participants across the self-profiling classification questions, as well as across the three emergent mind-sets.
Table 3: Self-profiling classification questions
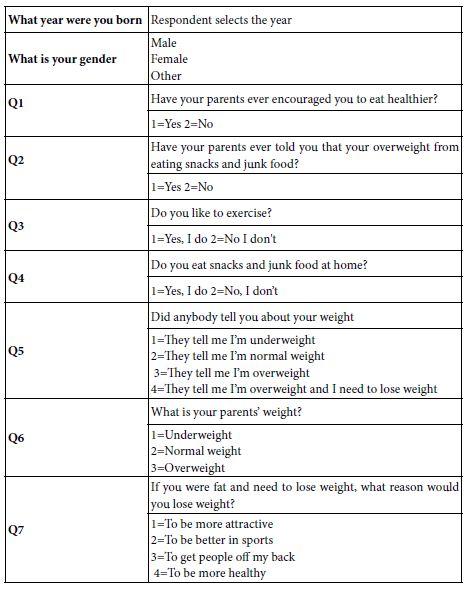
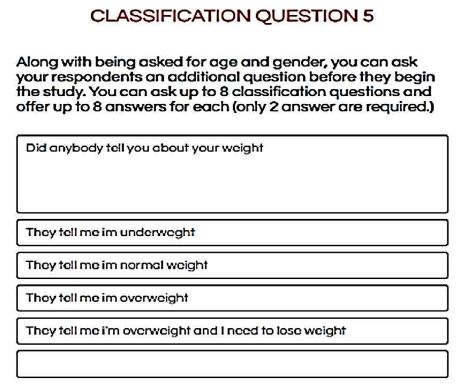
Figure 2: An example of the self-profiling classification question. The BimiLeap program allow for eight such questions, each with up to eight possible answers.
As explained above, the strategy of Mind Genomics is to present the respondent with combination of elements. These combinations created according to an experimental design. The design used by Mind Genomics is known as a ‘permuted design’ [15]. The design has been created for a variety of numbers of elements. For this study, and indeed for most recent Mind Genomics studies, the design calls for four questions, each with four answers. Henceforth, these will be Questions and elements, with the word ‘element’ replacing ‘answer’ or in other renditions of experimental design, the word ‘element’ we use here will replace terms such as ‘option’ or ‘level’.
The underlying permuted design creates precisely 24 vignettes, viz., combinations, comprising either two, three, or four elements, at most one element from each question, but often no element from a question. Each of the 16 elements appears exactly five time in the 24 vignettes, and is absent from 19 of the vignettes. The experimental design is set up to create different sets of 24 vignettes for the respondents, so that for a reasonable size study (fewer than 500 people), it is quite likely that no two respondents will evaluate the same vignettes. In this way the Mind Genomics system allows anyone to explore a topic, with a high likelihood of discovering the promising aspects of the topic. This open-vision, this virtually unfettered exploration of the topic, stands in stark contrast to the hypothetico-deductive thinking of most of today’s research, where one must formulate a hypothesis, design the combinations of variables likely to be most important, and then do the study to confirm or disconfirm one’s hypothesis. This science subtly converts the study from exploration to discover into effort to confirm or falsify, a world-view which makes it important virtually to ‘know the answer’ before the doing the experiment. In the case of our student researchers, such subtle demands of ‘knowing the answer ahead of time’ may disenchant the student. The rigor of the hypothetico-deductive system may be exactly what can do the job of crushing the spirit of the novice.
Among the final steps in the creation of the experiment is respondent orientation, choice of a rating question, and actual rating scale, shown in Figure 3. The researcher types in the question, the number of scale points, and is free to label or not label the scale points.
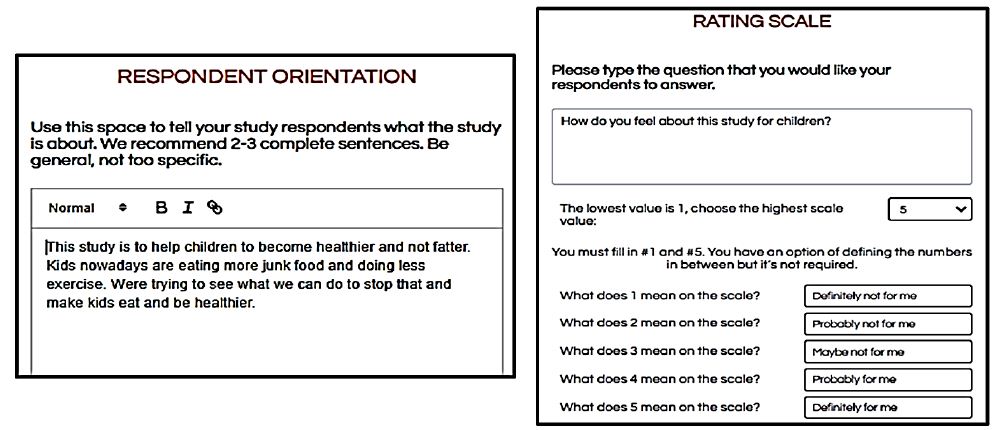
Figure 3: (Left panel) Respondent orientation to the study. (Right panel) The rating question, the selection of the number of scale points, and an optional anchor for each scale point.
The actual study is done on the Internet through a cooperating panel provider, Luc.id, Inc. Any panel provider who an access people can do equally well. Often the researcher wants to use his or her friends, or other individuals known to them. In such cases the BimiLeap program provides a link to be sent to the prospective respondents. A word of caution is due here. Although it is tempting to work within a limited group of friends or prospects one knows, the time to do the experiment can be become unduly long. The study reported here (actually two precisely parallel studies, one with males, one with females) took about 60 minutes to complete. That 60 minutes could turn into two or three weeks, and could end up without sufficient respondents as one’s friends, acquaintances, invited to participate, end up forgetting, deleting, or just ignoring the invitation.
Figure 4 shows an example of one of the 24 vignettes shown to a respondent. The vignette shows very little information, presents the requirement to think of the vignette as a single idea, presents the rating sale, and then the vignette. The respondent has no problem reading and evaluating 24 of these vignettes, with the entire process taking about 3-5 minutes. Most respondents to whom we have talked felt that they were ‘guessing’, but the exact opposite turned out to be the case, as their data revealed consistencies that would make the data appear to be valid.
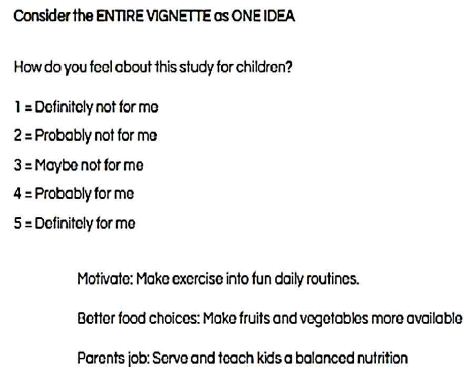
Figure 4: Example of a test vignette, showing the rating question and the rating scale
Acquiring Data, Transforming Ratings, and Creating Equations
The ratings for each respondent for each vignette are acquired as processed within moments. The basic information for the respondent (age, gender, answers to the seven self-profiling classification questions) are captured at the start of the respondent interview on the web, and remain constant for the 24 vignettes that the respondent evaluates. When the respondent evaluates a specific vignette, the database captures the structure of the vignette in terms of 16 numbers, one column for each number, each column corresponding to a specific element. The database also inserts the order of the rating, from 1 (tested as the first vignette) to 24 (tested as the 24th vignette). This information will make it possible to evaluate any effects due to order of testing. Then database then captures the rating on the 5-point scale, and the response time, defined as the number of seconds (to the nearest hundredth of a second elapsing between the time that the vignette appeared and the tie that the respondent rated the vignette.
The rating itself, a 5-point Likert scale is easy to create, but for everyday practice the meaning is often elusive. Managers simply do not know what to do when they get an average rating. As simple as that sounds, the reality is far more problematic. Most managers using these scales ask whether the effect is significant, meaningful, or more telling ‘now what should I do with these numbers?’ Research practices among consumer researchers and public opinion pollsters is to convert the Likert Scale to a yes/no scale. For our study we make two conversions.
TOP 2 – Positive response — Ratings of 5 and 4 are converted to 100, ratings of 1,2,3 are converted to 0, and a vanishingly small random number is added to the converted values so that the OLS regression will ‘not crash’, even when a respondent confines the rating either to 4 and 5, in which case the transformed rating for all 24 vignettes will become 100, or to 3,2,1 in which case the transformed ratings will all become 0.
BOT2 – Negative response – Ratings of 1 and 2 are converted to 100, rating 3,4,5 are converted to 0, with a different but vanishingly small rando number is add to the transformed rating.
Relating the Presence/absence of the 16 Elements to the Transformed Ratings
The objective of Mind Genomics is to link the elements to the ratings, and by so doing more profoundly understand the mind of the respondent. As emphasized above, the approach avoids the use of a simple survey wherein the respondent is presented with a series of ideas, one idea at a time, and instructed to rate the idea on a scale. Yet with the respondent presented what must seem like a proverbial ‘blooming, buzzing confusion’ in the worlds of Harvard psychologist William James how can the researcher ever disentangle the individual contributions of the distinguishable elements.
The answer to the foregoing lies in the underlying use of the permuted experimental design, used to create the 24 vignettes for each respondent. We know that the combinations were selected to ensure that we could estimate an equation for each respondent separately as well as a single equation for any defined group of respondents. Furthermore. We know that the individual models can be estimated without fear that the regression process will ‘crash’ because of either multicollinearity among the independent variables, or lack of variation in the dependent variable.
Our equation is: Dependent Variable = k0 + k1(A1) + k2(A2) … k16(D4)
The dependent variable can either be TOP2 or BOT2.
To relate response time (RT) to the presence/absence of the 16 elements we use the same equation but do not estimate the additive constant: RT = k1(A1) + k2(A2) …+ k16 (D4)
We estimate the equations quite easily once we know the members in the group viz., which specific respondents
Finally, the fact that we can estimate individual-level models, with the additive constant and the 16 coefficients, doing so for each respondent, and based only on the data from that respondent means that we can divide people b the pattern of their coefficients. These are the mind-sets, created from, individuals who show similar patterns of the 16 coefficients (k1 – k16). We do not use the additive constant. The method is called k-means clustering [16], with the measure of distance of dissimilarity defined as (1-Pearson correlation between the two respondents, computed on the basis of their 16 corresponding coefficients.
Results
The Mind Genomics process generates a great deal of data, the most relevant of which are the additive constants and the positive coefficients. The negative coefficients need not be considered. Negative coefficients are the ‘absence’ of a positive coefficient, either a true negative feeling (not for me), or perhaps a rating of ‘may/may not be for me’ (rating of 3). In any case for the most important data (Total Demographic groups and Mind-set, we look at both TOP2 and BOT2.
All data tables presenting results for TOP2 and BOT2 have been edited so that only coefficients of +2 or higher are shown. Furthermore, for those tables, strong performing elements with coefficients of +8 or higher are show in shaded cells. For response time all coefficients are shown.
For TOP2 and for BOT2 we interpret the results as follows:
- The additive constant is the baseline. The baseline is the estimated percent of the respondent rating the vignette 4 o 5 for TOP2, or 1 or 2 for BOT2. Of course, the underlying experimental design ensured that all vignettes would comprise a minimum, of two elements and a maximum of four elements. The additive constant, viz., intercept in regression terms, is simply an adjustment factor. We can use it to give us a sense of the baseline likelihood of the person responding fits me (TOP2) or doesn’t fit me (BOT2).
- The element coefficient shows the increased percent of respondents saying fits me (TOP2) or doesn’t fit me (BOT2), when the element is inserted into the vignette.
- The coefficient tells a lot of the story about what drives the respondent. Keep in mind that frequently the respondent cannot really explain why she or he responded in certain way to a vignette, although when asked directly the respondent searchers for a plausible answer. Yet, the coefficients reveal that criterion, sometimes clearly, sometimes strongly, occasionally however failing to find any criterion for the decision.
Who the Person ‘IS’ (Total, Gender, Age)
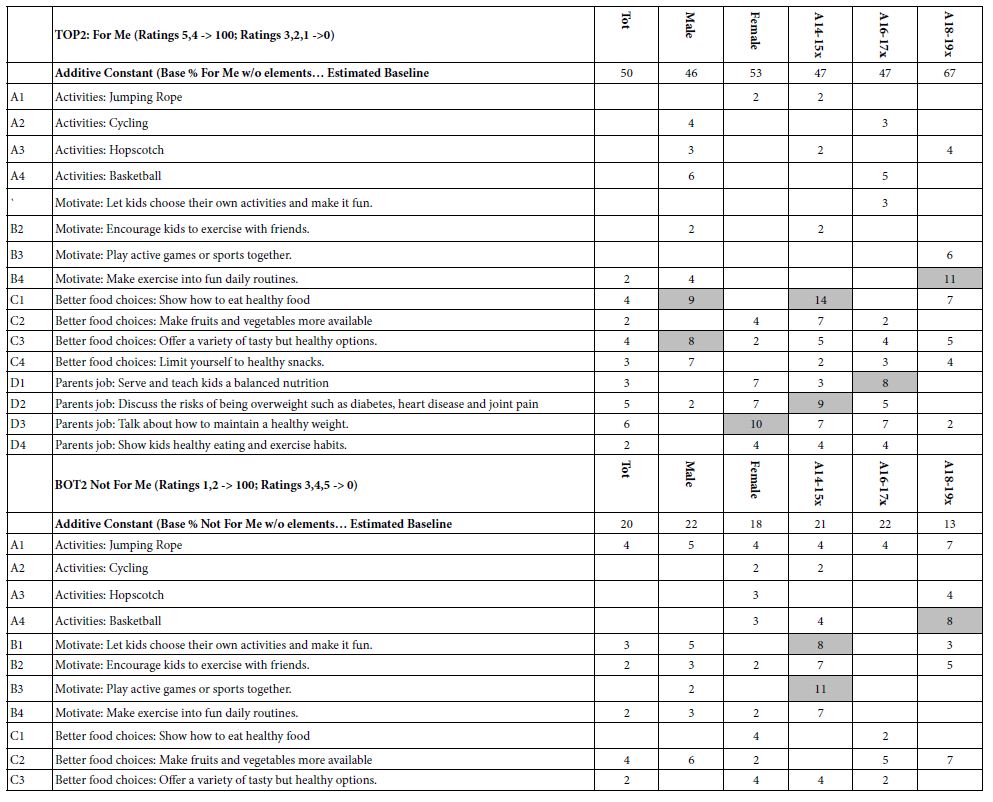
The first analysis (see Table 4, section for TOP2) shows the positive coefficients for Total Panel, gender, and age. There are clearly some elements which perform well, some which perform ‘very well.’ The additive constants hover around 50. The oldest groups of young people, age 18-19 are the exception, with an additive constant of 67, and a very strong element generating a coefficient of +11: Motivate: Make exercise into fun daily routines. When we look across all of the elements for these three groups, the story revolves around healthful living.
When we change the focus to the negative (see Table 4, second section, BOT2) we see far fewer elements which drive rejection, and thus the bottom of Table 4 is shorter. The elements which strongly drive rejection (not m) are those related to sports, and manifest themselves in the age groups.
Table 4: Positive coefficients for key demographic groups for TOP2 (For Me) and for BOT2 (Not For Me)
How the Respondents Describe Their Eating History and Weight
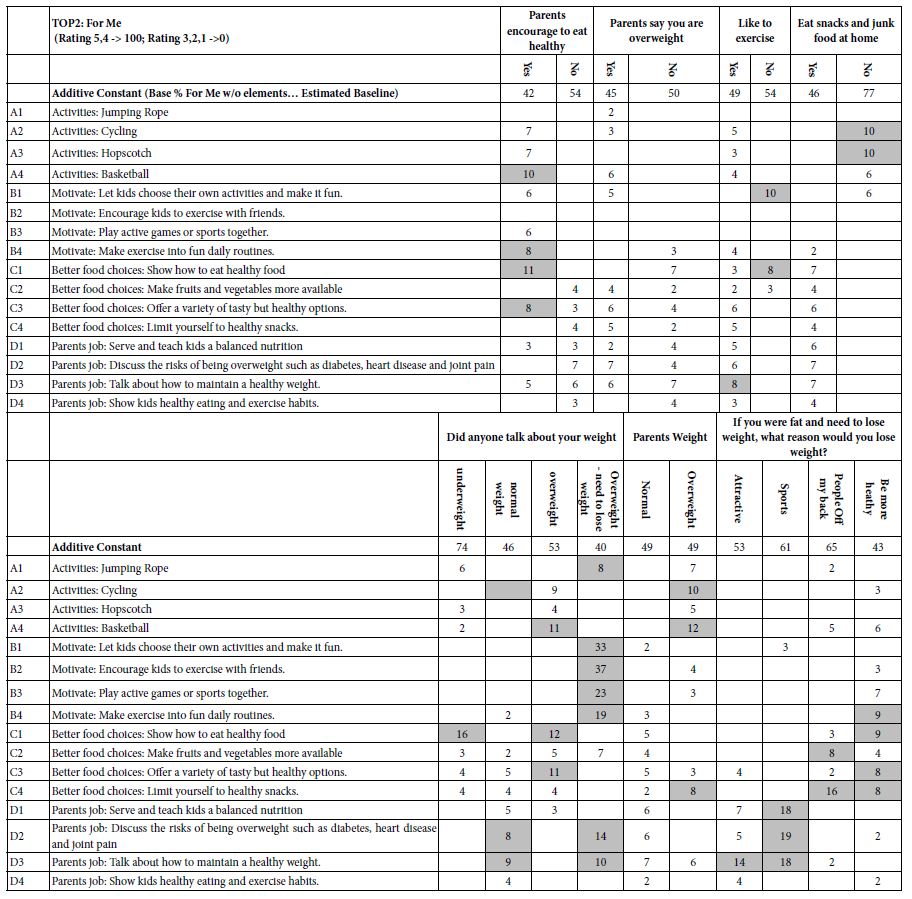
The respondents completed a self-profiling questionnaire, allowing the creation of new groups of respondents, based upon membership in each group. Depending upon the number of answers to the self-profiling question, each question generated a minimum of two mutually exclusive groups and a maximum of four mutually exclusive groups. In the interest of brevity, Table 5 presents only the data from TOP2 (For Me), again showing only the positive coefficients, and highlighting the strong performing coefficients with values of 8 or higher.
Table 5 shows a great many strong performing elements. The surface analysis of the results suggests that the data make sense. For example, for those respondents who say they don’t like to exercise, the strong performing element for the four exercise elements is B1 (Motivate: Let kids choose their own activities and make it fun), with a coefficient of +10. One could go through each of the cells in Table 5, because the results are ‘cognitively rich.’ That is, the Mind Genomics study deals with meaningful phrases as components of what is evaluated. Thus, any pattern which emerges comes with the advantage that the surface meanings of the components of the pattern are already known, and immediately accessible.
Table 5: Positive coefficients for key subgroups emerging from the self-profiling classification questionnaire
Creating Mind-sets
One of the foundations of Mind Genomics is the proposition that people differ from each other in virtually every aspect of human behavior where conscious decisions are made. We already classify people by who they ARE, what they DO, what they say the BELIEVE, and so forth. The issue of person to person variability should not surprise us. In countless ways we are reminded daily of the wondrous variety of human differences, whether these be in foods, in leisure activities, and even in the way one wants to be treated in a medical situation. To this end, researchers have recognized different groups, which they call ‘psychographic’ groups, groups based upon the values people hold, and the way that they think [17]. For many of these ‘psychographic’ approaches the development time and costs are sufficient encumbrances which end up motivating the creator to ensure that the different psychographic groups cover as much as possible in terms of topics. Thus, a study on the psychographics of weight control might deal with many topics of weight control and healthy living, take months to design and execute, require the involvement of professionals for analysis, and finally require a way to translate the general findings to a specific issue of immediately, local, and relatively modest relevance to the entire topic.
Mind Genomics works in the opposite direction, creating mind-sets, psychographic group, not to understand the general topic as such as to profoundly understand the specific topic. Thus, in this study, the topic is not weight control in general, but rather what can one do in a local situation. The data which emerge end up telling the researcher about the mind-sets in the population for this specific topic, along with exactly what to say to the population, and finally, with the help of another program (www.pvi360.com; personal viewpoint identifier), a way to assign a new person to a mind-set by asking six questions. The sheer granularity of the mind-sets, ensured by the limited and precise focus of the study, ends up producing information which is both instructive and actionable.
Table 6 shows the three mind-sets which emerge from the study. Recall that the respondents evaluated combinations, so that there was no way that any respondent could ‘game’ the study, and provide information that would be acceptable. The k-means clustering produces clearly defined groups, each group responding strongly to their own set of particularly convincing elements.
Table 6: Positive coefficients for thee emergent mind-sets for TOP2 (For Me) and for BOT2 (Not For Me)
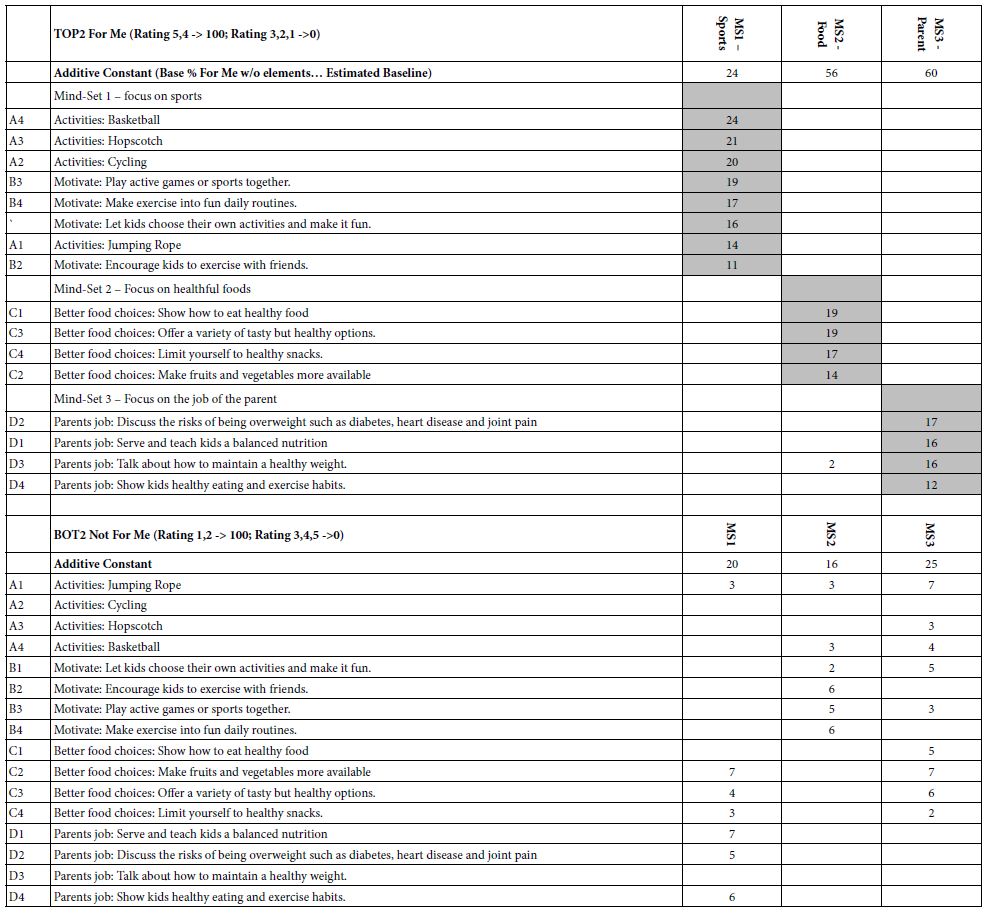
Mind-Set 1 (Sports) shows the lowest additive constant, 24. They are not ready to say ‘for me’ unless the topic is sports and exercise’. Nothing else interests them.
Mind-Set 2 (Food) shows a much higher additive constant, 56. They are ready to say ‘for me’, but the topic has to be food choice.
Mind-Set 3 (Parent) also shows a much higher additive constant, 60, with the focus on what parents should say.
Finally, when we look at the opposite, BOT2, Not For Me, we see an active but not very strong rejection of ideas other than those appealing to one’s mind-set. The preferences are clear and distinct.
Response Time as a Measure of Engagement with the Message
As part of the output of Mind Genomics effort, the BimiLeap program measures the response time to the vignette, operationally defined as the time in hundredths of seconds between the appearance of the vignette on the computer screen and the rating assigned by the respondent. The original assumption was that there might be some deeper ‘reality’ to be discovered when one moves from responses under ‘conscious control’ (willful responses, such as ratings), to responses not under ‘conscious control.’ There is a long history of response time in studies of behavior , giving a sense with the sense that some deep truth about the way we ‘think’ may emerge somehow when we measure non-conscious behavior instead of ‘considered’ actions [18].
In the world of consumer research, investigators are perennially looking for the ‘next thing,’ something which can be measured reliably, something which can tell the research about what the respondent is ‘really thinking.’ There is a fantasy in the mind of the researcher that somehow these measures contain within them deep knowledge about the ‘mind of the respondent’, knowledge which simply needs to be decoded from these deeper measures, such as response time. Figure 5 shows the distribution of ratings for the vignettes rated by the three mind-sets, as well as the distribution of the response times (right side). The simple answer is that there are no clear ‘underlying’ patterns for the three mind-sets that we saw from Table 6, patterns which revealed clearly different and interpretable ways of looking at the same information. The clarity of differences in mind-sets emerging from Table 6 becomes clouded when we look either at the distribution of ratings, or the distribution of responses times it is only when we have cognitively meaningful test stimuli, systematically varied, that the difference emerges.

Figure 5: Dot density plots of ratings on the 5-point scale (top) and response time in seconds (bottom). Each plot comprises the rating assigned to all vignettes, or the measured response time in tenths of seconds.
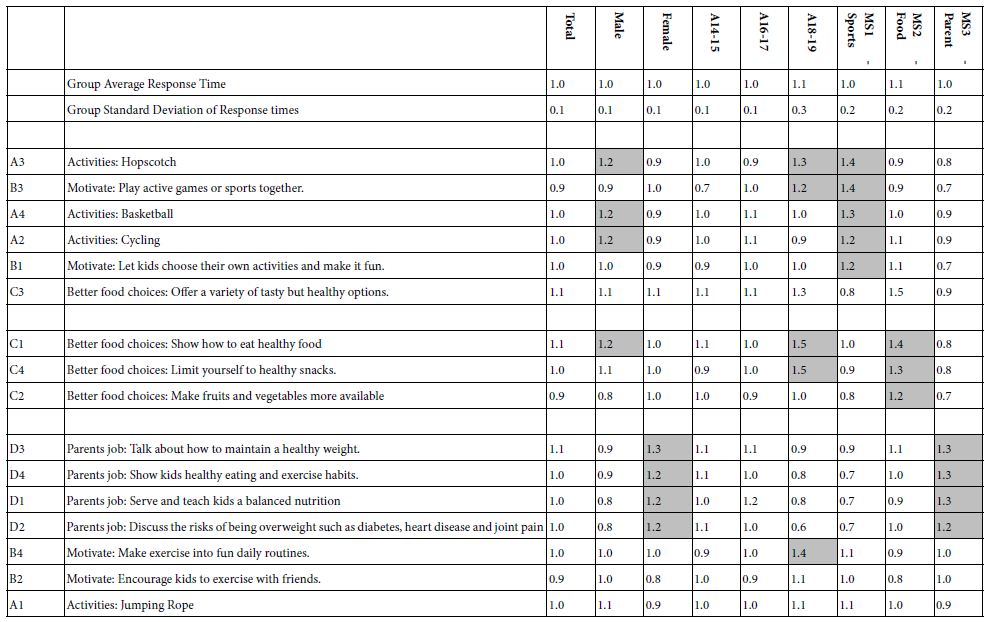
It may be that there is deep information awaiting us when we deconstruct the overall response times into the response times assignable to each of the 16 elements. Table 7 shows the coefficient for the response times attributable to each of the 16 elements by all key groups, viz., total, gender, age, and three mind-sets. All long response times, assumed to be elements which are engaging (or perhaps just difficult to read, are shown in shaded cells. Operationally, we chose 1.2 seconds or longer. Table 6 suggests that there are differences in strong performing elements among the groups, and even more interesting, the mind-sets spend longer time reading the elements with which they identify (viz., Top 2 in Table 6). Despite that, however, and perhaps sadly, there is no clear flash of deep insight emerging from the patterns of response times by elements by groups, whether self-defined groups or statistically created groups from cluster analysis.
Table 7: The estimated ‘time’ for each element, used for reading and processing the information, revealed by the deconstruction-by-regression of response times for reading individual vignettes.
Discussion and Conclusions
Issues such as nutrition are almost always left to adults. It is the job of the child or teenager to do what is ‘best’, but that ‘best’ is usually established by adults and forced on the child or the teenager. The rationale for such a strategy is reasonable and obvious – it is the adults who know the potential outcomes of a healthful versus a non-healthful diet. Knowledge alone does not suffice. A responsible, loving adult is often necessary, albeit one who is knowledgeable [19-21].
What is often unknown is the mind of the person who is the subject of the nutrition effort. One can measure the physical variables associated with the person, the person’s nutritional status, even the daily behaviors. At the same time, however, what is the mind of the individual? And, to be more direct, not what is the assumed mind of the person based upon a short interview with the person or with the parent, but rather what is the psychological makeup of the individual, the messages to which the person will respond, this child or teen. Of course, one may invoke the common answer that to know such information is easy; one need only hire a psychologist to interview the person, to diagnose, to recommend language. But, in turn, what happens when we talk about tens of thousands, hundreds of thousands, or millions of children for whom we need to know the words.
The study presented here suggests that it may be profitable to include children as researchers, discuss topics which are everyday and ordinary, and move beyond the confines of a simple questionnaire which stresses intellectualization and ‘one at a time thinking.’ A more holistic approach might be called for, one which at first might offend those who have been educated in the world of the hypothetico-deductive, where questions emerge from the data, where the literature comprises a gap to be filled, where knowledge is the accretion of hypotheses that have succeeded in avoiding being ‘falsified’, in the true tradition of scientific exploration [22,23]. Rather, the study here suggests that it is the naïve questions posed by student researchers which can bring us a long way towards understanding thinking about food, bodyweight, obesity, and perhaps diabetes, although one might well like to work with students who have some familiarity with the concept of diabetes, and with respondents who are closer to the world of diabetes than our random 71 respondents studied here.
The paper closes with the caveat that the effort was done simply as an exploratory investigation to answer a quick question from a colleague. That humble origin of the study should not be held against the information gained from the research exercise. The study did not emerge as an answer to the ‘call from the literature,’ nor as an effort to ‘fill a hole or plug a gap in the literature.’ Rather, the study emerged as data-based practical answers to a question, the approach using the scientific method to create archival, relevant knowledge, giving a voice to prospective researchers with potential novel, valuable ingoing points of view.
References
- Felber JP, Golay A (2002) Pathways from obesity to diabetes. International Journal of Obesity 26: S39-S45. [crossref]
- King LA, Loss JH, Wilkenfeld RL, Pagnini DL, Booth ML, et al. (2007) Australian GPs’ perceptions about child and adolescent overweight and obesity the Weight of Opinion study. British Journal of General Practice 57: 124-129.[crossref]
- Kranjac AW, Wagmiller RL (2020) Decomposing Trends in Child Obesity. Population Research Policy Review 39: 375-388.
- Levin NZ, Cohen M, Phillip M, Tenenbaum A, Koren I, et al. (2022) Youth‐onset type 2 diabetes in Israel: A national cohort. Pediatric Diabetes 23: 649-659. [crossref]
- Helm KK (2007) Nutrition therapy: Advanced counseling skills. Lippincott Williams & Wilkins.
- Black JA, White B, Viner RM, Simmons RK (2013) Bariatric surgery for obese children and adolescents: a systematic review and meta‐analysis. Obesity Reviews 14: 634-644. [crossref]
- Boles DZ, DeSousa M, Turnwald BP, Horii RI, Duarte T, et al. (2021) Can Exercising and Eating Healthy Be Fun and Indulgent Instead of Boring and Depriving? Targeting Mindsets about the Process of Engaging in Healthy Behaviors. Frontiers in Psychology [crossref]
- Borra ST, Kelly L, Shirreffs MB, Neville K, Geiger CJ (2003) Developing health messages: qualitative studies with children, parents, and teachers help identify communications opportunities for healthful lifestyles and the prevention of obesity. Journal of the American Dietetic Association 103: 721-728. [crossref]
- Farrow CV, Haycraft E, Blissett JM (2015) Teaching our children when to eat: how parental feeding practices inform the development of emotional eating a longitudinal experimental design. The American Journal of Clinical Nutrition 101: 908-913. [crossref]
- Schwartz MB, Brownell KD (2007) Actions necessary to prevent childhood obesity: creating the climate for change. Journal of Law, Medicine & Ethics 35: 78-89. [crossref]
- Bucknall S (2012) Children as researchers in primary schools: Choice, voice and participation. Routledge.
- Moskowitz HR (2012) ‘Mind Genomics’: The experimental, inductive science of the ordinary, and its application to aspects of food and feeding. Physiology & Behavior 107: 606-613. [crossref]
- Pantzar M (1996) Rational choice of food: on the domain of the premises of the consumer choice theory. Journal of Consumer Studies & Home Economics 20: 1-20.
- Palanisamy P (2018) Hands-On Intelligent Agents with OpenAI Gym: Your guide to developing AI agents using deep reinforcement learning. Packt Publishing Ltd.
- Gofman A, Moskowitz H (2010) Isomorphic permuted experimental designs and their application in conjoint analysis. Journal of Sensory Studies 25: 127-145.
- Likas A, Vlassis N, Verbeek JJ (2003) The global k-means clustering algorithm. Pattern Recognition 36: 451-461. [crossref]
- Novak TP, MacEvoy B (1990) On comparing alternative segmentation schemes: the list of values (LOV) and values and life styles (VALS). Journal of consumer research 17: 105-109.
- McClelland JL (1979) On the time relations of mental processes: an examination of systems of processes in cascade. Psychological Review 86: 287-330.
- Seshadri SR, Ramakrishna J, Rao Seshadri S, Ramakrishna J (2018) What Do the Children Eat in Schools? Teachers’ Account. Nutritional Adequacy, Diversity and Choice among Primary School Children: Policy and Practice in India 125-141.
- Story M, Resnic MD (1986) Adolescents’ views on food and nutrition. Journal of Nutrition Education 18: 188-192.
- Thomas SL, Olds T, Pettigrew S, Randle M, Lewis S (2014) “Don’t eat that, you’ll get fat!” Exploring how parents and children conceptualise and frame messages about the causes and consequences of obesity. Soc Sci Med 119: 114-122. [crossref]
- Lawson AE (2000) The generality of hypothetico-deductive reasoning: Making scientific thinking explicit. The American Biology Teacher 62: 482-495.
- Schleider JL, Schroder HS, Lo SL, Fisher M, Danovitch JH, et al. (2016) Parents’ intelligence mindsets relate to child internalizing problems: Moderation through child gender. Journal of Child and Family Studies 25: 3627-3636.