Abstract
Respondents ages 15-21 each rated 24 vignettes, combinations of messages about the experience of learning a second language in high school. The vignettes were created according to an experimental design, developed from four aspects (questions), each with four elements (answers to the questions). The vignettes comprised combinations of 2-4 elements, at most one element from each aspect, rating each vignette on a two-dimensional scale (Describes me vs Does not describe me; Leaves me with a good feeling when I read vs leaves me with a bad feeling when I read it). The elements were chosen by a high school sophomore, to represent how a young researcher would approach the topic, and how the researcher could work with respondents of approximately the same age. The approach reveals differences in personal experience with learning a second language, across genders, age groups, and across emotional response to the experience. A few elements emerged as important when the respondents were divided by WHO they were (self-profiling). Stronger, more insight-driving differences emerged when the respondents were clustered into Mind-Sets, based upon the patterns of their responses. The experiment suggests the potential for having young researchers study their contemporaries, using a templated approach, but with the contribution of artificial intelligence (Idea Coach) to help the process while still keeping the young researcher deeply involved, and in control.
Introduction
The study reported here on the feelings about learning a second language emerged from a discussion between authors Kornstein and Moskowitz about the system of education, especially regarding the student experience, specifically language education. There is significant literature on the different aspects involved in learning a second language in high school, most of practical nature. There are many facets of the issue, although most of the literature focuses on issues involving how to teach the language, especially today with on-line classes , what to teach and how to with student issues [1-7].
Although the literature does have relevant papers on language learning from the perspective of the student, a great number of these are geared to solving issues which emerge from difficulties experienced by the student . There is little in the way of simple but scientific understanding of the quotidian, everyday experience. Such understanding is left to literature, often autobiographical but just as often fiction written from the point of view of the student in the experiential ‘moment’ of learning the language [8-11].
It is to the disciplined study of one’s recollection of learning a second language that we turn to in this paper. Rather than focusing on the nature of problems, we look at the actual experience using the emerging science of Mind Genomics. The objective is to lay out the alternative aspects of what is experienced, see what the respondents choose as their experience, and their feelings towards that which is experienced. The Mind Genomics approach provides a new approach to augment existing approaches in education. Mind Genomics has already been used to explore education in third grade mathematics, not done by teachers or scientists looking into the experience, but rather from the mind of an eight-year-old researcher, looking out from her own experience, to forecast what might happen in a decade (Mendoza et. al., 2023B). The foregoing applications of Mind Genomics to the quotidian world, the world of the everyday, is just one of a number of papers appearing now, papers which demonstrate the ability of the student researcher to approach the world in rational, scientific manner [12].
The Mind Genomics Worldview of Daily Experience
Mind Genomics is an emerging science of everyday experience, areas of daily life that are overlooked because of the nature of their sheer ordinariness. We live, however, in the world of the everyday when we make our decisions. Indeed, most of our world runs reasonably smoothly because people recognize the regularities of nature, including the regularities of the world around as created by other people. At the same time, one could ask a scientist to list out the key factors in almost an experience, classify them, and then explain how people make decisions regarding these regularities. The level of lack of knowledge will amaze. We know at an intuitive level, or more correctly, we are probably able to surmise what are the key factors in everyday life. On the other hand, for a specific situation, e.g., when trying to sell something to another person, a few moments of being challenged about what exactly to say to make the sale quickly reveals glaring gaps in practical knowledge.
It is to refocus one; s attention on the science of the sheer ordinary that Mind Genomics was born in the 1980’s. A great deal of the literature at that time was emerging from laboratories of behavioral science, where the test subject was presented to specific test stimuli in an artificial situation, to understand one or another behavioral principle. It was in this situation that Skinner’s Behaviorism began [13], with principles of reinforcement and continued behavior demonstrated through unusual situations, e.g., pre-defined ‘schedules of reinforcement’ to illustrate specific aspects of behavior.
At the same time as Behaviorism was uncovering principles of behavior using artificially created situations, there was another set of developments, best referred to as consumer psychology or consumer behavior. A great deal of that topic was developed to study how people make real world decisions. The stimuli might be ordinary, or systematically varied, but the topic was the essentials of everyday life, the things, and the experiences relevant to people. The interest was in the rules governing the ordinary, the behavior of the person as an everyday consumer. The interest in consumer psychology was motivated by science and by business at the same time. The key, however, remains the sheer real nature of the focus. What do consumers really want? [14-16].
The Mind Genomics Approach – Explicating it through a Study on Education
An easy way to understand the approach, results and implications of Mind Genomics is through a study. Studies with Mind Genomics are easy to set up, quick and inexpensive to implement, and rich with data revealing patterns, some already known, others delightfully new. The study presented here deals with the experience of students studying a second language in high school. The approach is to let a high school student be the researcher, let high school age and slightly older students be respondents, and uncover the mind of students perhaps not before well understood.
When developing the idea for this study on education, the selection of the ideas was specifically left to author Kornstein, a second-year high school student. Rather than imposing one’s ideas on the research, the decision was made to avoid any input except for technical (grammatical) changes of the raw materials (questions and answers/elements). The only outside input to the study was the creation of the two-sided rating scale, explained below. The strategy of making the study reflect the mind and interests of the high school student provides a new way to understand a topic, an understanding not so much from the outside in (adult studying the student), but rather from the inside studying the inside (student studying the student).
Step 1: Select the Name of the Study
Although one might consider naming to be minor, that is not the case. From many Mind Genomics studies the observation has continued to emerge that ‘naming’ the study is an important first step in focusing the researcher on the topic. All too often the first attempt to name the study ends up with the student providing an entire sentence about what is to be studied. Naming the study forces the student to become more open, not to focus on specifics. Parenthetically, the same issue occurs in today’s PhD researchers, who define themselves, their ‘field of study’ by the method that they use to gather the data, rather than by the science to which they are trying to contribute. These students and often newly minted researchers think of their science as their research method rather than the underlying research problem.
Figure 1 (top row, left panel) shows a screen shot of the BimiLeap program (www.BimiLeap.com), the program which allows the researcher to do the study by following a template.
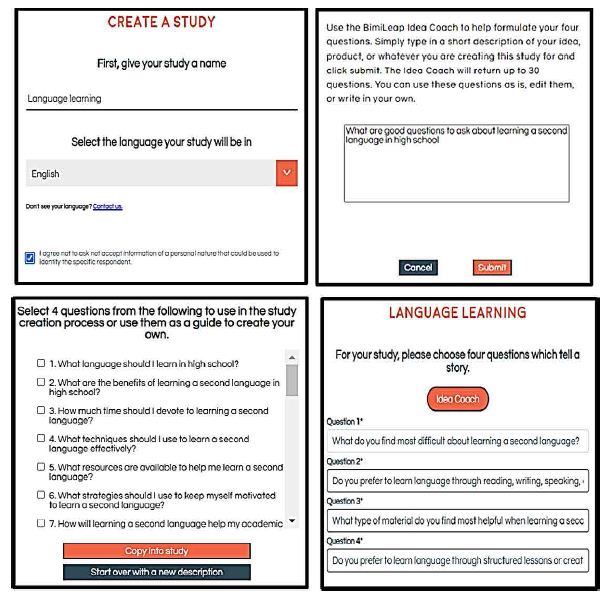
Figure 1: Set up for the Mind Genomics study on studying a second language
Step 2 is the hardest part of the study for the researcher, often for the simple reason that we are not taught to ask questions, but rather taught to answer questions that are posed to us. Therefore, our thinking ends up being scattered. We can ‘tell a story’ if we are asked to do so, but we usually don’t think of a topic in terms of a story which unfolds, within a structure. Were we to be educated to do so, we might begin investigations with a series of questions allowing us to paint a simplified picture of a topic. Mind genomics works in that way.
In previous versions of Mind Genomics, the effort to create these ‘questions’ was so great that quite often the aspiring user simply ‘gave up,’ with a statement of resignation about simply not being able to create thee questions. Other researchers kept going, and in most cases afterwards successfully developed questions, after what seems in retrospect to have been a harrowing, frustrating experience.
Since the end of 2022 the Mind Genomics program, BimiLeap, has incorporated the Idea Coach, using artificial intelligence. The researcher simply types in something about the topic, preferably that ‘something’ being close to the specifics. Figure 1 (top row, right panel) shows the ‘squib’ or little paragraph describing the issue. Figure 1 (bottom row, left panel) shows some of the 30 questions emerging from Idea Coach. Figure 1 (bottom row, right panel) shows the four questions selected by the researcher.
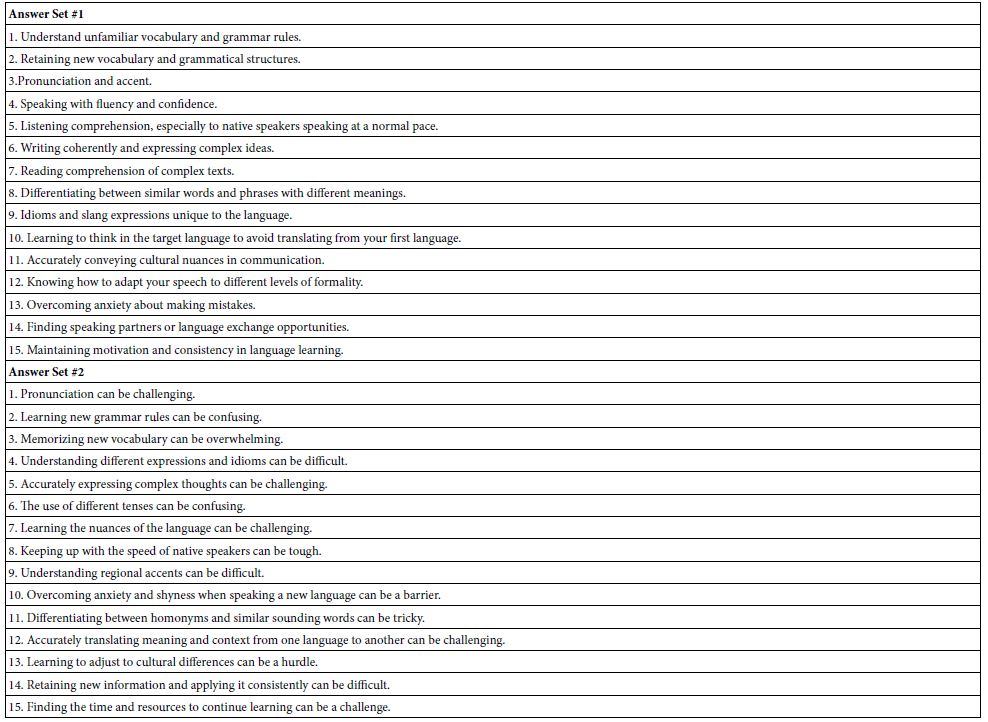
A sense of a set of 30 questions emerging from Idea Coach appears in Table 1. Using Idea Coach with the same ‘squib; (top row, right panel) a second and third time will produce a different set of questions. Table 2, in turn, shows two sets of 15 answers to question 1, these answers produced by the same query to the Idea Coach, with Idea Coach returning with two different sets of answers.
Table 1: 30 questions emerging from Idea Coach when presented with the statement: What are good questions to ask about learning a second language in high school.
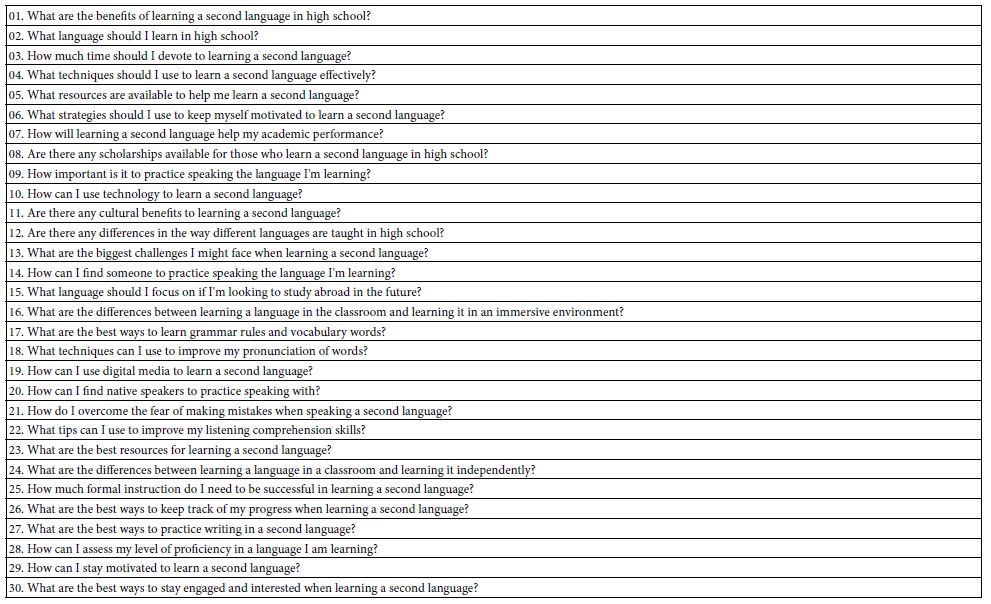
Table 2: Two sets of 15 answers each for question 1 (what is hard for me when learning a second language).
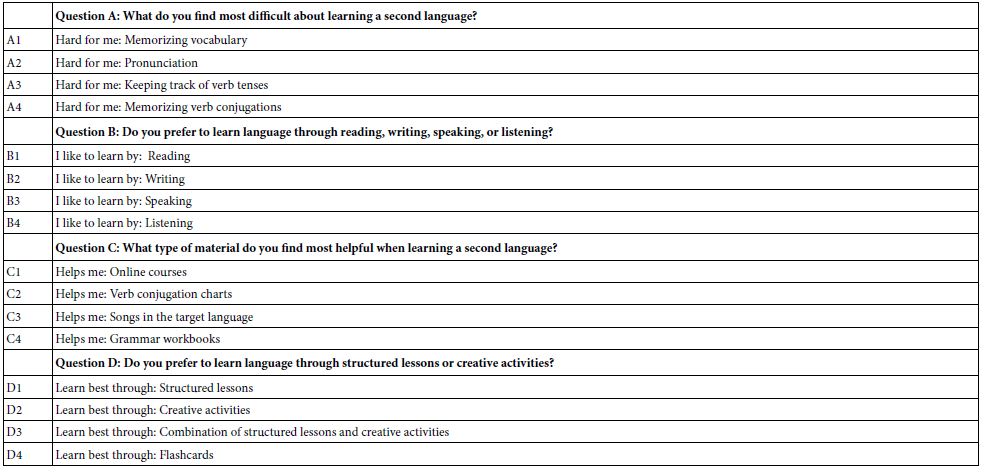
The actual questions and answers appear in Table 3. These are provided by the researcher, or provided by the Idea Coach, with the researcher enabled to modify them.
Table 3: The four questions and the four answers (elements) to each question as selected by the researcher and used in the study.
The actual test stimuli, however, moves beyond the single elements, and into combinations of elements. The combinations themselves are not random, although to an untrained eye they might appear to be a ‘blooming, buzzing confusion’ in the words of Harvard psychologist, William James [17]. Nothing could be further from the truth. The combinations or vignettes are put together using an underlying experimental design, a set of planned combinations, with the combinations set up to allow further statistical analyses. Figure 2 shows a screen shot of some combinations tested, that screen shot coming from the drop-down menu of the actual study, available to the researcher after the study is completed.
Each respondent evaluates a set of 24 vignettes, the vignettes set up with the following properties:
- The 16 elements are statistically independent of each other. This statistical independence means that the data from each respondent can be analyzed by OLS (ordinary least-squares) regression modeling [18].
- Each element appears exactly five times in the 24 vignettes evaluated by a respondent and is absent from 19 of the vignettes.
- Each vignette comprises at most one element or answer from a question, but many vignettes comprise two or three elements, not four. This property, incompleteness, allows the researcher to use OLS regression to estimate the absolute contribution of each element to the rating or to a transformed rating, as will be discussed below.
- Each respondent evaluates a different set of combinations, but mathematically the combinations evaluated by the respondent are ‘formally’ identical. That is, the system creates one basic design, the kernel design, and permutes the design so that each respondent ends up evaluating different combinations, but the design is of the same structure. That mathematics is powerful, because now everyone can be separately analyzed. Furthermore, and metaphorically like MRI (magnetic resonance imaging), the researcher can explore different combinations, and will end up with a better ‘picture’ of responses to the underlying elements. In other words, the researcher can explore the ideas, rather than simply waste money ‘testing’ the correctness of an idea. This latter thinking, exploration rather than confirmation, is a potential ‘game changing’ notion for psychological science [19].
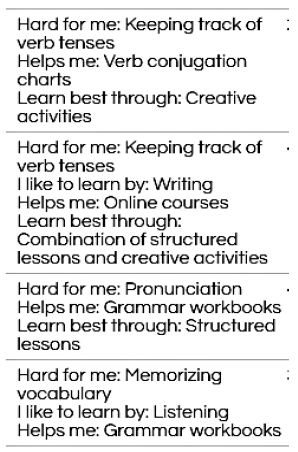
Figure 2: A screen shot of four vignettes
Step 3: Create Self-profiling Questions, Create the Rating Scale, Record One’s Own Thoughts a about the Study, and Select the Source of Respondents for the Study, When the Study is Executed ‘in the Field’
Table 4 (Part A) presents these questions. They provide information about the respondent that would not be otherwise obtainable, since the identity of the respondent is confidential, maintained so by the on-line panel provider (Luc.id Inc.).
Table 4: Key information about the reported back as part of the results of the study. The table summarizes key features of the study, providing a record for the researcher.
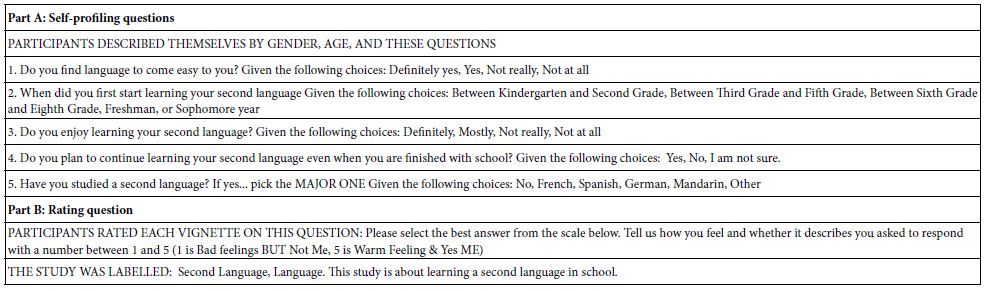
Table 4 (Part B) presents the actual rating scale. The rating scale comprises two parts, a section dealing with whether the respondent feels that the test vignette describes the respondent (rating 5 and 4) or does not describe the respondent (rating 1 and 2). The second part of the scale deals with the feeling of the respondents about what is read, whether the feeling of a positive experience (ratings 5 and 2) or feeling of a negative experience (ratings 4 and 1).
Figure 3 shows four screen shots for different parts of the set up.
- The top left panel shows a screen shot for one of the self-=profiling questions. The researcher needs simply to type the question in the large rectangle above, and type alternative answers in the small rectangles below.
- The top right panel shows the open-ended question.
- The bottom left panel shows the space where the researcher must provide some information about the study from the researcher’s own point of view. The information is often important to record at the start of the study, just after the study has been set up, so that the background for the research is ‘fresh’ in the researcher’s mind.
- The bottom right panel shows the options about getting respondents, and about privatizing the data so no one can see the results.
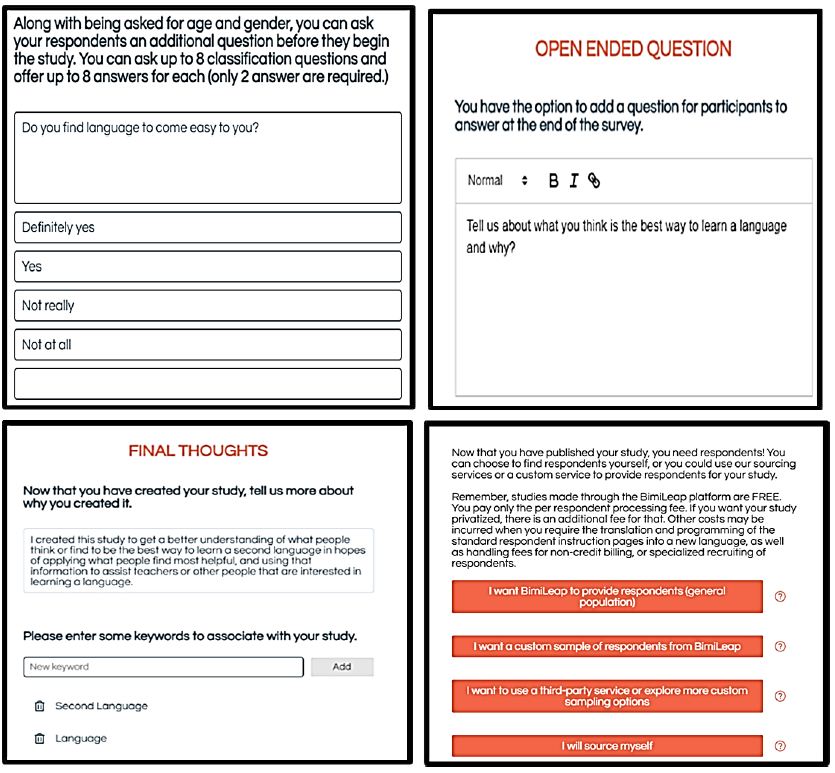
Figure 3: Questions, final thoughts written by the researcher as a record, and choice of respondents
Step 4: Executing the Study with Respondents
The respondents are invited to participate by a company specializing in so-called on-line panels, viz., individuals who have agreed to participate in these studies The respondents are compensated by the panel provider. The identity of the respondent is unknown. The Mind Genomics researcher can specify aspects of the respondent, such gender, age, location (country, state), income and so forth. These selection criteria are built into the Mind Genomics system. Other features of recruiting can be done but require additional effort.
For this study, the objective was to work with students of high school age, and recent graduates, with a low of 14 years old and a high of 19 years old. The actual study returned 104 respondents, but 16 were eliminated from the database because they were either too old or too young, leaving 88 qualified respondents. The age was known because the respondent had to select the year of birth.
The study set up took about 90 minutes. The actual study in the ‘field’ was about 60 minutes from invitation to the respondent by the panel provider (Luc.id) to the completion of the study with 104 respondents. It is worth noting that many organizations prefer to use their own panelists which make sense, but which end up taking days, weeks, and sometimes never completes. With on-line panel providers involved, the weeks and days shrink to hours and minutes.
Create ‘Meaningful’ New Dependent Variables by Transforming the Rating
It is the nature of researchers to want to work with the numerical response scales that they use. After all, goes the thinking, the scale has been set up with a great deal of effort. Furthermore, in the mind of the researcher the scale is even more attractive because the ratings can be readily analyzed by the powerful statistical programs to which researchers have become accustomed.
There is only one negative to the foregoing pictures, something that practitioners learn, often painfully. That negative is the demonstration in action that the ‘client’ who will use the information, usually a manager, cannot easily interpret the data. No matter how one proudly proclaims the power of the scale, the bottom line is that many managers ask a simple, almost naïve question, the general sense being ‘what does this number mean? Is it good or bad? Should I worry?’
The foregoing question ‘what does this number mean’ is not to be sneered at. The question is serious because often the manager has to make a business decision based upon the data. The decision IS NOT embedded in an appeal to statistical significance. Users of data don’t understand that type of talk, not really. What they do understand is ‘Am I ok or am I in trouble.’ Maybe the words differ from person to person, but the essence of the question of ‘what do I do with these numbers?’
Over decade of experience implementing these studies and sharing/explaining the results, researchers have often ended up saying ‘good or bad’. It is much easier for a user of the data to understand good and bad as scale anchors and perhaps a percentage of the population choosing one or other, good vs bad, pass vs fail, promising vs not promising.
When setting up the scale, the researchers chose to combine two dimensions into one scale, and to explore the opposites of each dimension. The first dimension is ‘fits me’ versus doesn’t fit me’. Rather than focusing on graduation of ‘fit’ vs ‘doesn’t fit, we look at a yes/no response, namely does fit (5 or 4) or does not fit (1 or 2). The second dimension is how I feel when I read the description. Ratings 1 4 are ‘feel bad’, ratings 2 and 4 are ‘feel good.’ Scale point 3 is a catch-all for the inability of the respondent to decide.
One might think that this use of two scales is difficult for the respondent. That supposition is correct, but after the first few evaluations the respondent feels comfortable. The benefit of using the two scales emerges when the researcher can use different types of dependent variables, one having to do with the degree to which the respondent ‘identifies’ with the messages, the others having to do with the emotions generated by the messages, viz., positive versus negative.
Relate the Elements to the Responses Using Regression Modeling
The essence of Mind Genomics is to assign numbers to ideas, viz., to messages, with these numbers reflecting how the respondent thinks about the specific message. Rather than asking the respondents to rate the separate ideas using a scale, Mind Genomics approaches the task in a more natural way, one less prone to bias, far less prone to guesswork by the respondent. The respondent evaluates combinations of messages, rating each combination on a scale. The respondent simply knows the criterion for the rating (e.g., applies to me vs does not apply to me, or gives me a warm feeling versus a bad feeling).
The Mind Genomics system cannot be ‘gamed’. The respondent cannot guess the correct answer. Within one or two vignettes the respondent stops trying to intellectualize the process, settling down to a simple S-R behavior, stimulus-response. The respondent receives a vignette, and almost without thinking, the respondent ends up answering using the scale. One might think that the results would be a meaningless jumble, making no sense, but the results make a great deal of sense as we see below. The objective to measure the real feeling of the respondent is in sight.
The actual analysis is done by means of statistical analysis, specifically ‘OLS’ (ordinary least squares) regression (Alma, 2011), a widely available, easily to use, easy to understand statistical procedure. The independent variables are the 16 elements, the data are set or sets of 24 rows of data. The 24 rows ‘coded’ the presence/absence of the elements. A ‘1’ in a row for a specific element means that the element is present in that vignette. In contrast, a ‘0’ in a row for that specific element means that the element is absent.
The regression procedure estimates the 16 coefficients. We do not use an additive constant. Thus, the story is entirely within the pattern of the 16 coefficients. The output is an equation of the form: DV (dependent variable) = k1(A1) + k2(A2) … + k16(D4)
Patterns of Responses
Tables 5-7 present the summarized data for the self-described groups. These groups are gender, age, effort, and the joy in learning (lowest versus highest). The strong performing elements (coefficients of 20 or higher) are shown in the shaded cells. Mind Genomics studies produce a great deal of data (viz., 16 coefficients for each group), requiring a strategy to present data in a way easy for the user to ‘get the picture.’ For this project, a coefficient +20 is significant in a statistical sense and seems to be meaningful from inspections of coefficients from previous experiments.
Table 5: Coefficients for models showing the degree to which each element is judged to describe the respondent assigning the rating. Each column refers to a specific subgroup of respondents, as the respondents describe themselves.
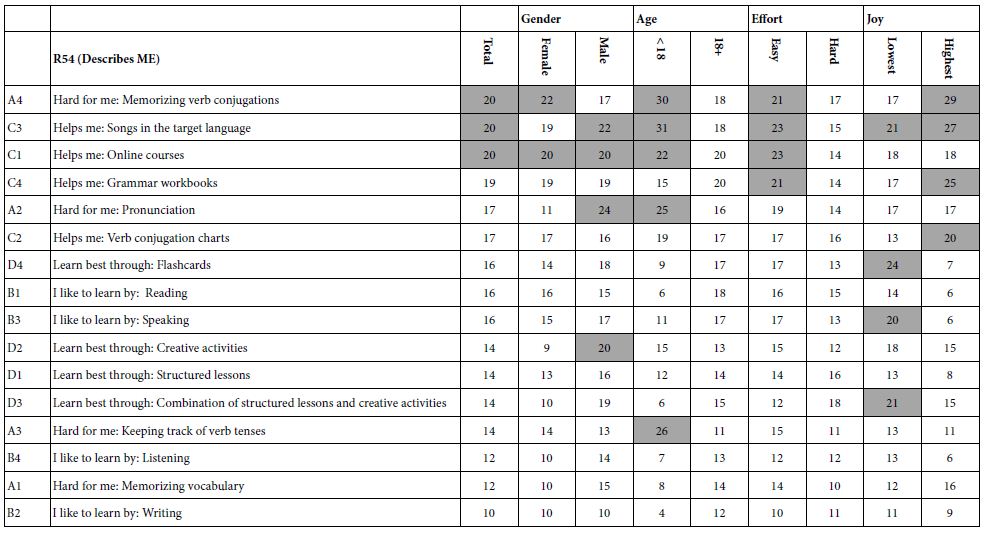
Table 6: Coefficients for models showing the degree to which each element is judged to generate a GOOD FEELING by the respondent. Each column refers to a specific subgroup of respondents, as the respondents describe themselves.
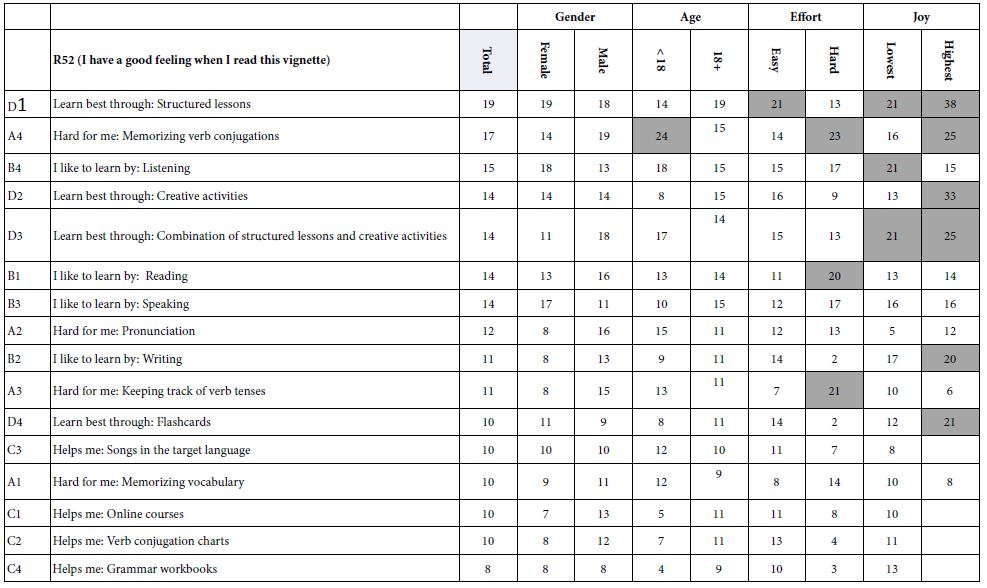
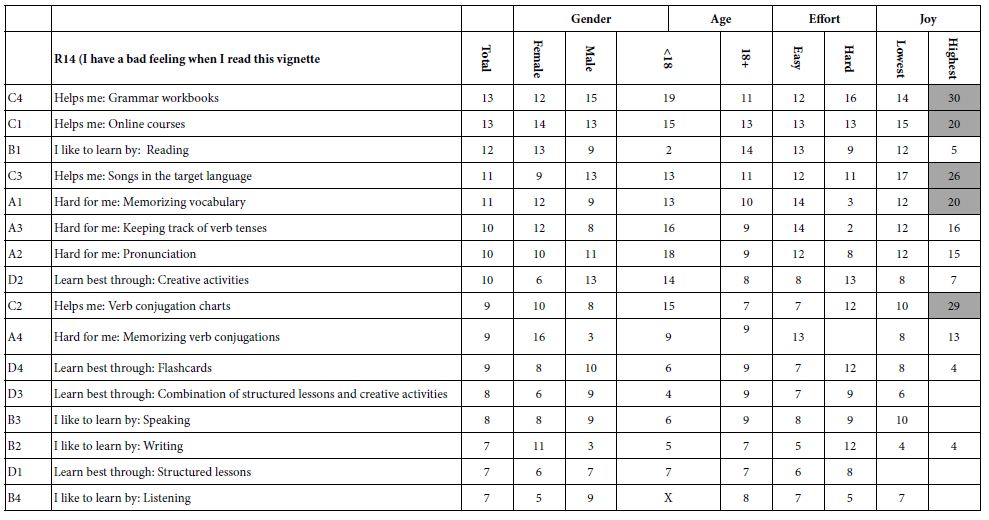
Table 7: Coefficients for models showing the degree to which each element is judged to generate a BAD FEELING by the respondent. Each column refers to a specific subgroup of respondents, as the respondents describe themselves.
Describes Me
Table 5 shows the elements which the respondent felt to describe them (ratings 5 and 4), whether the elements described a positive experience (rating 5) or a negative experience (rating 4). Strong performing elements appear in almost all self-defined groups. Overall, the three elements with which the respondents most frequently identified are:
A4 Hard for me: Memorizing verb conjugations
C3 Helps me: Songs in the target language
C1 Helps me: Online courses
It is important to keep in mind that the data are a snapshot of a person’s mind. There are no hypotheses in these studies, although they are conjectures that might be substantiated. Mind Genomics is set up as a system to explore the way people think about experience, rather than as a system to prove or disprove a hypothesis.
I have a good feeling I read this vignette,
A Good Feeling after Reading the Vignette (R52)
Table 6 shows the same type of analysis, this time for those scale points which reflect the respondent’s rating of having a good feeling after reading the vignette, whether or not the respondent identifies with the vignette. Again, the strong performing elements are shown in shaded cells. All cells with coefficients of 0 or lower are left blank in order to allow the pattern to emerge more clearly.
The patterns which emerge are less clear. The first pattern is the absence of clearly strong performing elements for total panel, for genders, and for ages. The second pattern is the emergence of strong performing elements among those respondents who say that they found it hard to learn a second language. The third pattern, and the one potentially most instructive, is the one which emerges when we look at the responses of individuals who say that they were very unhappy when they learned a second language. There were three ways to learn language that these respondents felt gave them a good feeling when they read them:
D1 Learn best through: Structured lessons 21
B4 I like to learn by: Listening 21
D3 Learn best through: Combination of structured lessons and creative activities 21
A Bad Feeling after Reading the Vignette (R14)
Table 7 shows the same type of analysis, this time for those elements which reflect the respondent’s rating of having a bad feeling after reading the vignette, whether or not the respondent identifies with the vignette. Once again, we are confronted with some paradoxical results. The strong negative feelings emerge for four elements, and, paradoxically, only among those respondents who felt that they were very happy when learning the second language. These strong, negative feelings emerged for
C4 Helps me: Grammar workbooks 30
C1 Helps me: Online courses 20
C3 Helps me: Songs in the target language 26
A1 Hard for me: Memorizing vocabulary 20
Deeper Understanding by Uncovering Mind-sets
A hallmark of Mind Genomics is the focus on mind-sets, defined operationally as groups of individuals who differ from each other in clear ways, when they are deciding about everyday issues or activities. In other words, different ways of thinking about the world of everyday. Mind Genomics moves beyond dividing people by WHO they are, or WHAT they do, or even how they THINK about general topics, focusing instead of the granular aspects of everyday life.
The project reported here on the way people think about learning a second language is set up for the discovery of mind-sets using the Mind Genomics methods. The actual process to discover the mind-sets has already been templated and is incorporated into the BimiLeap program. The only difference is that the ‘go-forward’ approach for Mind Genomics is to estimate regression models without the additive constant.
- Using OLS (ordinary least-squares) regression, estimate the 16 coefficients for an equation on a respondent-by-respondent basis. Even though each of the 88 respondents in this study ended up with a different set of 24 vignettes, the underlying experimental design ensured that those 24 vignettes would be exactly the 24 needed for a valid regression model, with all 16 predictor variables (presence/absence of elements) statistically independent of each, with equal numbers of appearance (n=5) for each element, and the presence of ‘zero’ conditions, to allow the estimation of absolute values for the 16 coefficients
- With the database of 88 rows of coefficients, use k-means clustering to generate exactly two groups, those groups defined by the ‘distance’ metric (1-Pearson R). The clustering was instructed to create two groups, whether the groups were interpretable or not. By definition, the clusters satisfied the appropriate mathematical criteria, viz., that according to the distance criterion, the respondents in a cluster were close together (minimize the distance between pairs of respondents), whereas the average profile of the 16 coefficients for the two clusters were as different as possible. This is the k-means clustering routine [20-23]. The results are two clusters, known as ‘mind-sets,’ in the language of Mind Genomics.
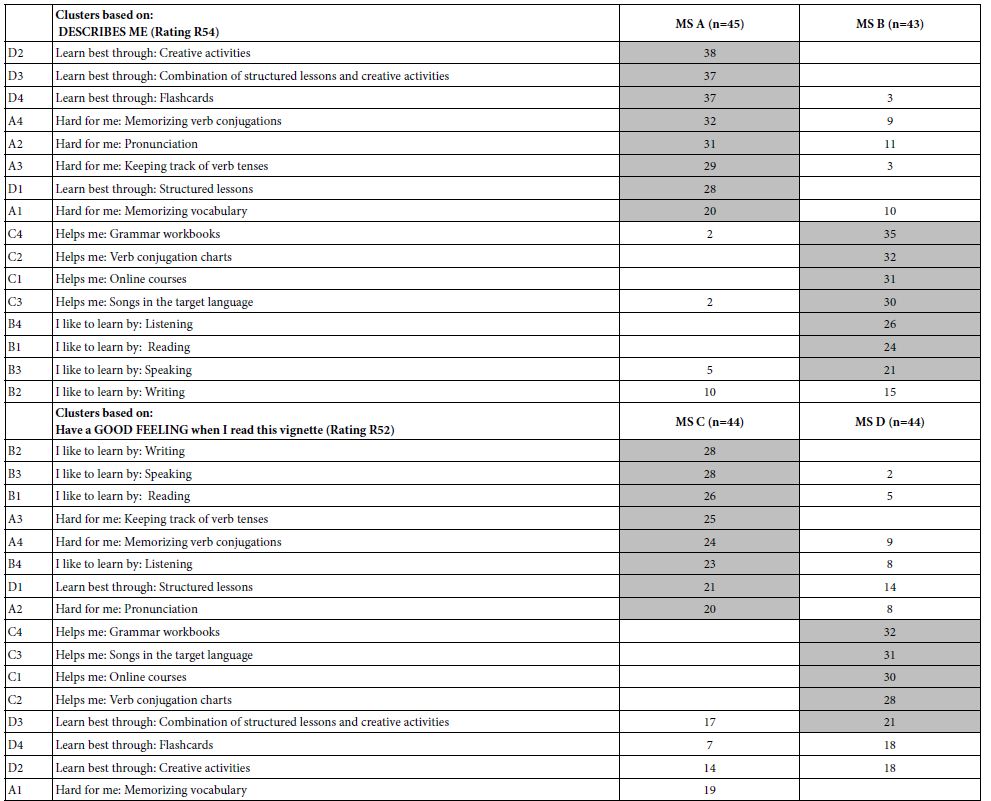
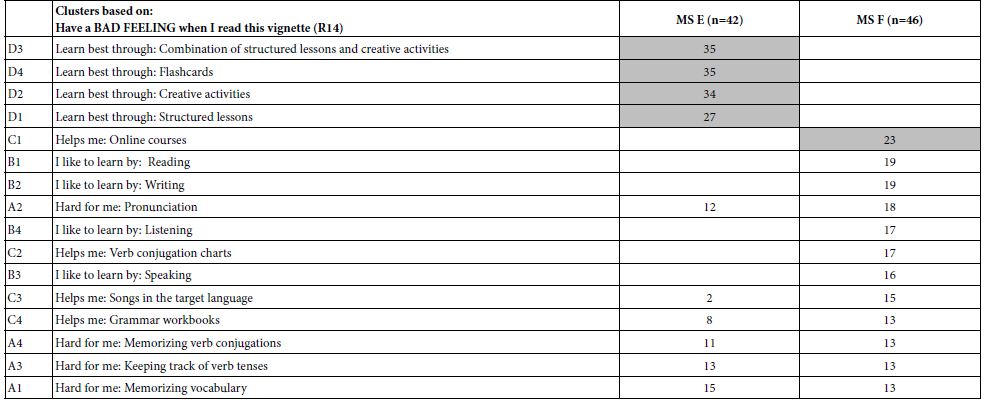
- Table 8 shows the pairs of mind-sets for the three important dependent variables: R54 (Describes Me), R52 (Good Feeling after reading the vignette), and R41 (Bad Feeling after reading the vignette. Once again, the strong performing elements are shaded (coefficient of 20 or higher), and very low coefficients (1 or lower) and shown by empty cells.
Table 8: Coefficients for pairs of complementary mind-sets (clusters)
The creation of mind-sets allows radically different groups to emerge.
Describes Me (Rating 54) reveals that Mind=Set A describes themselves as learning through active participation, whereas Mind-Set B describes themselves as learning by listening and doing grammar exercises. A three-cluster solution (not shown) shows the same overlap of features describing how the mind=sets see themselves. It may well be that students do not really know how they best learn.
Gives me a good feeling (Rating 52) reveals that Mind-Set C feels best with traditional methods, whereas Mind-Set D feels best with creative activities woven into the learning process.
Gives me a BAD feeling (Rating 14) reveals that Mind-Set E feels worst with traditional methods, whereas Mind-Set F feels worst with on-line courses.
Discussion and Conclusions
Our knowledge about the experience of learning a second language in high school typically comes from adults, either teachers who observe the process of a student being educated, or from professionals who interview the student, filter/digest the information, and finally interpret and report what they heard. The literature is large, as one might expect, because of the singular importance of education to our society.
This study provides a new direction for understanding education, as well as other topics. The study is titled ‘Empowering young researchers: Exploration of teen responses to learning a second language’. The objective is to let the student be the researcher, select the topics to be researched, and use the Mind Genomics tool to streamline the research process, converting into learning, rather than onerous data preparation.. The template makes the research easy to do, allowing the student research to focus on the topic, and not be intimated by difficulties either in starting the process, doing the actual research, and analyzing the results.
With the above taken into consideration, it becomes clear that learning a second language is not a simple thing, not a ‘cut and dried’ process. Although messages are clear, and although mind-sets emerge, it is clear that even to a respondent presented with vignettes, there is no clear division of respondents into different mind-sets. The experience of learning a language appears to be amorphous, fluid, not something which is clear. The clarity of thinking and polarization of mind-sets revealed by student researchers using Mind Genomics does not emerge when we deal with high school and slightly older respondents rating vignettes about learning a second language. Whether that is a failure of the method, a possibility, or indication of a far more complex word needing significantly expanded efforts, remains to be seen. Clearly, however, people do identify with different ways of learning the language and do have memories. It is simply the overall patterns which may elude us. Mind Genomics makes it possible for everyone to learn and discover, whether professional, student, even interested layperson.
References
- Fathman AK, Kessler (1992) Cooperative language learning in school contexts. Annual Review of Applied Linguistics, 13: 127-140.
- Jones J, Coffey (2016) Modern Foreign Languages 5: 11: A Guide For Teachers. Taylor & Francis.
- Pachler N, Redondo A (2007) A Practical Guide to Teaching Modern Foreign Languages In the Secondary School. Routledge.
- Tochon FV (2015) Mobile experiences of an adolescent learning Spanish online in a twenty-first century high school. International Journal of Pedagogies and Learning 10: 91-106.
- Bailey P, Onwuegbuzie AJ, Daley CE (2000) Correlates of anxiety at three stages of the foreign language learning process. Journal of language and Social Psychology 19: 474-490.
- McCafferty SG (2006) Cooperative Learning and Second Language Teaching. Cambridge University Press.
- Noels KA (2003) Learning Spanish as a second language: Learners’ orientations and perceptions of their teachers’ communication style. Language Learning 53: 97-136
- Ehrman ME (1996) Understanding Second Language Learning Difficulties. Sage.
- Raja B, Selvi K (2011) Causes of problems in learning English as a second language as perceived by higher secondary school students. Journal of English Language Teaching 1: 40-45.
- Trang TTT, Baldauf Jr. RB, Moni K (2013) Investigating the development of foreign language anxiety: An autobiographical approach. Journal of Multilingual and Multicultural Development 34: 709-726.
- Porras González NI (2010) Teaching English through stories: A meaningful and fun way for children to learn the language. Profile Issues in Teacher’s Professional Development 12: 95-106.
- Mendoza C, Mendoza C, Rappaport S, Deitel Y, Moskowitz H (2023) (C) Empowering young researchers: Cognitive economics and the features associated with minimum wage. Ageing Science and Mental Health Studies 7(1): 1-9.
- Smith LD, Woodward WR (1996) B.F. Skinner and behaviorism in American culture. Associated University Presses.
- Moskowitz HR, Gofman A, Beckley J, Ashman H (2006) Founding a new science: Mind Genomics. Journal of Sensory Studies 21: 266-307.
- Moskowitz HR (2012) Mind Genomics: The experimental inductive science of the ordinary and its application to aspects of food and feeding. Physiology & Behaviour 107: 606-613. [crossref]
- Porretta S, Gere A, Radványi D, Moskowitz H (2019) Mind Genomics (Conjoint Analysis) The new concept research in the analysis of consumer behaviour and choice. Trends in Food Science & Technology 84: 29-33.
- Dember WN (1990) William James on Sensation and Perception. Psychological Science 1: 163-166.
- Alma ÖG (2011) Comparison of robust regression methods in linear regression. International Journal of Contemporary Mathematical Sciences 6: 409-421.
- Gofman A, Moskowitz H (2010) Isomorphic permuted experimental designs and their application in conjoint analysis. Journal of Sensory Studies 25: 127-145.
- Likas A, Vlassis N, Verbeek JJ (2003) The global k-means clustering algorithm. Pattern Recognition 36: 451-461.
- Kissau SP, Kolano LQ, Wang C (2010) Perceptions of gender differences in high school students’ motivation to learn Spanish. Foreign Language Annals 43: 703-721.
- Mendoza C, Mendoza C, Deitel Y, Rappaport SD, Moskowitz H (2023) (A) Empowering young people to become researchers: What does it take to become a police officer? Psychology Journal Research Open 5(2): 1-12.
- Mendoza C, Mendoza C, Deitel Y, Rappaport S, Moskowitz HR (2023) Empowering young researchers through Mind Genomics: What will third grade mathematics look like in 10 years? Psychology Journal Research Open 5(3): 1-15.