Abstract
Two student researchers, one in middle school and the other in grade school, designed and executed an experiment to explore the different factors that other young people use when shopping for food for adults. Using a templated experimental design (BimiLeap), augmented with artificial intelligence, the researchers developed four questions and four answers (elements) to each question. The raw material for the study comprised the 16 elements combined by experimental design into 24 combinations, or 4950 vignettes tested across 100 respondents. The deconstruction of the responses by regression, followed by clustering, revealed two dramatically different mind-sets (focus on the experience of shopping versus focus on nutrition and healthfulness of the food). A third mind-set showed little polarization of responses. The study shows the potential of exploring topics of the everyday by students in grade and middle school, who bring a new perspective to a topic.
Introduction
The world of food selection and food consumption is replete with data, knowledge, insights, and practices. The reason for the abundance of knowledge is obvious; our very existence, and certainly our civilization is predicated on the smooth running of the world of food. And so a detailed review of the literature about food as an introduction to the topic of critical thinking about food ‘behavior’ is not necessary. What might well be a contribution is a study on how young people think about one or another ‘granular’ areas of food behavior. It is in that spirit that this paper focuses on ‘what do people think about the different factors involved when shopping for food?’
The literature on shopping suggests that children are 2-3 times more likely to be mentioned as the source of foods to be purchased in the store. Whether or not the child does the actual shopping, it is the child who exerts a great deal of influence. According to Kraak & Pelletier (1998) “Parents are two to three times more likely to name a child—- not themselves—-as the family expert for selection of fast food, snack food, restaurants, and new breakfast cereals. Market research reveals that children and teenage youth identify products more frequently by brand name rather than food category.”
Much of the information about shopping comes from questionnaires, with the information based upon one’s memory of who did what, and why. Gram (2010) points out that a great deal of what is assumed to be fact may not be as definitive as desired. There is little in the way of experimentation about shopping, and the experiments are often tied to a specific issue, done for a corporation, and stored in the corporate vaults until discarded. In Gram’s elegant questioning of what is presumed to be known “It is well documented that parents know that their children influence what they buy in supermarkets but it is also found that parents and children do not agree on just how much influence children have. Thus, a gap exists in the knowledge about what is actually happening in this grey zone of grocery shopping which seemingly cannot be solved through retrospective data collection. Family shopping is neither a completely rational nor conscious process, which makes the use of self-reported behaviour problematic.”
The origins of this come from separate roots. A literature search reveals that as far back as 2012, Bucknall (2012) published the results of a four-year practical effort to engage children in research. The volume is appropriately titled: Children as Researchers in Primary Schools: Choice, Voice and Participation. Bucknall presents the book as a challenge and a solution.
“How often do your primary school pupils have the opportunity to engage in open-ended, sustained pieces of work that offer them choice and control?
Do you find that the curriculum restricts openings to provide your pupils with real challenge? Is your school grappling with finding effective ways in which to elicit authentic pupil voice? ‘Children as Researchers in Primary Schools is an innovative and unique resource for practitioners supporting children to become ‘real world’ researchers in the primary classroom…. Children in primary schools are accustomed to being set short-term goals and are often unaware of long-term aims or of the connections between the concepts and skills they are learning. In contrast, this book demonstrates that children engaging in the research process have authentic opportunities to apply invaluable personal, learning and thinking skills while managing their own projects, making their ‘voices’ heard and experiencing increased levels of engagement and self-esteem.”
The origin of this paper comes from the ongoing efforts both to empower young people to become researchers by developing their faculty of critical thinking, and by using the opportunity to explore a topic from the point of view of a young person. That topic is what might a person think about when shopping for food. What makes the approach ever relevant is that we rarely explore topics of human thinking and behaving from the point of view of a young person. Even in those situations where we are interested in the response of young people, the process is bounded by the fact that the thinking going into the project is adult-driven. Adults choose the test stimuli. The young person provides data about topics relevant to being a young person, but with the test design by adults. Thus, to address the topic sentence of this paragraph, we are exploring the subject of food shopping, with test materials designed by a student in middle school (CLM, age 14), aided by a student in grade school (CIM, age 8) , and with respondents ages 13-24.
Mind Genomics
The research process is Mind Genomics (Moskowitz, 2012; Moskowitz & Hartmann, 2008). Mind Genomics is an emerging science, dealing with the perception of and decision about topics of the everyday. Mind Genomics emerged in the 1980s, its origin in the business world, where it was becoming increasingly important to create a science of decision-making. This science had to deal with the ordinary, the topics of which were and remain relevant to science. It was the sheer ordinariness, which was relevant, a relevance becoming increasingly important in the business world. The science of the day was and remains the study of decision-making, with, however, the surrounding features of the topic changed so that deep principles can emerge from the experiment. The reality of the situation had to be modified to reveal the underlying process of the way people think, and the way people make decisions. The foregoing paragraph can be summarized simply. That summary phrase is that every day is simply too complex, too unruly, to be of interest to experimental science.
With the inability of experimental science to deal with the complexities of the simple everyday, a different approach was necessary. Fortunately, the approach could be crafted by combining three different disciplines:
- Experimental psychology, with its emphasis on experimentation. The discipline of psychophysics is especially important. Psychophysics deals with developing relations between stimuli and responses. The foundation of psychophysics is the relation between physical stimuli and subjective responses (outer psychophysics in the words of S.S. Stevens, late professor of psychophysics at Harvard). Stevens occasionally stated wish (personal communication, 1967) was to rate the inner psychophysics, measuring ideas. And so Mind Genomics took that notion of inner psychophysics as one of its foundation stones.
- Statistics and its emphasis on experimental design. Experimental designs tell us how to order combinations of variables, i.e. creating mixtures. The experiment measures responses to these mixtures, and deconstructs the response to the components of the mixture. Experimental design is necessary because it is only mixtures that make sense to the person. The analogy is a food comprising several ingredients and processing variables. We can’t test a food with one ingredient alone. We have to make the combination, but in the combination, we don’t know what is happening. We can systematically vary the ingredients, test the combination, get ratings of tastiness, and identify how the different ingredients ‘drive’ tastiness.’ Mind Genomics does the same, but with combinations of ideas.
- Consumer research and its emphasis on measuring real things and events. Consumer researchers work in the world of business. They focus on how consumers make decisions about the everyday. Often the consumer researcher uses methods such as surveys to ask people what they do, or what to them is important versus what is unimportant. Of importance here is their focus on the ‘real and meaningful’, as well as their efforts to ‘measure’ the way people think. Consumer research does not, however, typically do experiments, except for the pioneering research efforts of the late Professor Paul Green and his associates at Wharton (Green & Srinivasan 1990). Green’s work used trade-off analysis (conjoint analysis) to identify the relative importance of different factors people used to make their everyday decisions for specific topics. Green’s work specifically, and the world of consumer research in general, are the immediate sources of much of the way Mind Genomics studies are conducted and analyzed.
Study Specifics
Mind Genomics studies are created using a templated system (www.BimiLeap.com). The system is set up to acquire the necessary information from the researcher, as well as to aid the researcher who needs guidance to provide the necessary inputs (questions, and answers).
Step 1 – Record the ‘Topic’
This portion is simply to give the study a name and to accept the terms of privacy.
Step 2 – Generate Four Questions
The questions will never be shown to the respondents who participate in a Mind Genomics study. The sole reason for the questions is to structure the vignettes so that the vignettes tell a story and to elicit from the researcher different answers to the questions. Figure 1 shows the request by the researcher for the embedded artificial intelligence, supplied by OpenAI (2023) to provide suggested questions. For researchers, the Idea Coach itself ends up being a teacher because the Idea Coach returns with up to 30 questions for each request. The researcher need only write a sentence or two in the specially designated ‘box’, with Idea Coach returning 30 new elements. Figure 1 shows some of the Idea Coach output for an iteration in Step 2. Figure 2 shows the four questions selected by the researcher from the Idea Coach offerings, and after slight editing by the researcher.
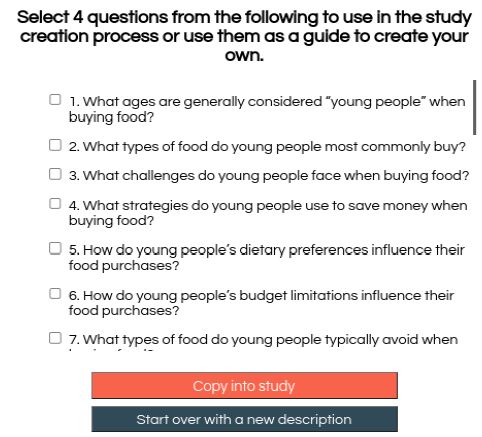
Figure 1: Partial output from Idea Coach in response to the request ‘Tell me about young people and buying food’.
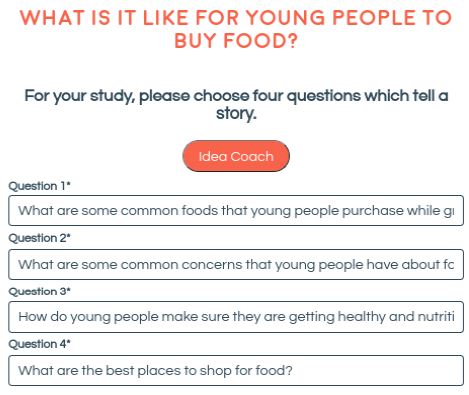
Figure 2: The final four questions selected by the researcher
Step 3 – Develop Four Answers for Each Question
Most researchers using BimiLeap find that by the time they have developed the questions, they experience little difficulty answering each question. Nonetheless, Idea Coach provides about 15 candidate answers for each question. When the Idea Coach is instructed to provide new sets of 15 candidate answers for a question, it will return with a number of new answers. Idea Coach thus becomes a teaching aid for the researcher. Figure 3 shows a set of four answers to question #3. The answers emerged from Idea Coach, but the researcher changed the format of the answer by putting the aspect of the question (healthful and nutritious food), followed by a colon, and then the actual answer. The ability to combine the sourcing of the element by Idea Coach with the ability to edit the element to be appropriate for the question becomes an opportunity to reinforce critical thinking.
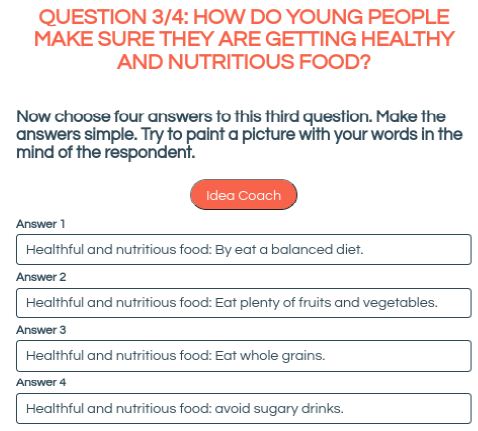
Figure 3: The four answers provided by Idea Coach, after being edited by the researcher
Step 4: Finalize the Questions and the Answers (Elements)
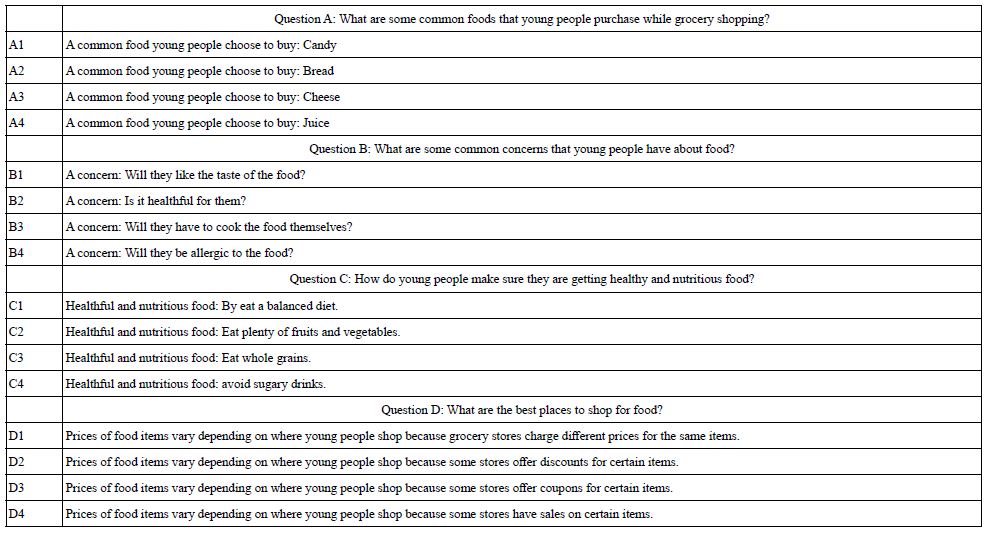
Table 1 shows the four questions and the four answers for each question. The researcher has edited the questions and answers (now called elements). Note that the answers have been edited for clarity. The original answers emerging from the Idea Coach had relevant information, but the structure of the phrases would not work in a Mind Genomics study, where the elements would be combined ‘as is’, with no polishing at all applied to make the combination easy to read. In light of the recognition that the elements have to ‘stand by themselves’, the researcher polishes the element, so that the first part of the element gives the idea, followed by a colon, and then the specific aspect. This editing did not do any violence to the element but ensured that the element would be meaningful when it would be presented.
Table 1: The questions and elements
Step 5: Create the Introduction to the Respondent and the Rating Scale
In the actual Internet session with real people, the respondent will evaluate combinations of answers (viz., so-called vignettes). Step 4 instructs the respondents to read (the vignette), and assign a rating on an anchored 5-point scale. The rating question is kept deliberately vague, to let the elements themselves drive the response. In that way, the researcher can determine which elements do the ‘convincing.’
Step 6: Create the Self-profiling Classification Question(s)
The rationale here is that it is often of interest to do the analysis at a granular level. Consumer researchers especially focus on responses to questions, and how different types of people respond to the same question. Through the analysis of the same questions by different groups, consumer researchers often discover new patterns which do not emerge when all the data from all the respondents are combined. The self-profiling questionnaire requires the respondent to define age and gender (fixed for all studies), as well as answer the question below:
Preliminary question: Are young people responsible enough to buy food for older people?
Answers: 1=Yes, they are 2=No, they aren’t.
Step 7: Use the Built-in Experimental Design to Create the Vignette, and Test Them with Respondents
The objective of Mind Genomics is to determine the degree to which the individual elements drive the ratings. At the same time, the respondent evaluates more ‘natural’ combinations of elements, with these combinations constructed according to an underlying set of specifications, known as a permuted experimental design. The design specifies exactly 24 combinations, vignettes, for each respondent, some vignettes comprising two elements, some comprising three elements, and some comprising four elements. The vignettes follow a mathematical structure set up so that the data for each respondent who participates can be analyzed by regression to reveal the contribution of the individual elements.
- With 24 vignettes, each element appears five times in the 24 vignettes and is absent 19 times.
- A vignette can have at most one element or answer from a question
- The 16 elements, viz., the answers to the four questions are set up in the combinations, but with the 16 elements combined in different ways, and statistically independent of each other
- Each respondent ends up evaluating the 24 elements following the same mathematical structure, but with the combinations different for each respondent. The permutation scheme creates thousands of different vignettes, each set of 24 both ‘the same structurally, but different in terms of actual combinations’ (Gofman & Moskowitz, 2010).
- The foregoing preparation allows the results to be analyzed at the level of the group, or a level of the individual respondent.
Step 8: Work through an Online Aggregator of Respondents to Get 100 Respondents
The typical price for easy-to-find respondents may go from a low of US$2 when one provides one’s own respondents, e.g., students, to US$4 when one uses the services of Luc.Id, the aforementioned panel aggregator, to provide respondents It is not advisable to run important studies using one’s own students, simply because executing the study with one’s friends and neighbors can require a week or two when the students provide their own panelists. A more unique approach uses the online panel provider, which may be slightly more expensive but it moves the research as.
Initial Results – Frequency of Ratings
Mind Genomics produces a great deal of data, albeit with each of the test stimuli being unique, perhaps appearing one to three times across the 2400 vignettes generated by the 100 respondents. Our first analysis considers the frequency of assignment of each of the five ratings to the full set of vignettes. We begin by assuming that we know nothing about the meaning of each vignette. We look at the surface patterns emerging, specifically the relative frequency (percent) used by each of the groups that we can identify. These groups will be based on WHO the respondent is, how does the respondent THINK (mind-sets, to be discussed later), and two aspects of the test stimuli, namely the order of testing broken out into four equal positions, and then the speed of response for the assignment of ratings.
When we do this type of analysis, not knowing anything profoundly about the stimulus, we simulate what is often the case indeed what ends up being typical. Table 2 and 3 suggests that without knowing anything more than the information about the respondent, or some superficial information about the test stimulus (viz., position in the set of 24; the speed of response when rating the vignette) we will discover very little from simply deeply analyzing the superficialities of the stimulus [1-9].
Table 2: The rating question and the anchored 5-point rating scale
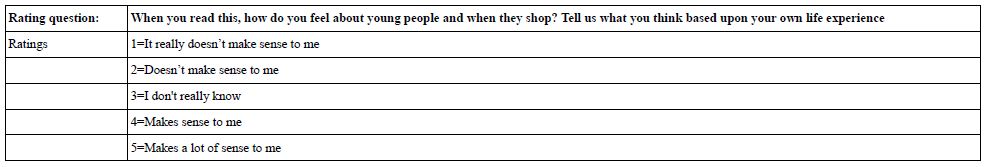
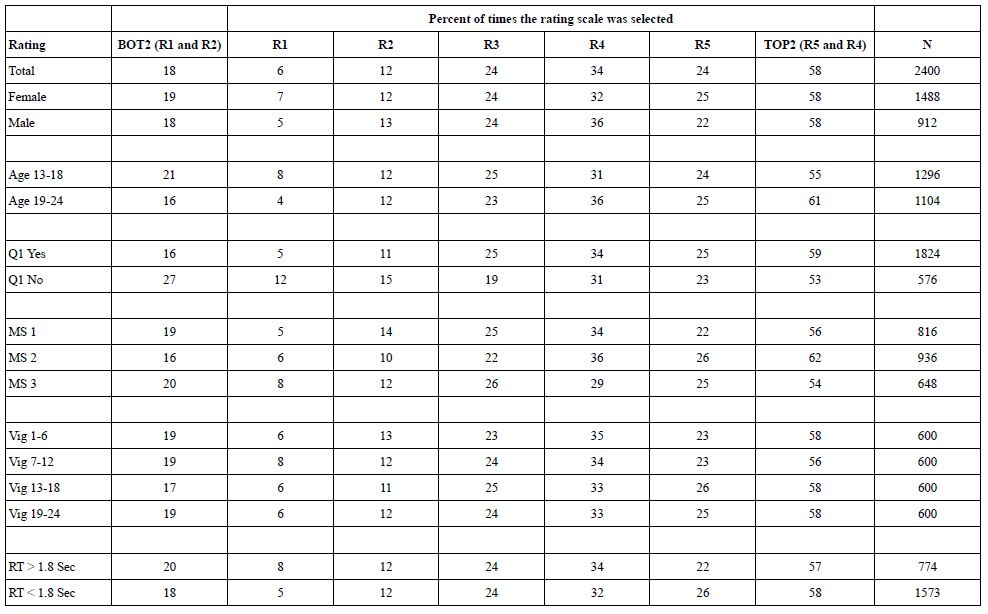
Table 3: Percent of time respondents select each rating scale point, as well as percent of time respondents choose to say ‘makes no sense’ (BOT2) or ‘makes sense’ (TOP2).
Creating a Database, and then Estimating Equations that Show How Elements ‘Drive’ Ratings
The underlying experimental design provides us with a number of benefits, the most important of which is that the researcher can easily determine the contribution of each element to the ratings. The respondents each evaluated unique sets of 24 vignettes, assigning a rating to the vignette. The data for each vignette was added to a simple database. The creation and properties of that database would be the key to deep understanding.
The database emerges from the following straightforward steps. One need only think of an Excel® worksheet to get an idea of what the database looks like. Here are the different sections of the database. Keep in mind that each respondent will generate 24 rows, one row for each vignette with a separate column assigned for each piece of information.
Section A: Row number. This section comprises a single number from 1 to 2400, to identify the record, and to allow the researcher to sort the file so it returns to the original order.
Section B: Information about the person, including a unique identifier for the respondent and separate columns for gender, age, and responses to the single-added classification question. Each person is different. The same information will be repeated a total of 24 times, once for each of the 24 vignettes that the respondent rated.
Section C: Order of the vignette for the respondent. Each respondent evaluates 24 unique vignettes. This column simply shows the order tested, from the start of the first vignette evaluated by the respondent (Order=1) to the last vignette evaluated by the respondent (Order=24). In the analysis, the order of testing will be augmented by a new variable, ‘Quarters’, with Quarters taking on the value ‘1’ for those vignettes tested in orders 1-6, the value ‘2’ for those vignettes tested in order 7-12, etc. This reduction will enable us to compare the response to the elements when the element was tested in different places, e.g., at the first part of the interview versus at the last part of the interview. Thus, the so-called ‘order effect’ can emerge and be measured.
Section D: 16 columns, one column reserved for each of the 16 elements. For any row (a vignette), the cell corresponding to a specific column is coded ‘0’ when the element is absent from the vignette and coded ‘1’ when the element is present in the vignette. The row will have 2-4 cells with the value ‘1’, and the remaining cells with the value ‘0’. This method is called ‘dummy variable coding’, denoting simply whether a variable is present or absent in a vignette. It will be this coding that allows the statistical analysis of the data.
Section E: The information recorded by the Mind Genomics program, www.BimiLeap.com, during the evaluation of the vignette. The program records both the rating and the response time (RT). RT is defined as the number of seconds to the nearest hundredth of a second elapsing between the presentation of the vignette on the screen and the rating.
Section F: Transformed ratings. Although it is easy to measure responses on a simple scale, such as the 5-point scale used here to assess ‘makes sense’, the reality is that the user of the data often has a difficult time working with the averages or distributions which emerge. The oft-heard question by the manager usually comes out as ‘please explain what this average value of 4.1 actually means, and what actions should I take when I see this average, versus when I see a smaller average such as 2.9?’. Managers who use the data find it easier to deal with yes/no information. To make the data more useful, the Mind Genomics program follows traditional paths previously done in consumer research, viz., recodes or transforms the data. There are two transformations:
TOP2 (Makes sense), ratings 5 and 4 transformed to 100, ratings 1,2,3 transformed to 0
BOT2 (Makes no sense), ratings 1, 2 transformed to 100, ratings 3,4,5 transformed to 0
To prepare the data for statistical analysis it is necessary that the newly created variables (TOP2, BOT2) exhibit some small variability, and not be the same for any individual respondent. To ensure this minimal variable, the BimiLeap program automatically adds a vanishingly small random number (< 10-5) to all newly created values of TOP2 and BOT2, respectively. The number will not measurably affect the results but will protect against ‘crashing’ the statistical analysis program (Regression Modeling).
Once the database is complete, the data are ready for analysis. The ‘workhorse’ procedure is known as dummy variable regression analysis, using OLS (ordinary least-squares) estimation. The analysis estimates the 17 parameters of the equation below:
Transformed Rating=k0 + k1(A1) + k2(A2) … k16(D4)
The early-stage effort to create vignettes according to an experimental design now creates benefits in the analysis. The foregoing equation can be created at the level of each respondent, using either TOP2 or BOT2 as the dependent variable. In turn, the equation can be estimated for any subgroup of respondents, or even any subset of ratings (e.g., for vignettes evaluated rapidly versus vignettes evaluated slowly; vignettes appearing in each of the four ‘quarters, viz., vignettes evaluated in positions 1-6 versus positions 7-12, and so forth).
Parameters of equations for the total panel and for self-defined subgroups appear in Table 4. The table shows the additive constant (k0) and the coefficients for the 16 elements. The table shows only coefficients having a value of +2 or higher. Zero and negative coefficients do not necessarily mean that the elements ‘make no sense’, but rather mean that the element ‘does not clearly make sense.’ Eliminating the negative coefficients allows the patterns to emerge. Finally, strong performing elements, with coefficients of +8 or higher,’ are shown in shaded cells.
Table 4: Parameters of the equation for TOP2 for Total Panel and key self-defined subgroups
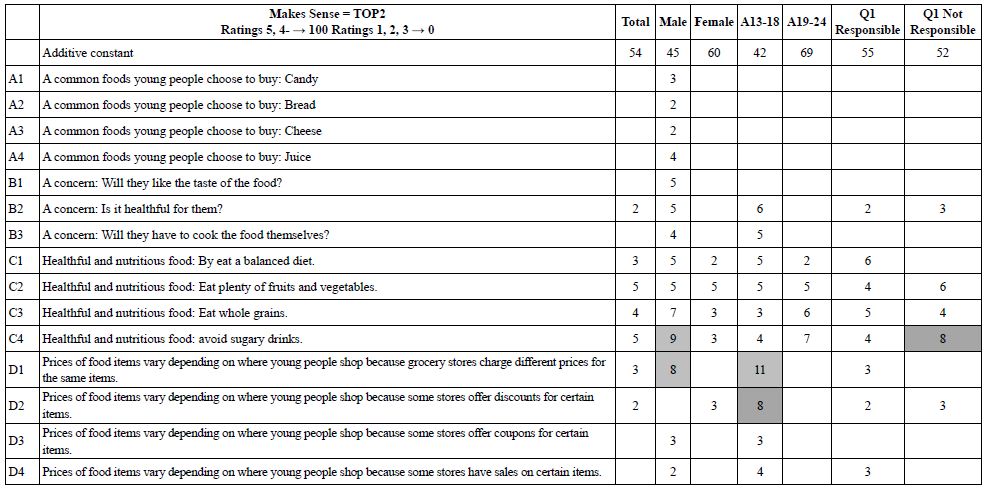
Our first pass through the data focuses on the additive constant. The additive constant shows the likelihood to say that the vignette ‘makes sense’ in the absence of elements. Of course, the underlying experimental ensured that every vignette comprised 2-4 elements so that the additive constant is a computed parameter, one that we can use as a baseline. The data shows interesting patterns. The total panel shows an additive constant of 54, meaning that in the absence of elements we might expect 54% of the ratings to be 5 or 4, viz. TOP2. When we look at the genders, however, we see that males are less likely to say ‘makes sense’ (additive constant 45), whereas females are more likely to say ‘makes sense’ (additive constant 60). We see the same pattern emerging by age. The younger respondents show a much lower additive constant than the older respondent (additive constant 42 for ages 13-18 vs. 69 for ages 19-24). Finally, when the respondents are asked whether young people are sufficiently responsible to buy food for older people (Question #1), the additive constants are very close (55 versus 52).
It is in the elements that we see differences among the group. The first thing to keep in mind is that the elements are departures from the baseline. Thus, with a low baseline, there may be few positive elements or any positive elements. The reason is that with a low baseline, there may be a few strong-performing vignettes, but most perform poorly. With a high baseline, there are generally few strong-performing elements, moving beyond the already-high level. There may be many negative elements, but these will not appear because we are only looking at positive coefficients.
With the foregoing guidance, we see that males and respondents ages 13-18 show the largest number of positive coefficients, a pattern that is to be expected given their low additive constants.
There are a group of strong-performing elements
C1 Healthful and nutritious food: By eat a balanced diet.
C2 Healthful and nutritious food: Eat plenty of fruits and vegetables.
C3 Healthful and nutritious food: Eat whole grains.
C4 Healthful and nutritious food: avoid sugary drinks.
D1 Prices of food items vary depending on where young people shop because grocery stores charge different prices for the same items.
D2 Prices of food items vary depending on where young people shop because some stores offer discounts for certain items.
Our second pass through the results looks at the pattern of coefficients for elements appearing in vignettes at the start of the session (vignettes 1-6) versus elements appearing at the end of the session (vignettes 19-24), as well as elements appearing in vignettes evaluated quickly versus vignettes evaluated slowed (operationally different as response times >1.8 vs. response times >1.8 seconds). Table 5 shows the parameters. There are differences by groups. The only strong, consistent pattern to emerge is that the elements presenting ‘health and nutritious food’ makes much for sense at the end of the evaluation than at the beginning of the evaluation. It may be that these messages must be repeated, at which point they begin to make more sense.
C1 Healthful and nutritious food: By eat a balanced diet.
C2 Healthful and nutritious food: Eat plenty of fruits and vegetables.
C3 Healthful and nutritious food: Eat whole grains.
C4 Healthful and nutritious food: Avoid sugary drinks.
Table 5: Parameters of the equation for TOP2 for the first six versus the last six of the vignettes tested, as well as the vignettes rated quickly versus the vignettes rated slowly.
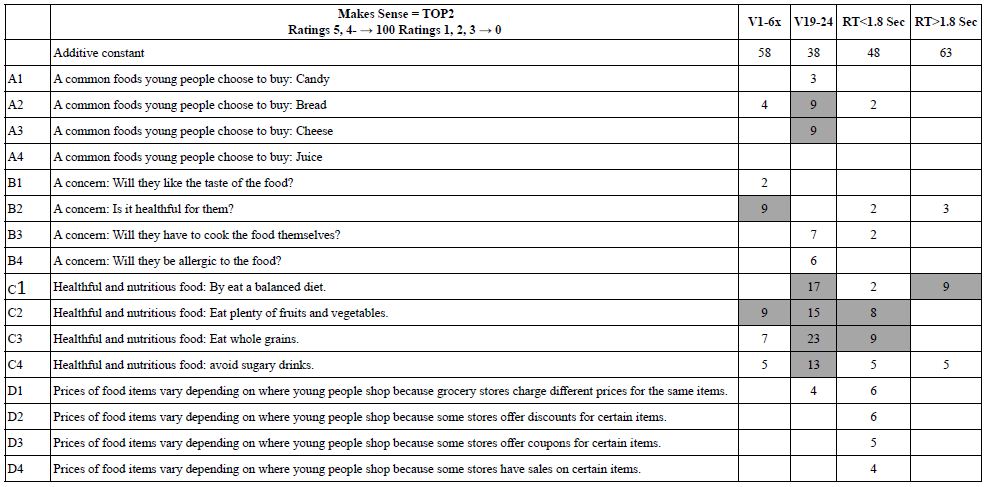
The second set of columns shows the results for the vignettes rated quickly (RT<1.8 seconds) and the vignettes rated more slowly (RT>1.8 seconds). The additive constant for the more quickly rated vignettes is lower (48 for RT<1.8 vs. 63 for RT>1.8). This difference suggests that people may reject more quickly, versus accept more slowly. The rationale for this conjecture is that the lower additive constant for the vignettes rated quickly.
Of importance is that the strong performing elements are three of the four examples of nutritious foods.
C1 Healthful and nutritious food: By eat a balanced diet.
C2 Healthful and nutritious food: Eat plenty of fruits and vegetables.
C3 Healthful and nutritious food: Eat whole grains.
Our final pass through the TOP2 data for ‘makes sense’ involves the discovery of underlying groups of people who think differently about the same topic. These groups are called mind-sets. These mind-sets emerge when the researcher looks at the pattern of coefficients for a single topic, like the topic we investigate here, viz., making sense about buying food. The mind-sets emerge clearly when we use statistical methods to find these groups. The method is called ‘clustering.’ For the study, we use so-called k-means clustering to separate out the 100 respondents first into two groups, and then into three groups, based solely on the similarity of patterns of the 16 coefficients.
The clustering program looks for different groups by creating a measure of ‘distance’ between each pair of respondents. With 100 respondents we have 100×99/2 or 4950 pairs. The distance between two test respondents in this study is defined as the quantity (1-Pearson Correlation). The distance is 0 when the two respondents show exactly parallel patterns of coefficients. The distance e is 2 when the two respondents show exactly inverse patterns. The clustering program does not care about whether or not the clusters make sense. That is the researcher’s job. The clustering program is simply a mathematical tool (Likas, 2003).
The researcher’s job is to select the most meaningful cluster solution from the solutions generated by the clustering program. The two criteria are parsimony (few clusters are better than many clusters), and interpretability (the clusters must make sense, viz., tell a coherent story)
Table 6 suggests two strong clusters (Mind-Set 2 and Mind-set 3), and one weak cluster (Mind-Set 1). Mind-Set 2 focuses on the actual shopping behavior. Mind-Set 3 focuses on health. Mind-Set 1 might be folded into Mind-Set 3, but the responses of Mind-Set 1 are weak, suggesting an almost indifferent attitude.
Table 6: Parameters of the equation for TOP2 for the three mind-sets extracted by k-means clustering
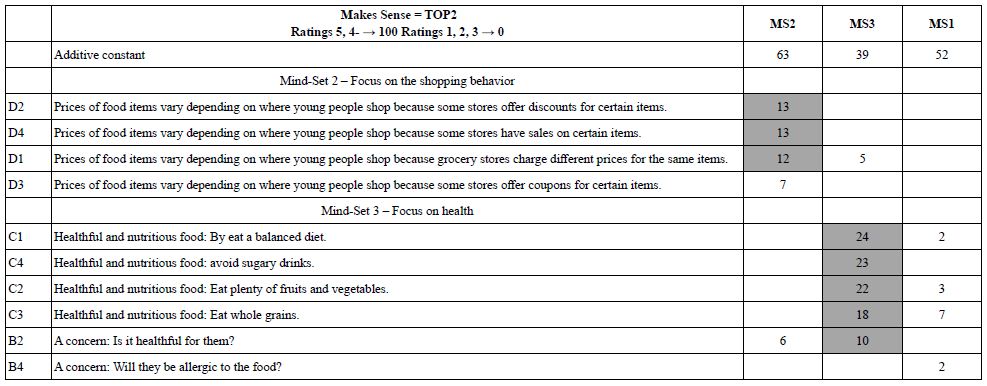
The additive constants for the mind-sets are quite different. Mind-Set 2 focusing on the shopping behavior shows the highest additive constant, 63, meaning that almost 2/3 of the time they are likely to say that the vignette makes sense. They do not seem to be particularly critical in the way they think. In contrast, Mind-Set 3 focusing on the healthfulness of the food shopped for shows the lowest additive constant, 39, meaning that only 40% of the time are these respondents likely to say that something makes sense.
Discussion and Conclusions
The study reported here demonstrates the ease with which students can investigate topics of everyday in a way that combines the joy of research and learning with the unbounded curiosity and enthusiasm of young people. One might consider the actual topic itself to be simple, not grounded in theory, and certainly not conducted with the gravitas of a ‘serious scientific experiment’, which often responds to so-called ‘question emerging from the literature’, or even more colloquially, research which fills a hole in the literature.
The topic of food choice is a serious topic, one relevant to well-being and to illness alike. Malnutrition is a worldwide problem, whether the poor nutrition comes from a lack of food, a lack of knowledge, or just bad eating habits. Many of the studies appearing in a rigorously scientific way address the topic, but in what ends up being an episodic, punctate fashion, each paper exquisitely analyzed in its own way, with a depth of information designed to demonstrate its inherent ‘scientificity’ (sic). The deeper information, the emergence of patterns leading to application, ends up being the job of the individuals doing ‘meta-research’, writing review papers, summarizing what is known, and then prescribing where appropriate.
These studies with Mind Genomics, augmented by artificial intelligence (REF) designed and executed by young researchers move science in a different, parallel direction, perhaps one reminiscent of the early days of science. It is the excitement of the unknown, the exploration of topics, the discovery of aspects of how people think, and the curiosity of youth that drive this new approach to science. And, there is the other side, the discipline in development, execution, and analysis of the data afforded by the Mind Genomics process, the remarkable simplicity, speed, and low cost of the approach, which when combined allow anyone in the world, or at least anyone with sufficient curiosity, to create a large-scale database of different aspects of a topic, such as food shopping. One can only imagine 100-200 studies of this type, with different sub-topics of food shopping, with different age people, in different regions of the world, at different times of the year. Such a dataset is simple to erect, and fun to do so, especially when the researchers are students from different schools, countries, and cultures, all cooperating on a platform design to make these types of Mind Genomics studies easy to do.
Acknowledgments
We gratefully acknowledge the sponsorship of our colleagues who support these studies to help students develop critical thinking, and thank our fellow students for the chance to discuss the topics with them.
References
- Bucknall S (2012) Children as Researchers in Primary Schools: Choice, Voice and Participation (1st ed.). Routledge. https://doi.org/10.4324/9780203116302
- Gofman A, Moskowitz H (2010) Isomorphic permuted experimental designs and their application in conjoint analysis. Journal of sensory studies 25: 127-145.
- Gram M (2010) Self‐reporting vs. observation: some cautionary examples from parent/child food shopping behaviour. International Journal of Consumer Studies 34: 394-399.
- Green PE, Srinivasan V (1990) Conjoint analysis in marketing: new developments with implications for research and practice. Journal of Marketing 54: 3-19.
- Kraak V, Pelletier DL (1998) The influence of commercialism on the food purchasing behavior of children and teenage youth. Family Economics and Nutrition Review 11: 15-24.
- Likas A, Vlassis N, Verbeek JJ (2003) The global k-means clustering algorithm. Pattern Recognition 36: 451-461.
- Moskowitz HR (2012) ‘Mind genomics’: The experimental, inductive science of the ordinary, and its application to aspects of food and feeding. Physiology & behavior 107: 606-613. [crossref]
- Moskowitz H, Hartmann J (2008) Consumer research: creating a solid base for innovative strategies. Trends in Food Science & Technology 19: 581-589.
- Open AI (2023) https://beta.openai.com/docs/models/gpt-3, accessed January 18, 2023.