Abstract
The study reported here investigates the response to ideas about bullying, these ideas emerging from the interaction of a young, eight-year old researcher with an artificial intelligence system (Idea Coach). The program permits the researcher to suggest the topic (bullying), uses the AI Idea Coach to create sets of 30 questions about bullying, requires to the research to select four questions, lets the AI suggest 15 answers to each question, requiring the researcher to select four of the answers for each question. The program then combined the answers (elements) into small combinations, comprising 2-4 elements, each respondent of the group (110 individuals, ages 15-26) evaluating a totally unique set of 24 combinations (vignettes). Deconstruction of the vignettes based upon the response ‘makes sense’ reveal three different mind-sets, focusing on WHO is a likely bully, How to STOP a likely bully and less clearly but still emerging, the reason WHY person is a bully, respectively. The approach shows the feasibility of AI as an enhancer of critical and creative thinking, empowering students as young as eight years able to begin doing high-level, original scientific research, in a systematized, programmed fashion.
Introduction
This paper is part of a series of research studies conducted by young students, enrolled in elementary and in middle school, with the dual goal of teaching students how to think critically while at the same time working with them as researchers to explore issues of social relevance. A glance at the literature reveals that virtually all research is executed by professionals, occasionally junior professionals such as graduate students, but far more often by young and middle-aged professionals, following the structure of academic research. Even when the topic involves the experience of young people, such experience is analyzed through the ‘trained’, perhaps biased eye of the professional, who brings along a career of studies. The study of the experience follows the time-hallowed practices of the scientific method, although the ‘immediacy’ of the experience cannot be tapped because the researcher is not a young person.
Almost 80 years ago, the radio and television personality Art Linkletter starred in a show called House Party, starting in 1945 and ending in 1969. As described by Wikipedia. The host would begin a conversation by posing a question about life topics to a child, who usually responds with their own innocent, often comedic perspectives on the various topics…. In the show’s first inception, it would sometimes flash back to the 1950s and 1960s show Art Linkletter’s House Party, with Cosby joined onstage by Art Linkletter, that show’s host, to introduce the vintage clips. It would show kids (of the time), their same comedic reactions to whatever Linkletter would ask or say to them…
The foregoing quote suggests that we may learn a great deal about the way children think about the world, although it is clear that a great deal of this learning is second-hand, with the researcher observing the behavior, and commenting on it. In recent years authors Deitel, Moskowitz and Rappaport have collaborated to create a system whereby anyone can be a researcher, at least for the type of research known as Mind Genomics. The idea behind Mind Genomics is that by showing people combinations of ideas and measuring their response, one can learn what specific aspects of these ideas drive the behavior, viz., the aspects to which people pay attention. Rather than asking people to say what is important to them about a topic (viz., open ended question), or ask people to rate importance of different ideas, one idea at a time, Mind Genomics assumes that people will find it more ‘natural’ to respond to combinations of ideas. The rationale for this assumption is that in the world of everyday experience people evaluate combinations of features, rather than one single feature at a time.
Bullying
The topic of bullying is becoming increasingly important [1-3]. It may be that the availability of video technology on smartphones to record one’s bullying efforts has become a stimuli to become a hero. Bullying on the internet has been shown to be responsible for teen and child suicides [4,5]. Those are just the most serious cases.
The emerging science of Mind Genomics may help us understand what young people think is important. The study reported here is unique because it was set up by young researchers, in elementary schools (3rd grade; Ciara) and in middle school (8th grade; Cledwin). The study objective was to explore aspects of bullying from the point of view of the younger researcher, using Mind Genomics augmented with AI, in the form of Idea Coach. Idea Coach helped the researcher both learn about the issues involved in bullying, and to take an active role providing new-to-the-world knowledge about these issues.
The Mind Genomics approach has been previously discussed in a variety of papers [6,7]. Three previous studies have appeared featuring the efforts of these young researchers [8,9]. The objective of the studies is to deal with a serious topic, framed not so much by an experienced adult researcher as is usually the case but rather a research effort framed by a young mind. Often the types of questions intriguing the young researcher may well differ from the questions intriguing an older researcher. We almost never heard from the young researcher, and from young respondents. The study reported here and its companion studies allow us a peek into the mind of the younger researcher, and the response to test stimuli by respondents of the appropriate age.
Method
Mind Genomics studies follow a now-standard approach, using templated inputs and automated, rapid analyses. The almost automated approach exemplifies the vision of author Moskowitz to create a system which allows anyone to become a researcher (democratization), coupled with the goal of accelerated knowledge development (efficiency), and with the vision of creating large-scale databases of aspects of ordinary life, doing so in a simple, inexpensive, iterative, and world-wide manner (industrial-scale knowledge development). The Mind Genomics program itself is called BimiLeap, short for Big Mind Learning App. The program can be accessed by anyone with access to the Internet, at www.BimiLeap.com.
Step 1 – Identify the Specific Topic
This sounds simple, and eventually is simple. The novice researcher often thinks in generalities, not in specifics.
Step 2 – Create Four Questions Regarding the Topic of the Study
The respondent is allowed to choose any questions, as long s the questions tell a story about the topic. It is at this point that Mind Genomics proceeds to structure the way the researcher approaches the problem. The first encounter with requiring the researcher to ask a question can be frightening, and certainly off-putting. Most novice researchers freeze up at this point, perhaps shocked by the directness of the question. The most common initial reaction at this point is a sense of discomfort, and in some cases that discomfort simply ends the effort, with the researcher.
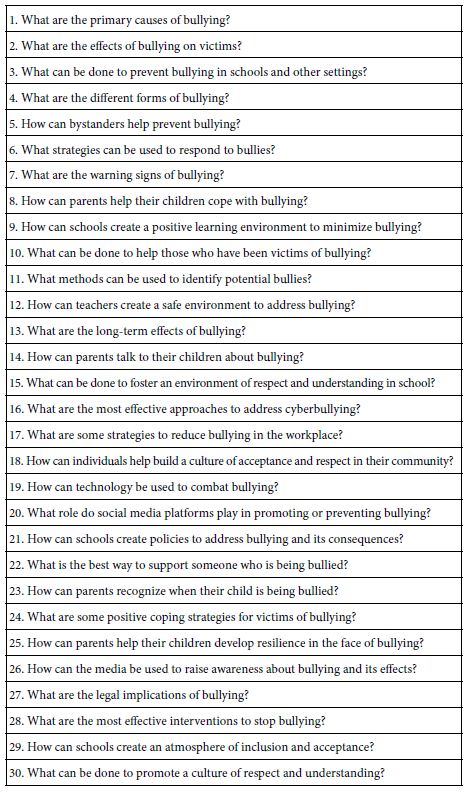
For the researchers who cannot think of questions, there is the associated AI feature, Idea Coach. The researcher simply writes a short paragraph, really 1-3 sentences, and Idea Coach returns with 10-30 questions. Idea Coach can be invoked several times, either with the same paragraph or with different paragraphs. Each time Idea Coach will return with a set of somewhat different questions. Table 1 shows a run of Idea Coach, prompted by the researcher request ‘Help me create questions about bullying.’
Table 1: Thirty questions emerging from Idea Coach, based upon the request to ‘tell me some questions to ask about bullying in school’.
Once the researcher selects the four questions, the next step requires the research to provide four answers to each question, specifically phrases which paint word pictures. Once again the researcher can either come up with answers, and/or work with the Idea Coach. For each ‘run’ of Idea Coach, comprising answers to a question, Idea Coach emerges with approximately 15 phrases which answer the question. This step in the process is much easier, simply because many people find it easier to answer questions than to pose questions. Answering questions relies on memory and experience. Posing questions relies more on critical thought because the researcher is going into a void, rather than filling the void under the direction of a question.
The process in Mind Genomics has been simplified, allowing the researcher to write the question to describe the topic, use Idea Coach to present 30 questions (and repeat as desired), select four questions, edit those questions when desired, and finally put in answers and have Idea Coach fill in the missing answers. In all cases the researcher is free to override the Idea Coach effort, whether overriding consists of editing the question/answer or even providing a new question/element based upon one’s insight.
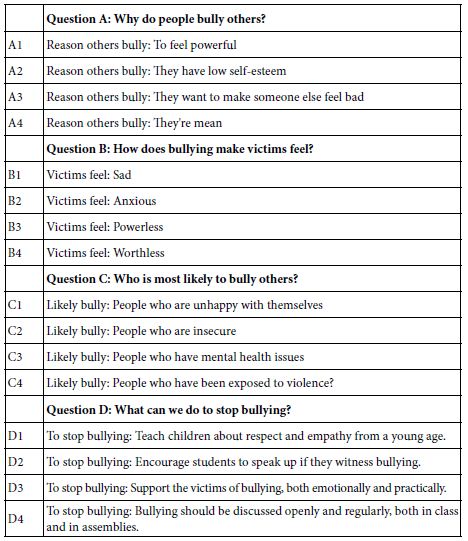
Once the researcher has used Idea Coach to create questions, such as those shown in Table 1, the researcher select questions and/or adds in questions of one’s own. These questions are automatically inserted into the template. The researcher is then prompted to provide four answers to each question. The Idea Coach can provide answers to each question, providing 15 answers for each question for each ‘run’ of the Idea Coach. The researcher need only select four answers, or fewer answers, providing other answers as desired. The answers can be edited, as they were in this study, generally edited for simplicity, and recognizing the nature of the project. In this study the answers were edited by introducing the sub-topic, followed by a colon, and then followed by the text. In this way the element would end up ‘making sense’ in the format of Mind Genomics, wherein one element was presented atop another, not connected with each other, but part of the vignette.
Table 2 presents the four questions selected from the 30 questions at the start of the study. These questions may or may not have appeared in Table 1 for the simple reason that each iteration of Idea Coach produces different sets of questions. Table 2 also presents the four answers to each question.
Table 2: The four questions and the four answers to each question
Once the questions and answers are selected, the Mind Genomics program creates combinations of elements. These combinations are called vignettes. A vignette comprises a minimum of two elements, and a maximum of four elements. The structure of the vignette is specified by a layout called an experimental design. The experimental design for Mind Genomics was created to ensure the following properties:
- Every respondent evaluates exactly 24 vignettes
- The 24 vignettes are set up so that each of the 16 elements appears exactly five times and is absent 19 times.
- A vignette has either two, or three or four elements.
- A vignette can have at most one element from a question, often has no elements from a question, and never has more than one element from a question. This property is important. It is a bookkeeping feature which ensures that a single vignette can never have two different pieces of information of the ‘same type’. The problem becomes obvious when instead of the elements selected here, the elements are prices and brands. In the latter case we want to ensure that a single vignette can have at most one price, not two prices, which would be self-contradictory.
- The underlying experimental design ensures that the 16 elements are statistically independent of each other. This statistical independence and the specific nature of the design allow the researcher to use statistical modeling (OLS, ordinary least-squares regression) to relate the presence/absence of the 16 elements to the dependent variable. Usually the dependent variable is the rating assigned, a simple transform of the assigned rating, or response time (the time elapsed between the presentation of the vignette to the respondent and the respondent’s rating, captured by the program).
- A special feature of the experimental design is that it is permuted [10,11]. The permutation means that the underlying mathematical structure is maintained, but each respondent evaluates different combinations. From the practical point of view, the permutation means that the research ends up covering a lot more of the underlying ‘design space’. Rather than having to have a good idea of the ‘right test stimuli’, viz., the right test combinations, and then test those ‘right combinations’, the permuted design tests many more combinations. The patterns in the data emerge more powerfully when the large design space is explored, rather than when one focuses on what ‘thinks’ to be a promising area.
Study Execution on the Internet
The actual study is run in a straightforward fashion, using the Mind Genomics program, www.BimiLeap.com. The program both guides the set-up of the study, as well as executes the study. Once the researcher has set up the study, the next step is to ‘order’ respondents. Traditionally, this process has been arduous, typically because over the past decades respondent participation has dropped. The simple reasons are that people are busy, but also one can scarcely do anything in the commercial world without a sweetly phrased request inquires whether the person would be willing to complete a short survey about the experience. One or two such requests are acceptable, but one can expect resistance, despite the motto of the Marketing Research Association that ‘Your Opinion Counts.’
To remedy the issue of difficulty in recruiting respondents, the BimiLeap program contains a built-in facility to both issue invitations (links to the study), or to pay for respondents, specifying these respondents by a set of screens showing qualifications. The paid request is immediately sent to the associated ‘on-line panel provider’, Luc.id, which aggregates respondents, and provides the necessary respondents in a short period of time, perhaps an hour or so for 100 qualified respondents. This speed means that the entire study can be set up in 30 minutes or less, and executed in 90 minutes or less for 100 easy-to-find respondents. The result is a study executed form start to finish within the space of two or two and a half hours.
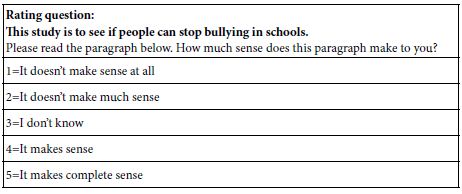
The actual study begins with a short introduction about the project, a set of classificaiton questions (age and gender fixed, and then a no/yes question of having been bullied in school). The respondent then proceeds to the actual evaluation of the 24 vignettes. The orientation is short, providing almost no substantive information. The objective is for the orientation to simply introduce the topic. The actual information is presented in the vignettes, the combinations of the elements. Table 3 below presents the orientation sentence, the rating question, and the five answers comprising a Likert scale.
Table 3: The orientation sentence, the rating question and the five point rating scale
Initial Analyses – Frequency of Selected Ratings by Groups of Respondents
Mind Genomics studies generate a great deal of data. We can approach the analyses in at least two different ways. The first way is to look for different patterns of responses, recognizing that we are dealing with different vignettes across all 110 respondents or 2680 vignettes, without the test stimuli having any cognitive meaning at all, other than being test stimuli, the responses to which are being measured.
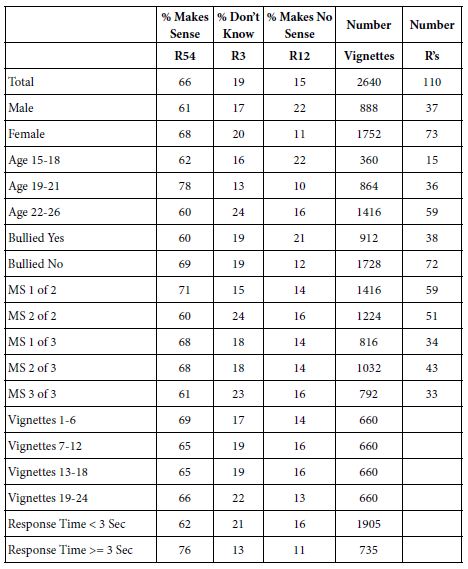
Following the foregoing analysis, we can examine the frequency of ratings by groups. The first set of groups include the Total Panel, the genders, the ages, the groups who say they were bullied before versus not bullied before. The second set of groups is the mind-sets, individuals who think similarly to each other. We look at the 110 respondents divided into two mutually exclusive mind-sets and then three mutually exclusive mind-sets. Finally we look at the position of the vignette during the sequence of 24 vignettes (first to fourth quarter), and at the vignettes rated quickly (< 3 seconds) versus at the vignettes rated slowly (>= 3 seconds).
Table 4 shows the frequencies. There are occasional differences of 8% or more, especially for the ratings of ‘makes sense’ (5 and 4). There are a few differences for ‘makes no sense’ (1 and 2), and very few for ‘don’t know’. We conclude from Table 4 that there are differences in the measure ‘makes sense’, but beyond that deliberate overlooking of the cognitive meaning hampers our knowledge. It will be with the knowledge of what the elements ‘mean’ that we will make progress.
Table 4: Frequency of ratings assigned by the different, identifiable groups of respondents or vignettes. The numbers in the first three columns of each row should add to 100%.
How Elements Drive Ratings of ‘Makes Sense’ and ‘Doesn’t Make Sense’
The previous section considering the frequency of ratings showed that simply measuring responses to test stimuli suggests some differences among groups, although one would be hard pressed to learn more about the process of decision making. Fortunately, the cognitive richness of the test stimuli, viz., the simple statement, can be used by the researcher to reveal what the respondent may ‘think’ about a topic, even when the respondent herself or himself cannot articulate the rules by which the respondent makes a simple decision. Indeed, quite often exit ‘comments’ by respondents participating in a Mind Genomics study end up with the respondent insisting that it was impossible to ‘find the right answer that was deemed appropriate’ and that much of the answering felt like ‘guessing’ rather than like a reasoned rating.
A deeper analysis of the ratings shows, time after time, that there is a clear set of rules that can be inferred by the pattern of ratings, but only when the ratings themselves can be related to the presence/absence of the specific messages in the vignettes. That is, the pattern of ratings themselves fail to provide information as Table 4 above suggests. Yet, as the remaining tables in this paper will reveal, there are clear, consistent, and interpretable patterns, especially when we bring to bear the combination of OLS (ordinary least squares) regression, coupled with cluster analysis to identify similar behaving groups in the population.
OLS regression, colloquially known as ‘curve fitting’, relates a dependent variable to one or more independent variables. For our study, the regression equation is written as:
Dependent variable = k0 +k1(A1) + k2(A2) … k16(D4)
In words, the expected value of the dependent variable (e.g., Makes Sense, Top2, Rating 54) is the sum of 17 numbers. The first number, k0, is the additive constant. It is the expected the top of the dependent variable (e.g., Top2, Makes Sense) in the absence of elements. Of course, all 24 vignettes evaluated by each respondent comprised a minimum of two elements and a maximum of four elements, so the case of a vignette without elements is hypothetical. Yet, the additive constant (also called the intercept by statisticians) is estimated, and is considered to be a correction factor. We can use it as a baseline, from which all elements either add or subtract. The additive constant is usually high when the dependent variable is ‘Top2, Makes Sense’, and usually low when the dependent variable is ‘Bot2, Does not make sense’.
The regression analysis returns with positive coefficients and with negative coefficients. For our analysis we will present only the positive coefficients of magnitude +2 or higher. The blank spaces in the tables of coefficients actually have numbers, negative or zero coefficients, but in the interest of discerning the pattern we are primarily interested in the positive coefficients. In actuality, presenting the positive and negative coefficients clouds the results.
The top portion of Table 5 presents the positive coefficients for the Top2, viz., for the Total panel, two genders, three ages, and the first six versus the last six vignettes in the set of 24 vignettes. The additive constants are all high, but the highest for the younger respondents, ages 15-18 (additive constant 83) and ages 19-21 (additive constant 78). This is noteworthy. It says something about the proclivity of younger respondents to agree with the statements about bullying, especially since respondents ages 22-26 show a much lower value (additive constant 61). It is important to recognize that this type of granular information could not have emerged from conventional research, and may not have been recognized without the use of OLS regression.
Table 5: Parameters of the models for ‘Make Sense’ (Top 2), and for ‘Does Not Make Sense’ for self-defined groups, and for first and last test orders.
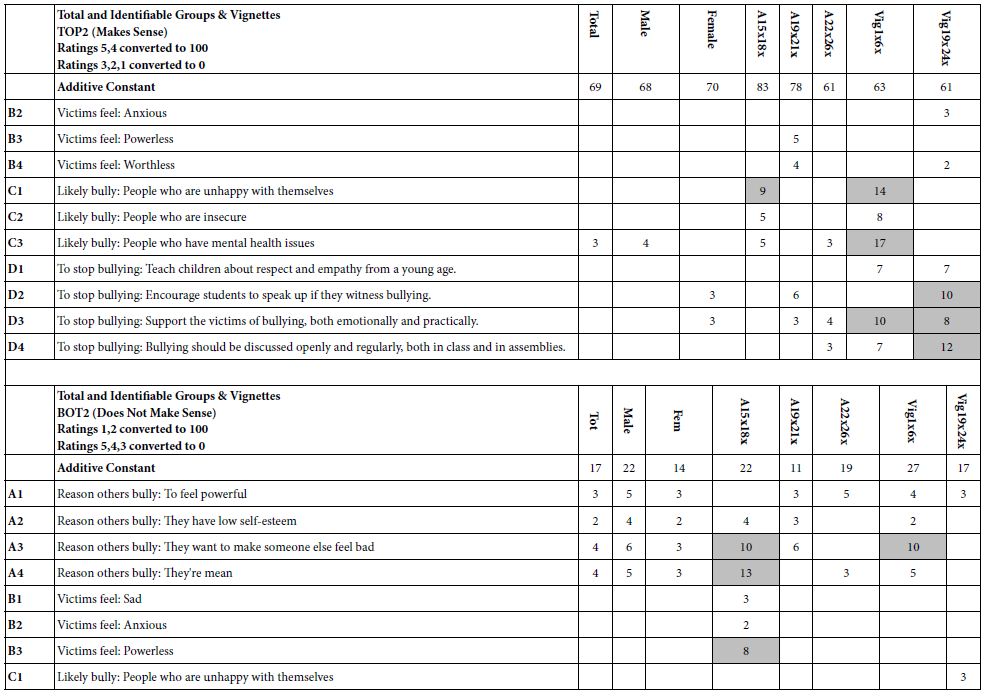
Moving now to the granular level of elements, we see many empty cells. These cells belong to elements which failed to drive a perception of agreement beyond the general proclivity to agree evidenced by the additive constant. What strikes us as noteworthy is that the majority of strong performing elements occur in the columns devoted to order of testing. There seem to be two types of elements, those which desensitize with exposure, and those which sensitize with exposure. The magnitude of the effect can be dramatic, especially when we see that the additive constants are virtually equal (63 for vignettes 1-6; 61 for vignettes 19-24).
Sensitizing elements (stronger tor vignettes 19-24, weaker for vignettes 1-6)
To stop bullying: Encourage students to speak up if they witness bullying.
To stop bullying: Bullying should be discussed openly and regularly, both in class and in assemblies.
Desensitizing elements (stronger for vignettes 1-6, weaker for vignettes 19-24)
Likely bully: People who are unhappy with themselves
Likely bully: People who are insecure
Likely bully: People who have mental health issues
When the analysis is reversed, focusing now on what does not make sense (BOT2), Table 5 suggests a different picture. As expected, the additive constants are quite low, hovering around 20. In turn, a low additive constant ends up allowing a variety of elements to emerge. Table 5 shows the greater number of low coefficients. Worthy of note are the three element responded to strongly by the youngest group of respondents, ages 15-18. Here are the elements which do not make sense to them:
Reason others bully: They want to make someone else feel bad
Reason others bully: They’re mean
Victims feel: Powerless
Table 5 gives us somewhat of a sense of the mind of the respondent. We find some messages to be strong, most messages to be weak. One hypothesis which emerges is that people may differ from each other in part of their life histories. For our study of bullying, a question which comes to mind is whether having been bullied (or at least answering YES on the up-front classification questionnaire) reveals itself in the pattern of responses to the elements.
Table 6 shows the parameters of the equations developed from the 38 respondents who said that they were bullied versus the parameters of the equation developed from the 72 respondents who said they were not bullied.
Table 6: Parameters of the models for ‘Make Sense’ (Top 2), and for ‘Does Not Make Sense’ for those who reported that were bullied versus not bullied.
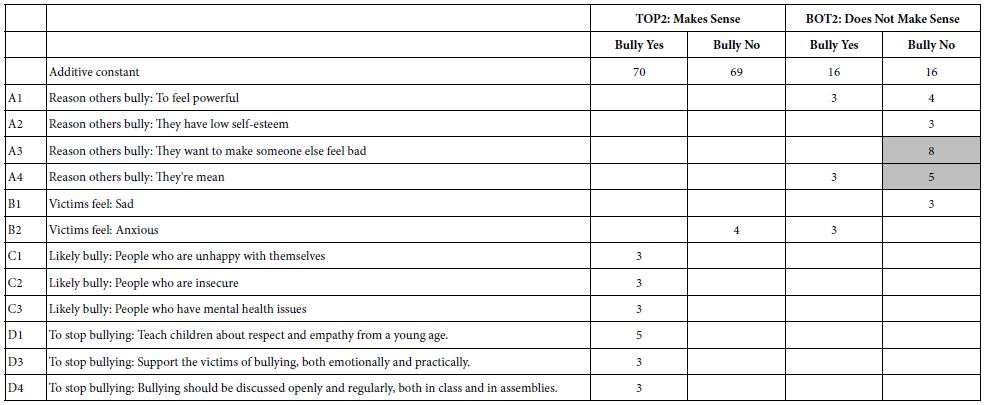
There are some differences, not in the additive constant (baseline), but in the elements. Those who said that they were bullied find more elements to ‘make sense’ than those who said that they were not bullied. In terms of not making sense, those who were not bullied find more elements not to make sense.
Mind-Sets
A foundational principle of Mind Genomics is that for the world of the everyday there are differences in the way that people make decisions. These differences emerge in the granular level of the everyday, not necessarily in a way which sets one person apart from others. Researchers might call these individual differences, often recognizing that they could end up being a vexatious source of variability, hindering the signal, but signifying nothing. In contrast, Mind Genomics processes this variability through clustering respondents on the patterns of their coefficients for their models. The clustering uses all 16 coefficients for the respondent, viz, positive coefficient, 0’s, and negative coefficients, the latter two coefficients not shown in the tables. The method k-means clustering, uses as a distance measure the value (1-Pearson correlation between the corresponding sets of 16 coefficients for two people [12]).
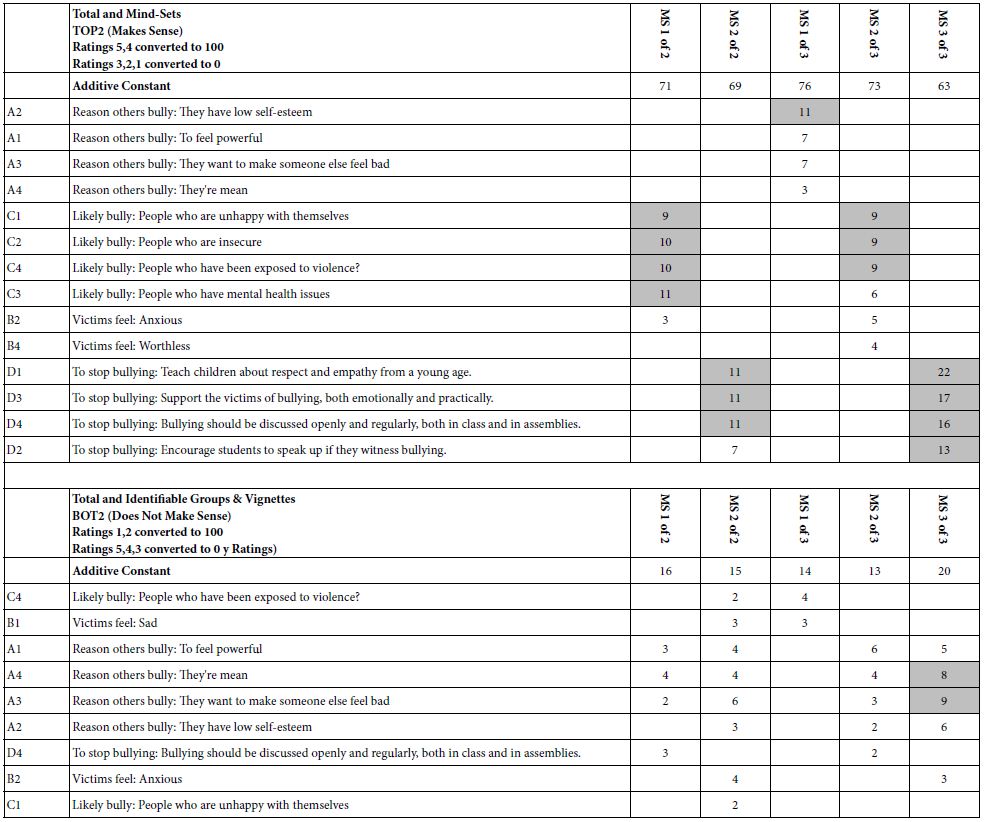
The k-means program extracted two mind-set and three mind-sets, using the coefficients relating the presence absence of the elements to the ratings of ‘make sense’ (viz., Top3) The 110 sets of coefficients were used for in the k-means, with the additive constant not included Table 6 presents the non-zero coefficients, first for TOP2 (Makes sense), and for BOT2 (makes no sense).
The two-mind set solution suggest one group one group focusing on WHO is a likely bully, and a second group focusing on HOW TO STOP a bully. The three mind-set solution distinguishes among WHO is a likely bully from How to STOP a likely bully, and less clearly but still emerging from the reason WHY person is a bully.
It is remarkable that in the face of such a complex task, respondents are able to focus on what is important to them. It is even more remarkable when we see that only with clustering the responses do these groups emerge clearly, in a way that could not possibly be biased (Table 7) [13].
Table 7: Parameters of the models for ‘Make Sense’ (Top 2), and for ‘Does Not Make Sense’ for two and three mind-sets extracted from the coefficients using k-means clustering.
Discussion and Conclusions
The extensive literature on the topic of bullying has been created by adults, for adults, using the behavior of children towards each other. The inevitable effect of the research effort and the published result is to describe and explain the behavior of children as a combination of anthropology, sociology, and psychology. The researcher sits on the outside, observing the behavior, or talking to those involved in the behavior. Afterwards, the researcher translate the personal experience of the children into ‘adult, science-speak’, replete with statistics when relevant. Of course research ethics do not permit the researcher to induce bullying as part of an experiment, requiring observation and storytelling, rather than experimentation.
It is obvious that young researchers can construct simple questionnaires, and by administering these questions to the correct people the young researcher can learn a lot about the world from the point of view of other people. One need only look at the exercise of interviewing someone older about one or another life experience, the type of research that schools use to introduce students to the research process. Within that framework, the Mind Genomics study reported here presents the way people think about bullying. The data could be reported in that fashion.
The important activities of the Mind Genomics efforts occur at the start, when the study is designed and the questions/answer are developed, and at the end, when the results are analyzed. The Mind Genomics approach, modified by adding a coaching feature, enables the younger researcher to investigate topics in great depth, doing work which by virtue of the coaching and templating becomes valuable. When looking at the execution of the study, and the results, it would be hard to believe that the author of the study is a grade school student. That is precisely the point. The student has now done professional level research. The topics might be thought about initially by the mind of a grade school student, but quickly the execution and the results bring the student to a higher degree of understanding of the topic. It is the mind of the grade school student which frames the topic and selects the question. It is the research approach, the AI coaching, and finally the easy to read results emerging from powerful but ‘hidden’ analyses, which end up helping the student to get excited at the prospect of discovery, and accelerate the process of self-education.
References
- Bradshaw CP (2015) Translating research to practice in bullying prevention. American Psychologist 70: 322-332. [crossref]
- Dake JA, Price JH, Telljohann SK, Funk JB (2003) Teacher perceptions and practices regarding school bullying prevention. Journal of School Health 73: 347-355. [crossref]
- Evans CB, Fraser MW, Cotter KL (2014) The effectiveness of school-based bullying prevention programs: A systematic review. Aggression and Violent Behavior 19: 532-544. [crossref]
- Craig W, Boniel-Nissim M, King N, Walsh SD, Boer, M, et al. (2020) Social media use and cyber-bullying: A cross-national analysis of young people in 42 countries. Journal of Adolescent Health 66: S100-S108. [crossref]
- Sedgwick R, Epstein S, Dutta R, Ougrin D (2019) Social media, internet use and suicide attempts in adolescents. Current Opinion in Psychiatry 32: 534. [crossref]
- Moskowitz HR, Gofman A, Beckley J, Ashman H (2006) Founding a new science: Mind Genomics. Journal of Sensory Studies 21: 266-307.
- Porretta S, Gere A, Radványi D, Moskowitz H (2019) Mind Genomics (Conjoint Analysis): The new concept research in the analysis of consumer behaviour and choice. Trends in Food Science & Technology 84: 29-33.
- Mendoza, CL, Mendoza CI, Rappaport S, Deitel J, Moskowitz HR (2023) Empowering Young Researchers: Understanding the mind of prospective aides regarding elderly clients.
- Mendoza CI, Mendoza CL, Rappaport S, Deitel J, Moskowitz HR (2023) Empowering Young Researchers: Exploring and understanding responses to the jobs of home aide for a young child.
- Mendoza CL, Mendoza CI, Rappaport S, Deitel J, Moskowitz HR (2023) Empowering young researchers to think critically: Exploring reactions to the ‘inspirational charge to the newly-minted physician.
- Gofman A, Moskowitz H (2010) Isomorphic permuted experimental designs and their application in conjoint analysis. Journal of Sensory Studies 25: 127-145.
- Likas A, Vlassis N, Verbeek JJ (2003) The global k-means clustering algorithm. Pattern Recognition 36: 451-461.
- Hardy MA (1993) Regression with Dummy Variables. Sage.