Introduction
This paper describes the research results by comparing the glucose data from a Continuous Glucose Monitor (CGM) sensor device collecting glucose at 5-minute (5-min) and 15-minute (15-min) intervals during a period of 125 days, from 2/19/2020 to 6/23/2020, using the GH-Method: math-physical medicine approach. The purposes of this study are to compare the measurement differences and to uncover any possible useful information due to the different time intervals of the glucose collection.
Methods
Since 1/1/2012, the author measured his glucose values using the finger-piercing method: once for FPG and three times for PPG each day. On 5/5/2018, he applied a CGM sensor device (brand name: Libre) on his upper arm and checked his glucose measurements every 15 minutes, a total of ~80 times each day. After the first bite of his meal, he measured his Postprandial Plasma Glucose (PPG) level every 15 minutes for a total of 3-hours or 180 minutes. He maintained the same measurement pattern during all of his waking hours. However, during his sleeping hours (00:00-07:00), he measured his Fasting Plasma Glucose (FPG) in one-hour intervals.
With his academic background in mathematics, physics, computer science, and engineering including his working experience in the semiconductor high-tech industry, he was intrigued with the existence of “high frequency glucose component” which is defined as those lower glucose values (i.e. lower amplitude) but occurring frequently (i.e.. higher frequency). In addition, he was interested in identifying those energies associated with higher frequency glucose components such as the various diabetes complications that would contribute to the damage of human organs and to what degree of impact. For example, there are 13 data-points for the 15-minute PPG waveforms, while there are 37 data-points for the 5-minute PPG waveforms. These 24 additional data points would provide more information about the higher frequency PPG components.
Starting from 2/19/2020, he utilized a hardware device based on Bluetooth technology and embedded with customized application software to automatically transmit all of his CGM collected glucose data from the Libre sensor directly into his customized research program known as the eclaireMD system, but in a shorter time period for each data transfer. On the same day, he made a decision to transmit his glucose data at 5-minute time intervals continuously throughout the day; therefore, he is able to collect ~240 glucose data within 24 hours.
He chose the past 4-months from 2/19/2020 to 6/19/2020, as his investigation period for analyzing the glucose situation. The comparison study included the average glucose, high glucose, low glucose, waveforms (i.e. curves), correlation coefficients (similarity of curve patterns), and ADA-defined TAR/TIR/TBR analyses. This is his secondresearch report on the 5-minute glucose data. His first paper focused on the most rudimentary comparisons [1].
References 2 through 4 explained some example research using his developed GH-Method: math-physical medicine approach [2,3].
Results
The top diagram of Figure 1 shows that, for 125 days from 2/19/2020 – 6/23/2020, he has an average of 259 glucose measurements per day using 5-minute intervals and an average of 85 measurements per day using 15-minute intervals. Due to the signal stability of using Bluetooth technology, for the 5-min, it actually has 259 data instead of the 240 data per day.
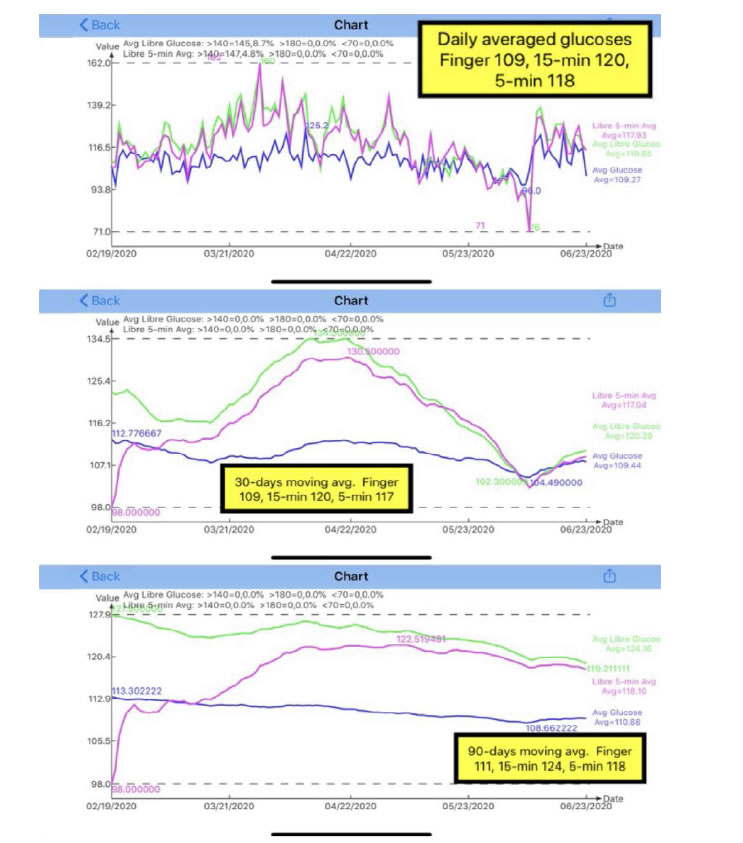
Figure 1. Daily glucose, 30-days & 90-days moving average glucose of both 15-minutes and 5-minutes.
The middle diagram of Figure 1 illustrates the 30-days moving average of the same dataset as the “daily” glucose curve. Therefore, after ignoring the curves during the first 30 days, we focus on the remaining three months and can detect the trend of glucose movement easier than “daily” glucose data chart. There are two facts that can be observed from this middle diagram. First, the gap between 5-min and 15-min is wider in the second month, while the gap becomes smaller during the third and fourth month. This means that the 5-min results are converging with the 15-min results.Secondly, both curves of 5-min and 15-min are much higher than the finger glucose (blue line). This indicates that the Libre sensor provides a higher glucose reading than the finger glucose. From the listed data below, the CGM sensor daily average glucoses are about 8% to 10% higher than the finger glucose.
5-min sensor: 118 mg/dL (108%)
15-min sensor: 120 mg/dL (110%)
Finger glucose: 109 mg/dL (100%).
The bottom diagram of Figure 1 is the 90-days moving average glucose. Unfortunately, his present dataset only covers 4 months due to late start of collecting his 5-min data; however, the data trend of the last month, from 5/19-6/23/2020, can still provide a meaningful trend indication. As time goes by, additional data will continue to be collected, his 5-min glucose’s 90-days moving trend will be seen more clearly.
Figure 2 shows the synthesized views of his daily glucose, PPG, and FPG.Here, “synthesized” is defined as the average data of 125 days.For example, the PPG curve is calculated based on his 125×3=375 meals. Listed below is a summary of his primary glucose data (mg/dL) in the format of “average glucose/extreme glucose”. Extreme means either maximum or minimum, where the maximum for both daily glucose and PPG due to his concerns of hyperglycemic situation, and the minimum for FPG due to his concerns of insulin shock. The percentage number in prentice is the correlation coefficients between the curves of 15-min and 5-min.
Daily (24 hours):15-min vs. 5-min
117/143vs. 119/144(99%)
PPG (3 hours):15-min vs. 5-min
126/135vs. 125/134(98%)
FPG (7 hours):15-min vs. 5-min
102/95 vs. 105/99 (89%).
Those primary glucose values between 15-min and 5-min are close to each other in the glucose categories. It is evident that the author’s diabetes conditions are under well control for these 4 months. However, by looking at Figure 2 and three correlation coefficients %, we can see that daily glucose and PPG have higher similarity of curve patterns (high correlation coefficients of 98% and 99%) between 15-min and 5-min, but FPG curves have a higher degree of mismatch in patterns (lower correlation coefficient of 89%). This signifies that his FPG values during sleeping hours have a bigger difference between 15-min and 5-min.
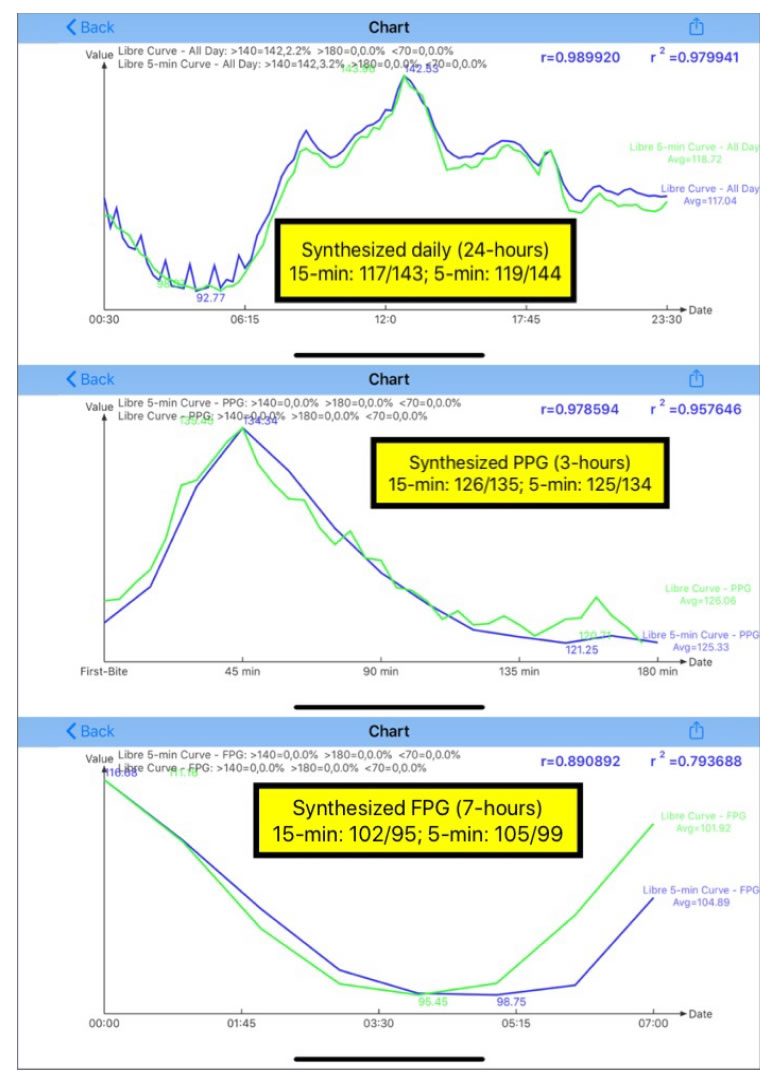
Figure 2. Synthesized daily glucose, PPG, and FPG of both 15-minutes and 5-minutes.
Figure 3 are the results using candlestick model [4,5]. The top diagram is the 15-min candlestick chart and the bottom diagram is the 5-min candlestick chart. Candlestick chart, also known as the K-Line chart, includes five primary values of glucoses during a particular time period; “day” is used in this study. These five primary glucose data are:
Start: beginning of the day.
Close: end of the day.
Minimum: lowest glucose.
Maximum: highest glucose.
Average: average for the day.
Listed below are five primary glucose values of both 15-min and 5-min.
15-min: 108/116/86/170/120.
5-min: 111/116/84/173/118.
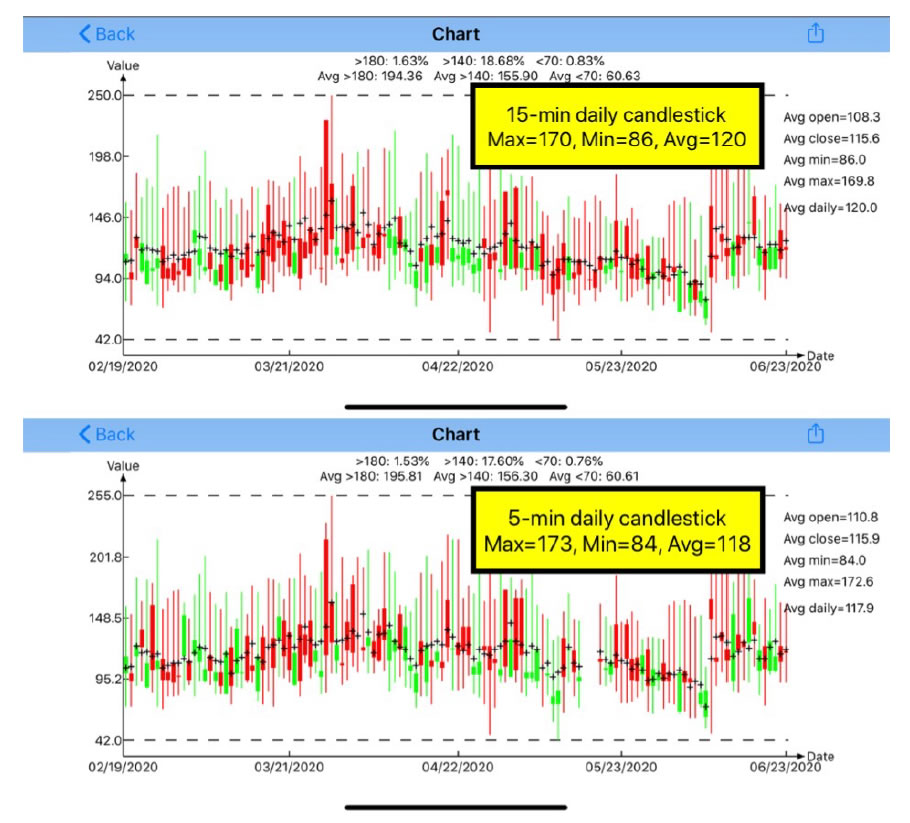
Figure 3. Candlestick charts of both 15-minutes and 5-minutes.
By ignoring the first two glucoses, start and close, let us focus on the last three glucoses: minimum, maximum, and average. The 5-min method has a lower minimum and a higher maximum than the 15-min method. This is due to the 5-min method capturing more glucose data; therefore, it is easier to catch the lowest and highest glucoses during the day. The difference of 2mg/dL between 15-min’s average 120 mg/dL and 5-min’s average 118 mg/dL is only a negligible 1.7%.
Again, it is also obvious from these candlestick charts that the author’s diabetes conditions are under well control for these 4 months.
Conclusion
In summary, the glucose differences between 5-min and 15-min based on simple arithmetic and statistical calculations are not significant enough to draw any conclusion or make any suggestion on which are the “suitable” or better measurement time intervals. However, the author will continue his research to pursue this investigation of energy associated with higher-frequency glucose components in order to determine the glucose energy’s impact or damage on human organs (i.e. diabetes complications).
The author has read many medical papers about diabetes. The majority of them are related to the medication effects on glucose symptoms control, not so much on investigating and understanding “glucose” itself. This situation is similar to taming and training a horse without a good understanding of the temperament and behaviors of the animal. Medication is like giving the horse a tranquilizer to calm it down. Without a deep understanding of glucose behaviors, how can we truly control the root cause of diabetes disease by only managing the symptoms of hyperglycemia?
References
- Hsu, Gerald C. eclaireMD Foundation, USA (2020) Analyzing CGM sensor glucoses at 5-minute intervals using GH-Method: math-physical medicine (No. 278).
- Hsu, Gerald C. eclaireMD Foundation, USA(2020) Predicting Finger PPG by using Sensor PPG waveform and data via regression analysis with three different methods using GH-Method: math-physical medicine (No. 249).
- Hsu, Gerald C. eclaireMD Foundation, USA (2019) Applying segmentation pattern analysis to investigate postprandial plasma glucose characteristics and behaviors of the carbs/sugar intake amounts in different eating places using GH Method: math-physical medicine (No. 150).
- Hsu, Gerald C. eclaireMD Foundation, USA (2019) A case study of the impact on glucose, particularly postprandial plasma glucose based on the 14-day sensor device reliability using GH-Method: math-physical medicine (No. 124).
- Hsu, Gerald C. eclaireMD Foundation, USA. Comparison study of PPG characteristics from candlestick model using GH-Method: Math-Physical Medicine (No. 261).