Abstract
In this contribution, exceptional processes during growth, dissolution, and new growth of quard are at the center of observations. An absolute novum is the finding of diamond whiskers in smoky quard representing crustal conditions. The diamond whiskers crystalized during the heal-up of the primary α-quard by β-quard via supercritical fluid. Besides the moissanite whiskers in beryl from Ehrenfriedersdorf, diamond whiskers in Zinnwald/Saxony are a further example of the untypical mineral formation in Earth’s crust, usually formed deep in the Earth’s mantle.
Keywords
Raman spectroscopy, Supercritical fluid α- and β-quartz, Coesite, Diamond, Diamond whisker, Cavitation
Introduction
According to Cheng et al. [1], a significant challenge is the quantifying deep carbon cycling, including carbon flux from subduction-zone fluids to mantle wedges, subsequently to volcanic arcs, and ultimately back to Earth’s surface. Their studies used the type V HDAC chamber at temperatures of 800 to 900°C, 1.2 to 1.8 GPa, and pure CH4 gas and using the Ni-NiO (NNO) and the fayalite-magnetite- quartz (FMQ) buffer. To sum up, their studies showed that carbon- silicon species like SiC are unlikely to be found in subduction-related fluids. That is a contradiction to a large number of observations on supercritical fluid coming directly from the mantle deep to the Earth’s crust [2-5]. The origin of this contradiction is explained in the static of the HDAC experiments. Supercritical fluids or melts exhibit high dynamic behavior during their speedy ascent. Experiments under such conditions are challenging to perform. An alternative is to make careful observations of natural samples. In a recent paper, Thomas and Rericha [6] have shown that the formation of diamond-like carbon is not only related to high pressure and high temperature in nature. In the present example, the author shows an astonishing occurrence of diamond-like carbon and diamond whiskers in a re-crystallized smoky quartz crystal formed in crustal-related mineralization from Zinnwald/Saxony.
Sample Material and Methodology
Sample Material
The sample is a pegmatitic smoky quartz (about 6 cm long) from a vein pegmatite (so-called Flöze (seam)) from the Variscan tin deposit Zinnwald/E-Erzgebirge [7,8]. For the study, we used a thick section (500 µm thick) from this smoky quartz crystal cut perpendicular to the c-axis (Figure 1). This quartz crystal shows an old core (Qtz-o) with a typical Raman spectrum of α-quartz. An uncommon Raman spectrum with extreme Raman lines at the low-frequency range from 10 to 300 cm-1 characterizes all parts of the crystal containing graphite globules. This quartz shows a grainy structure. The number of graphite globules (>5 µm) is about 1.2 x 10⁴/cm3. However, there are significant differences in the diameter of such globules, which can obtain values up to 100 µm. Therefore, the given number per cm3 is uncertain. Especially because also are present many submicroscopic fin-disperse carbon particles distributed through the whole volume, however, not in the α-quartz remnants.
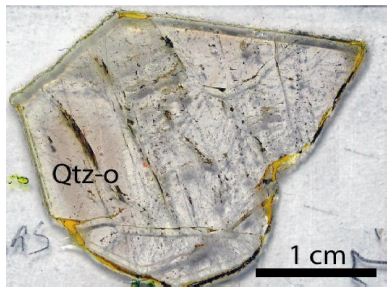
Figure 1: Thick section of the used quartz sample (ZQ-2) from Zinnwald, E-Erzgebirge. Qtz-o is the older core of the a-quartz crystal.
All parts of the quartz contain secondary fluid inclusions with CO2 as the main species in the vapor phase. Methan (CH4), also in traces, could not be proved.
Maybe the grey “striations” in the quartz volume are regions of increased carbon concentrations or are domains of β-quartz.
Figure 2 shows details of the sample around a spherical graphite grain (about 50 µm in diameter). Characteristically, are the tension cracks around the graphite. The quartz field around such tension cracks shows many small globular quartz grains surrounded by a thin carbon film (Figure 2, left lower quadrant) characterized by the typical D1, D3, G, and D2 Raman bands in the first-order region of carbonaceous material [9].

Figure 2: Diamond and graphite in quartz from Zinnwald. D – diamond, Gr – graphite, Qtz – quartz.
Microscopy and Raman Spectroscopy
We performed all microscopic and Raman spectroscopic studies with a petrographic polarization microscope (BX 43) with a rotating stage coupled with the EnSpectr Raman spectrometer R532 (Enhanced Spectrometry, Inc., Mountain View, CA, USA) in reflection and transmission. The Raman spectra were recorded in the spectral range of 0–4000 cm−1 using an up-to-50 mW single-mode 532 nm laser, an entrance aperture of 20 µm, a holographic grating of 1800 g/mm, and spectral resolution ranging of 4 cm−1. Generally, we used an objective lens with a magnification of 100x: the Olympus long- distance LMPLFLN100x objective (Olympus, Tokyo, Japan). We used a water-clear natural diamond crystal as a diamond reference [10]. For the fast mineral identification with the Raman-micro-spectroscopy, we used the RRUFF database and the CrystalSleuth program [11]. Further details are in Thomas and Rericha.
Reference Material
Coesite
As a reference, we used the synthetic-grown coesite crystal MKM- 00-15 (Figure 3) [12,13].
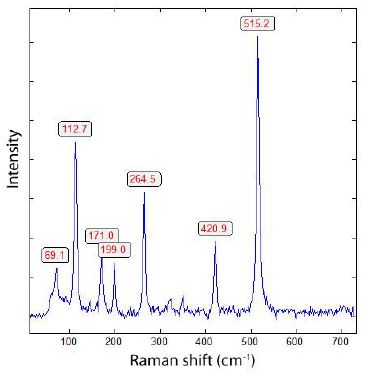
Figure 3: Raman spectrum of coesite (crystal MKM-00-15) – 532 nm laser and 5 mW power on the sample.
Diamond
We used a water-clear natural gem-type diamond with a diameter of 4 mm (Mining Academy Freiberg: 2453/37 from Brasil). 20 measurements taken between the here presented data results in a mean for this diamond of 1332.2 ± 0.4 cm-1.
Single-Walled Carbon Nanotubes (SWCNTs)
From: ProGraphite GmbH, Untergriesbach, Germany.
Results
The quartz (Qtz-o) in Figure 1 shows the typical Raman spectra of α-quartz (see Chukanov and Vigasina, 2020 [13]). Typical Raman bands are 1231w, 1160w, 1083w, 808w, 697w, 463s, 401w, 354, 263w, 205, 128 cm-1 (w – weak, s – strong). The background is generally linear over the whole Raman range (see Figure 4).
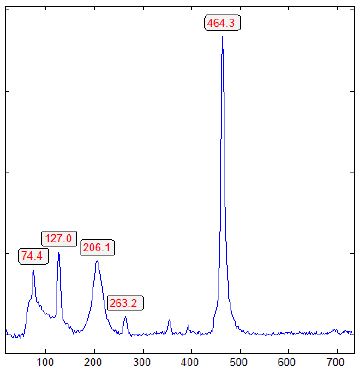
Figure 4: Typical Raman spectrum of a-quartz (Qtz-o in Figure 1) in the low-frequency range.
In comparison, the quartz near carbon globules shows a noticeable Raman spectrum (Figure 5) with extreme bands in the very low-frequency range (0 – 300 cm-1). The origin is unclear because carbonaceous material has no typical Raman band in this region [14] and is on the measuring point not seen. According to Chukanov and Vigasin, for quartz in this region, there are only weak bands at 128 and 205 cm-1 typically. Therefore, we have looked for the origin of these “unusual” Raman bands in the low-frequency region.
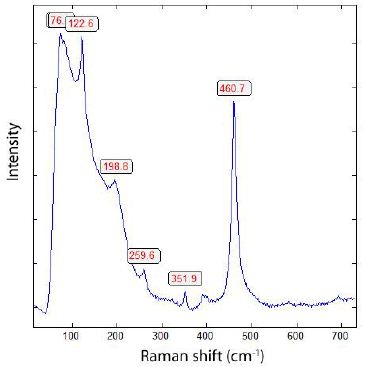
Figure 5: Raman spectrum of quartz around a graphite inclusion (Figure 2, Qtz+Gr) characterized by strong Raman bands in the very low range from 0 to 300 cm-1.
Conspicuous are the intense tension cracks around the elliptic- spherical carbon bodies. According to Raman spectroscopy, all such spherical carbon bodies contain diamond grains (nanodiamonds?) characterized by a double peak in the first-order range:
Diamond: 1321.2 ± 5.2 cm-1, Graphite: 1573.7 ± 7.9 cm-1; n = 13 different crystals.
A typical Raman spectrum (first order) of diamond in a carbon globule is shown in Figure 6. The Raman values for diamond and carbon speak for 12C-rich phases [15].
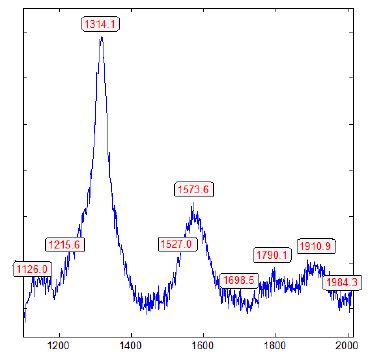
Figure 6: Raman spectrum of diamond in spherical carbon globule (see Figure 2).
The occurrence of diamond-bearing carbon globules in the Zinnwald quartz is clear proof of their origin deep in the Earth’s mantle and their transport into the crustal range via supercritical fluids. Because the studied quartz crystal contains older remnants of α-quartz (Qtz-o in Figure 1), the trapping of such diamonds is connected to the heal-up of a younger date.
In the younger quartz part, there is further proof of an HT-HP history. Rare and difficult to find are complex boron silicon-carbide- nitride globules like Figure 7 [16,17]. Similar globules were found in the cassiterite from Ehrenfriedersdorf (Sn-58, Magdalena vein, second level central gangway) – see Thomas [18].
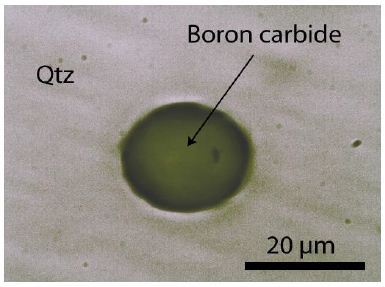
Figure 7: Complex boron carbide-nitride globule in quartz from Zinnwald. Qtz – quartz.
A further important hint to the influence of supercritical fluids in the crust region is the proof of rare coesite in the quartz crystal (Figure 1) outside the older α-quartz (Qtz-o) together with graphite- like carbon (Figures 8 and 9) [19,20].
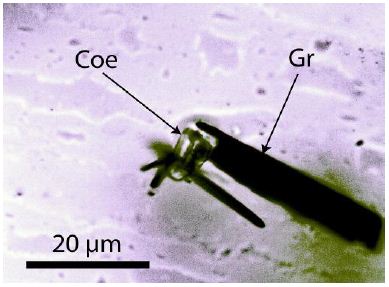
Figure 8: Prismatic coesite (Coe) crystal in quartz from Zinnwald beside graphite (Gr) needles.
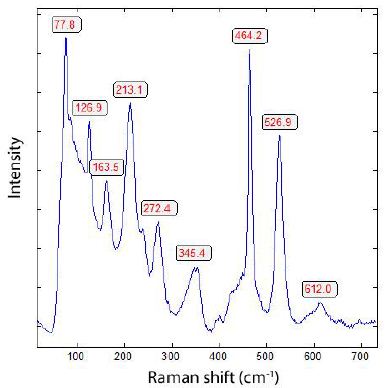
Figure 9: Raman spectrum of coesite in quartz from Zinnwald. Note the shifts of the coesite bands are the result of residual pressure within the coesite inclusion in quartz.
The shift of the very strong coesite main band from 521 to 526.9 cm-1 corresponds, according to Hemley [21], to an internal pressure of about 2 GPa, and the shift of the 116 to 126.9 cm-1 band to a pressure of about 1.5 GPa. The Raman band at 464.2 is the α-quartz main band hosting the coesite. In contrast to the Raman spectrum of the free-standing synthetic coesite crystal (Figure 3) is the coesite from Zinnwald characterized by a fast-increasing background from 400 to 70 cm-1 where the 77.8 cm-1 band has about the same intensity as the strongest quartz band at 464 cm-1.
The occurrence of coesite in the healed-up quartz crystal is an exceptional surprise, topped by the finding of diamond whiskers in the same sample (Figures 10 and 11). A clearer diamond whisker is shown in Figure 11 with two heal-up points of fracture.
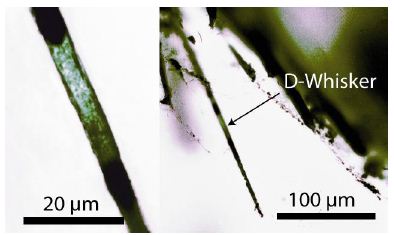
Figure 10: Diamond whisker (D-Whisker) in a quartz crystal from Zinnwald/Saxony. The whisker is about 200 µm long. The left image is an enlarged part of the whisker. After measurement, the primary, more or less clear part of the whisker turns black.
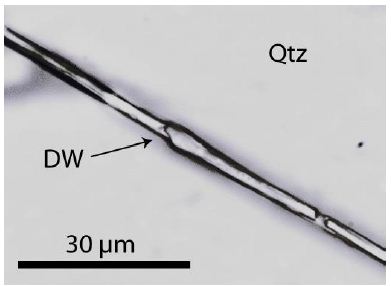
Figure 11: Diamond whisker (DW) in quartz (Qtz) from Zinnwald/Saxony. The about 80 µm long whisker is almost water-clear (in contrast to the whisker in Figure 10).
In Table 2 are the results of the Raman measurements on the diamond in graphite needles and of the diamond whiskers in smoky quartz from Zinnwald summarized. For comparison, the Raman data for the reference diamond is also given.
Table 1: Raman data of two different coesite types in the Zinnwald quartz (main band).
|
Type |
Raman band (cm-1) | FWHM |
n |
| On the quartz surface |
520.8 ± 1.8 |
14.3 ± 0.8 |
6 |
| In the quartz volume |
526.0 ± 1.2 |
14.1 ± 2.6 |
10 |
FWHM – Full -Width at Half Maximum.
Table 2: First-order Raman bands of diamonds in quartz from Zinnwald.
|
Type |
Raman band (cm-1) | FWHM |
n |
| Diamond in graphite needles |
1321.6 ± 7.0 |
14.3 ± 0.8 |
14 |
| G-band |
1575.6 ± 6.5 |
51.7 ± 13.2 |
14 |
| Diamond whiskers |
1321.6 ± 3.8 |
51.6 ± 6.7 |
12 |
| G-band |
1552.9 ± 7.1 |
47.9 ± 4.3 |
12 |
| Diamond reference |
1332.2 ± 0.4 |
4.3 ± 0.4 |
20 |
FWHM – Full -Width at Half Maximum.
Figure 12 shows a typical Raman spectrum of a diamond whisker in quartz from Zinnwald in the first-order region (see Thomas, 2025).
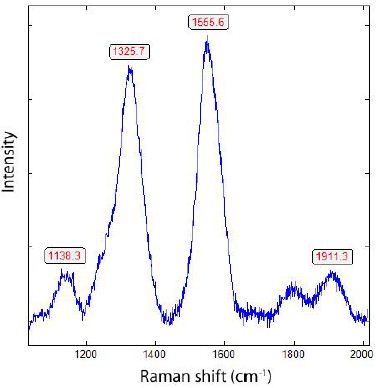
Figure 12: Raman spectrum from a diamond whisker in the Zinnwald quartz. The 13C content of the diamond and graphite are relatively high: 18.3 and 41%, respectively.
Besides the rare diamond whiskers, there are also many single graphite-like needles present. One part of them contains micro- or nanodiamonds. At the outer growth zone of newly formed quartz, there are a lot of carbon/graphite bunches, like Figure 13. Often, the graphite needles are bent. Some needles and globules show the forbidden 867 cm-1 out-of-plan Raman mode [22]: 868.8 ± 4.6 cm-1 n = 16 (different graphite needles and globules).
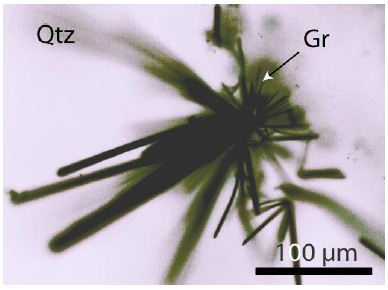
Figure 13: Graphite (Gr) bundle in the last growth zone of the quartz (Qtz) crystal from Zinnwald/Saxony.
However, in some carbon globules, this so-called forbidden mode is particularly intense. Simultaneous to the substantial forbidden Raman mode increase dramatically, the Raman intensity in the low range of about 60 to 350 cm-1 with the extreme Raman line around 124 cm-1. Such modes correspond to radial vibrations of carbon atoms. According to Zakalyukin et al. [23], such a unique phonon mode appears only in carbon nanotubes [24]. The single-walled carbon nanotubes SWCNTs (see references materials) give two very strong Raman bands at 106.1 and 1572.2 ± 4.6 cm-1, as well as a strong band at 867.0 cm-1. The origin and interpretation of these bands should be the task for further studies.
Interpretation
The interpretation of the results of the smoky quartz sample from Zinnwald is difficult. To date, the formation of diamonds, especially of diamond whiskers, was unthinkable. The finding of moissanite whiskers in the Ehrenfriedersdorf beryl (Thomas, 2023) was already a surprise. And now, diamond whiskers are present in pegmatite quartz from the upper crust!
The first answer gives us evidence of coesite in quartz. However, the answer remains ambiguous because coesite can also intrude along with the supercritical fluid. Such fluids have brought, besides energy and water, silicates, diamond/graphite, and coesite. Diamonds are in the upper crust at high temperatures, are not stable, and are transformed mainly into carbon material containing diamond rests. This transformation is linked to a significant volume increase of about 35.8%. Whereby the formation of tension cracks results. The new-formed quartz shows opposite to the remnants of older α-quartz (Figure 4) high-quartz or β-quartz characteristics (Figure 5). The position of the quartz main Raman line at 460.7 cm-1 is, according to Chen [25], an essential hint of β-quartz. After the same authors, the intensity-strong bands between 0 and 300 cm-1 speak for themselves for doped α-quartz. In the case of Chen et al. (2019), they used Pb4+. In our case, Pb4+ is improbable. Sn2+ would be a candidate. However, there are no indications for them in the used sample (in difference to the quartz studied by Thomas, 2025b [24]).
Discussion
Figure 2 shows that a large part of the primary α-quartz was solved away by supercritical fluids, which changed into an under-critical fluid in the place of the present α-quartz. Through such a process, new crystallization occurs, which crystallizes now β-quartz, in which the supercritical fluid load (coesite, graphite, diamond, solely as spherical crystals) is trapped simultaneously. The changeover from supercritical to under-critical state and back happens several times (decrease and increase of the water content).
Fluctuations of this type give rise to the formation of cavitation waves with enormous pressure and temperature impacts generated by the formation and collapse of micro-bubbles (see also Thomas 1982, remark 1 on page 60). When the bubbles collapse near a solid surface, the resulting shock waves and microjets generate enormous forces, which may be responsible for the diamond and especially for the diamond whisker formation.
One point here is essential: carbon in any form was never an object of research in the German Variscan mineralizations – the why is not clear.
One crucial point crystallized from the studies in the last years. That is, supercritical fluids initiate the formation of pegmatites/ melts, changing from a supercritical to an undercritical and back to the initial state. At that changeover, cavitation processes can act in, for example, pegmatite bodies (large pegmatite pockets like that in Volyn), and with its related cavitation, large quartz crystals pull from its basis [26].
Acknowledgments
This paper is dedicated to my wife, Margit Beckmann, for her immeasurably patience and support in our daily lives.
References
- Cheng N, Chou I-M, Chen Y, Duan Z, Wang X, Yan H (2025) Carbon-silicon species are unlikely in subduction-zone Communication Earth & Environment 6: 327: 1-9.
- Thomas R (2023) Growth of SiC whiskers in beryl by a natural supercritical VLS Aspects in Mining & Mineral Science 11: 1292-1297.
- Thomas R, Trinkler M (2024) Monocrystalline lonsdaleite in REE.rich fluorite from Sadisdorf and Zinnwald/E-Ertgebirge, Germany. Geol Earth Mar Sci 6: 1-5.
- Thomas R, Davidson P, Rericha A, Recknagel U (2023a) Ultrahigh-pressure mineral inclusions in a crustal granite: Evidence for a novel transcrustal transport mechanism. Geoscience 13: 94: 1-13.
- Thomas R, Recknagel U, Rericha A (2023b) A moissanite-diamond-graphite paragenesis in a small beryl-quartz vein related to the Varsican tin-mineralization of the Ehrenfriedersdorf deposit, Aspects in Mining & Mineral Science 11: 1310-1319.
- Thomas R, Rericha A (2025) Strong isotope fractionation between 13C and 12C in the supercritical fluids related to the Variscan mineralizations in Erzgebirge, Slavkovsky Les (Kaiserwald), and Lusatian Mountains, Germany, and the Czech Republic and some remarks on the low-pressure formation of diamond. Geol Earth Mar Sci 5: 1-5.
- Schröcke H (1954) Zur Paragenese erzgebirgischer Zinnerzlagerstätten. Neues Jb Mineral Abh 87: 33-100.
- Baumann L, Kuschka E, Seifert T (2000) Lagerstätten des Enke, 300 p.
- Beyssac O, Coffeé B, Chopin C, Rouzaud JN (2002) Raman spectra of carbonaceous material in metasediments: a new geothermometer. of Metamorphic Geology 20: 859-871
- Thomas R, Davidson P, Rericha A, Recknagel U (2022) Water-rich coesite in prismatine-granulite from Waldheim/Saxony. Veröffentlichungen Museum für Naturkunde Chemnitz 45: 67-80.
- Lafuente B, Downs RT, Yang H, Stone (2016) The power of database; The RRUFF project. In Highlights in Mineralogical Crystallography; Armbruster T, Danisi RM (Eds.); De Gruyter: Berlin, München, Boston 1-30.
- Koch-Müller M, Fei Y, Hauri E, Liu Z (2001) Location and quantitative analysis of OH in Phys. Chem. Miner 28: 693-705.
- Chukanov NV, Vigasina MF (2020) Vibrational (Infrared and Raman) Spectra of Minerals and Related Compounds. Springer 1376 p.
- Ferrari AC, Robertson J (2004) Raman spectroscopy of amorphous nanostructured, diamond-like carbon, and nanodiamond. Trans. R. Soc. Lond. A 362: 2477-2512. [crossref]
- Thomas R (2025a) Extremely 13C-rich diamond in orthorhombic cassiterites in the Variscan Erzgebirge, Saxony/Germany. Geol Earth Mar Sci 7: 1-5.
- Weringhaus T (1997) MicronRaman Spectroscopy Investigations of Hard Coatings. Dissertation, TU Chemnitz-Zwickau 163
- Werheit H, Filipov V, Kuhlmann U, Schwarz U, Armbrüster M, et al. (2010) Raman effect in icosahedral boron-rich Sci Technol Adv Mater 11: 1-27.
- Thomas R (1982) Ergebnisse der thermobarometrischen Untersuchungen an Flussigkeitseinschlüssen in Mineralen der postmagmatischen Zinn-Wolfram- Mineralisation des Freiberger Forschungshefte C370, Pg: 85.
- Korsakov AV, Kohn MJ, Perraki M (2020) Application of Raman spectroscopy in metamorphic petrology and Elements 16: 105-110.
- Tuschel D (2019) Stress, strain, and Raman Spectroscopy 34: 1-9.
- Hemley RJ (1987) Pressure dependence of Raman spectra of SiO2 polymorphs: a-quartz, coesite, and High-Pressure Research in Mineral Physics. Eds. By Manghnani and Syono 347-359.
- Thomas R, Rericha A, Pohl WL, Davidson P (2018) Genetic significance of the 867 cm-1 out-of-plane Raman mode in graphite associated with V-bearing green Mineralogy and Petrology 112: 633-645.
- Zakalyukin RM, Levkevich EA, Kumskov AS (2023) One-dimensional NaSn2F5 crystals inside single-walled carbon nanotubes. Crystals 13: 1-15.
- Thomas R (2025b) SnF2-rich supercritical fluid in the Variscan tin deposit Zinnwald/ Saxony, Geol Earth Mar Sci 7: 1-5.
- Chen X, Feng W, Thang G, Gao Y (2019) Raman spectra of quartz and Pb4+-doped SiO2 crystals at different temperatures and pressures. Crystals 9: 569: 1-9.
- London D (2008) Pegmatites. The Canadian Mineralogist, Special Publication 10:347.