Abstract
Mind Genomics explored responses for an e-commerce website, focusing on a website with ‘deep knowledge’ of the user’s preferences. To understand the application of Mind Genomics in a real-world setting, the timing of the setup and the fielding were limited to a total of 120 minutes. The data were collected in Spring, 2019. Four years later, newly developed AI analysis further interpreted the results. The initial analysis in 2019 deconstructed the ratings assigned by the respondents to vignettes, combinations of messages, describing the website. The respondents used an anchored 5-point scale, with the anchors ‘buy’ and ‘not buy’, respectively. The deconstruction by OLS regression revealed the contribution of each element to the ‘buy’ rating. Clustering the 46 respondents using the 16 coefficients uncovered three Mind-Sets: MS1-Help the client grow, MS2-Client Consulting, and MS3-Generate Leads. Four years later AI was applied to each group in the population, using six standard AI queries applied to all positive elements which were deemed to be strong drivers of ‘buy.’ This paper shows the possibility of rapid and insightful learning on new topics. Learning is promoted through experimental design coupled with human validation, and AI interpretation.
Introduction
The computer, the Internet, the Internet of Things, and the focus on real-time optimization continue to empower our modern age. You can’t go a single day without encountering a constant stream of ads and requests to buy. These advertisements often feature items that have already been purchased or viewed, as well as items left in a shopping cart. They are based on microsecond analyses of the shopping behavior of consumers. The analytic abilities are now so powerful that big data looks antiquated when compared to the small data generated constantly.
This paper explores what could be considered an important issue, the need to improve the flow of information between the customer and the online retailer. Online retailers function best with a large amount of data about their customers.
For roughly a decade, brands and retailers have been promoting their strategies for being “consumer centric” This means that they want to put the customer at the heart of all the work they do. In effect, this puts the consumer into the driver’s seat, with consumers ‘telling the brands’ what brand experience to create for them. When it comes to analyzing consumer behavior and preferences, retail analysts are tasked with interpreting data from consumers – such as sales figures, consumer trends and satisfaction ratings to develop insights for managing the retail enterprise profitably.
Retailers, the brands they carry, and internet service providers are increasingly criticized by privacy advocates and regulators for using data collected from consumers to develop detailed profiles on each one to tailor the commercial experience and to precisely target their messages. In response, most data collectors now offer opt-out methods to limit the data collection, its uses, and sharing with third parties, but doing so is not obvious. There is a widespread growing belief or, at the very least, a loudly expressed recognition, that data created by an individual belongs to them and should be controlled by them, similar to the requirements set forth in the EU’s 2018 General Data Protection Regulation [1].
Our world is inundated with data. As the speed and volume of data increase, our ability to form scientific questions, track trends, or subject the rapid pace of life to scientific inquiry is lost. Amidst massive amounts of data and massive optimization opportunities, it becomes increasingly hard to ‘think slow’.
We are accustomed to the slow, majestic, ingrained, now entrenched system of hypothetico-deductive reasoning [2]. It is a basic concept that scientists, or even individuals, can ‘advance,’ when they form a hypothesis and test it rigorously, trying to falsify the hypothesis. As technology speeds up the production of data and its acquisition, it is also necessary to accelerate knowledge and thought. In the harder sciences like biology and chemistry it may take exceptional creativity to produce knowledge, but in the human-centered sciences this may not be a major problem. With the advancements in computer technology, some paradigm shifts may already be possible [3].
Recurring Issues in the World of More Knowledgeable Websites
With the increasing excitement and, occasionally, almost manic positive responses about websites ‘knowing people’ comes the issue of privacy at the most obvious, but more deeply the morality of machines which have been programmed to learn about people The topic of this paper is the desire of respondents for websites (viz., provider technology) to ‘know them’, or perhaps the opposite, the fear that the machine may know too much, and the consequent loss of privacy. Some of this issue is one’s own desire for privacy, but some of it is the ‘morality’ of machine knowledge about facts relevant to individuals, and the implications of the wide availability of such knowledge. The issue is not ‘all or not’ either, for with knowledge by websites of people comes the smoother operation of interactions, the reduction of annoying, and occasionally harmful friction.
Mind Genomics: The Promise and Vision for the Future
Mind Genomics is a new, emerging science which traces back to three disciplines [4-8]. These are:
- Experimental psychology which searches for the causes of human behavior. The specific area of experimental psychology giving rise to Mind Genomics is psychophysics, the discipline which searches for lawful patterns in between what is presented and what we perceive For Mind Genomics that relation is between the words describing a situation and the judgment we say we would make.
- Statistics, The respondent reads combinations of elements, messages, describing this ordinary situation, and rates the feeling on a scale provided by the researcher.
- Consumer research, which examines how consumers make decisions in everyday life, in which we live, work, succeed or fail. The goal is not to develop a new theory or to disprove an existing one, though these noble endeavors are possible. The only goal is to make sense of these patterns.
It is important now to keep in mind that the effort is more in the world of ‘hypothesis-generating’ than in the world of ‘hypothesis-testing.’ Quite often researchers really have no hypotheses to test but are constrained to do the study as if it were guided by a hypothesis. Mind Genomics does not care about that. It is simply a tool to discover patterns that may be interesting regarding how people think.
The process of Mind Genomics is a simple one, beginning with the question of what do people do about the information they receive as they are instructed to make a decision? Typically, the respondent is presented with the situation, using a simple story, even a single sentence. It is the goal to find regularities and relations within nature. Such discoveries generate the raw material for understanding how people think. When these discoveries are amalgamated from well-done experiments and when they reach critical mass, they form a coherent database, and in turn these coherent databases become the foundation of technology and science.
This study forms part of a new initiative in Mind Genomics which aims to massively accelerate the acquisition of information and insights for everyday life, including topics such as subjective feelings toward e-retailing, including ‘smart websites.’Another motivation is to show, through a research program integrating artificial intelligence and systematized human testing, if the two can be used to reveal aspects of everyday life or even weak signals about changing attitudes.
This study was done in 2019 before the massive expansion of AI into the world of everyday consumer research analytics. The original study was done without any focus on what AI could add to the research effort, but rather focused on what people would want for a system in which they would give up their privacy. The actual data analysis reflects what people were thinking in 2019. The subsequent AI analysis, in turn, was done in the third week, of May 2024, with a view to what the data might mean for a business issue.
The project itself in each phase ran on an accelerated schedule. For the first part of the project, the actual research, the total time involved was less than three hours from start of the project (create the experiment) to the acquisition of analyzed data. For the second part of the project, the AI analysis of the results obtain four years before, the analysis took 30 minutes, consisting of an automated AI-driven reanalysis of the data tables The actual study itself with people came shortly after the first experience integrating AI and Mind Genomic by hand, with AI providing the raw information first, that information transformed into the test stimuli [9]. The effort presented here moves the process in the opposite direction, with AI providing a second, deep analysis of results already obtained.
The First Part of the Project – The Creation and Execution of the Survey with the Respondents
Mind Genomics is now scripted. It follows a templated process which reduces the “angst” of doing experiments as well as the time and effort required to collect data. Experience over a half century has shown that individuals are anxious when asked to “do science.
Mind Genomics scripts are designed to make sure that researchers can present the information in the correct format. In the actual experiment, relevant messages about a subject (called “elements”) are combined into short, easily readable vignettes. A vignette consists of 2-4 messages. People then rate the combinations using a scale. Each respondent ends up rating 24 different vignettes. The vignettes are different for each respondent, but all the elements remain the same [10].
Mind Genomics’ studies have been scripted to allow them to be run on a computer, smartphone, or tablet, with results available in a very short time. The information in Table comes from the study, text taken from the actual input by the researcher, and put together in the report to document the study. The information in Table 1 is available within five minutes after the end of the study, as is the basic analysis. The AI summarization requires an extra 20-30 minutes after the end of the field work. (Table 1)
Table 1: Key information about the study provided by the Excel report.

The setup begins with naming the study and the instructions to provide four questions relevant to the topic of study. Researchers are asked to structure four questions in a way that they “tell a story,” and then provide four answers to each question. Figure 1 shows the template. In 2019, it took several hours to create the four questions for each question and four answers.
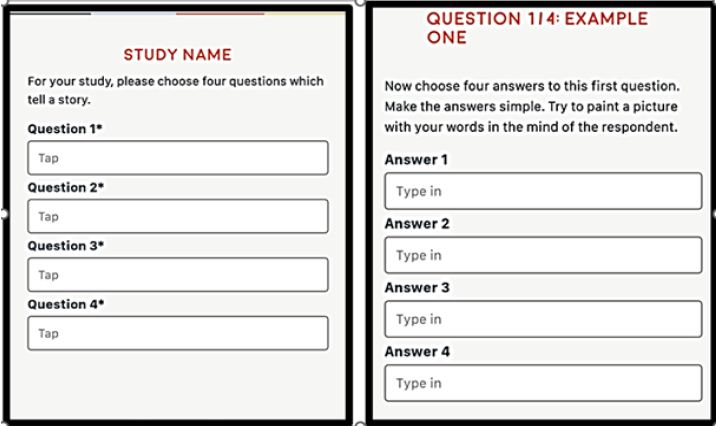
Figure 1: The templated request of four questions (left panel) and four answers as used by respondent to manually provide questions and answers.
Since Mind Genomics became available to the public more than 10 years ago as a DIY (do it yourself) technology, there have been many instances where researchers felt overwhelmed with the task of creating the elements.
It is now possible to use artificial intelligence to generate questions. The researcher only needs to write a paragraph into the Idea Coach box in the Mind Genomics template and the AI will return 30 different questions. The Idea Coach technology, which was launched in 2022, was three years after this study was conducted.
Figure 2 shows three additional set up screen shots from BimiLeap. These include the orientation page (left panel), the rating scale (middle panel), and the researcher’s file information about the rationale for the experiment as well as key words for a later search (right panel).
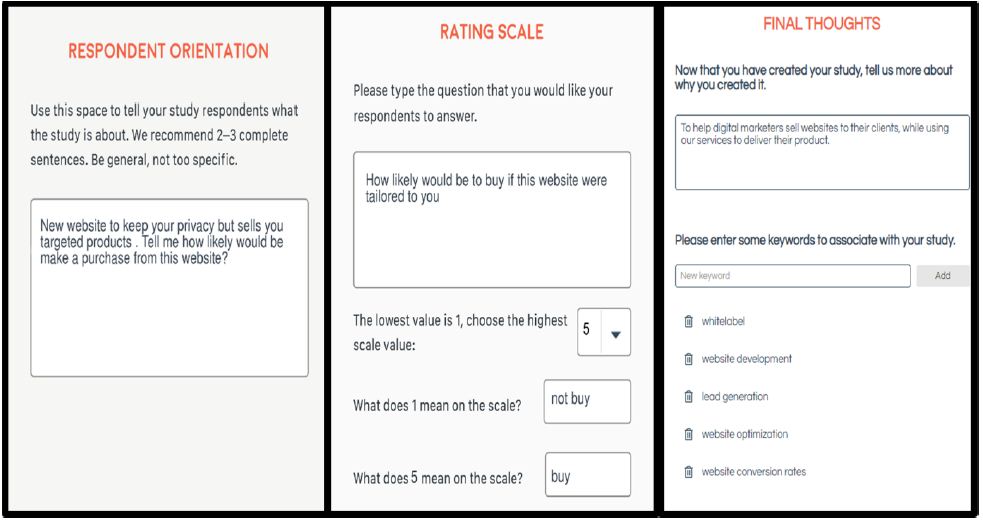
Figure 2: Three setup screen shots for BimiLeap. These are the orientation page (left panel), the rating scale (middle panel) and the file information (right panel).
The researcher can select the respondents’ source using the screen in Figure 3 following the study’s launch. This is done quickly within the BimiLeap software. Respondents are ‘sourced from’ a panel provider that specializes in online surveys. There are a number of panel providers around the world. These panel providers maintain lists of respondents with their qualifications. They are individuals who have agreed, in exchange for a reward from the supplier, to take part in similar studies. The researcher does not need to know about the agreement. The panel provider only needs to find the right respondent.
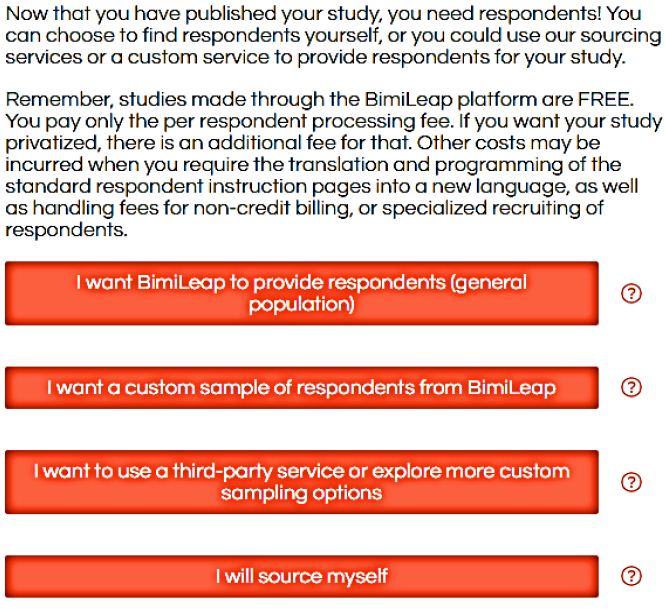
Figure 3: Sources of respondents selected by the researcher at the end of the project.
Mind Genomics research can include elements (questions, answers, etc.) in many different languages and alphabets. However, the instructions on how to set up the study as it is done by the researchers are only available in a limited number of languages.
The actual experiment with the subject lasted about 3 minutes. The experiment starts with a brief orientation. The respondent then answers a few self-profiling questionnaires (Figure 4, bottom panel). Finally, the BimiLeap program presents 24 different vignettes that have been systematically created. The vignettes contain 2-4 elements, at most one answer to a single question but often no answer to one or two of the questions (see Figure 4, top panel).. It will be this very incompleteness of the combinations which allows the analysis by OLS (ordinary least-squares), and the estimate of absolute values for the coefficients.
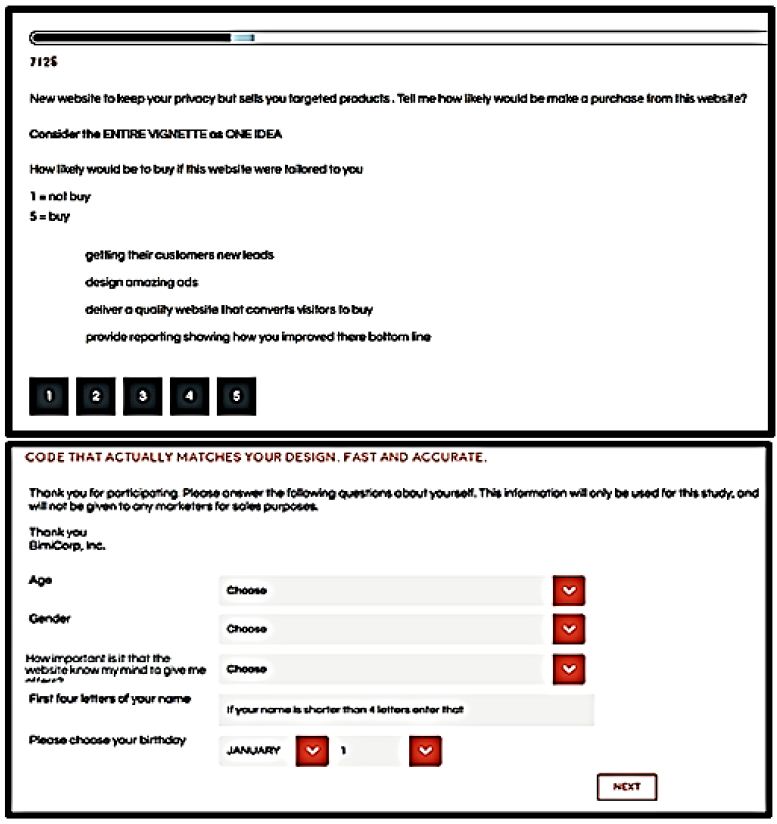
Figure 4: Sample four-element vignette (top), and self-profiling classification (bottom).
The experimental design allows for the analysis of each individual’s ratings, respondent by respondent, as well as analysis of groups comprised of any set of 46 respondents who participate in this study. The vignettes have been set up in a way that each person evaluates 24 unique vignettes. This design structure allows the researcher to explore different aspects of a problem without having to select which combination of elements gives the best chance for discovery.
Database Structure, Analysis, and Reports – Total Panel
It is easy to analyze the data because the experiment design has been preselected in a way that all the 24 combinations of different sets are isomorphs. The vignettes are different, but the mathematical structure is identical. The researcher will have a powerful analytical tool that allows them to explore a large part of the “design space” (the combinations). More respondents, and therefore more people, means that more design space will be covered.
A simple database makes it possible to perform the analysis. The database is divided into 24 rows, each of which corresponds with one of the vignettes that a respondent has tested. The database for the study contains 1104 rows, or 46×24, of data. Each respondent contributes 24 rows to the database, one row for each of the 24 vignettes evaluated by that respondent. The Columns are allocated for bookkeeping (row number, how the respondent profiles herself or himself), a column for the order of rating of the 24 vignettes (1-24), then 16 columns to show absence or presence (value 0 or 1) of an element, and finally the assigned rating and the response time. The response time is the number of seconds between the appearance of a vignette and the answer.
The program then creates two binary variables: TOP (ratings 5, 4 transformed into 100) and BOT (ratings 1, 2 and 4 transformed into 100). BimiLeap adds a vanishingly small number of random numbers for each BOT or TOP value to create needed This prophylactic measure ensures the required variability, even if the respondent rates all the vignettes as either 5 or 4 (all transformed TOP become 100) or 1 or 2 (all transformed BOT become 100).
Table 2 shows the parameters of the equation, expressed as: TOP = k0 + k1A1 + k2A2 .. k16D4 . This equation can be estimated accurately because the OLS regression does not have any correlation issues between variables. The coefficients emerging from the OLS are absolute values, so a 5 has half of the value as a 10 It is crucial to understand this necessary property, which allows Mind Genomics to create a science. The researcher can quickly grasp the dynamics in the data revealed by the experiment when the coefficients show the real magnitude of the effects.
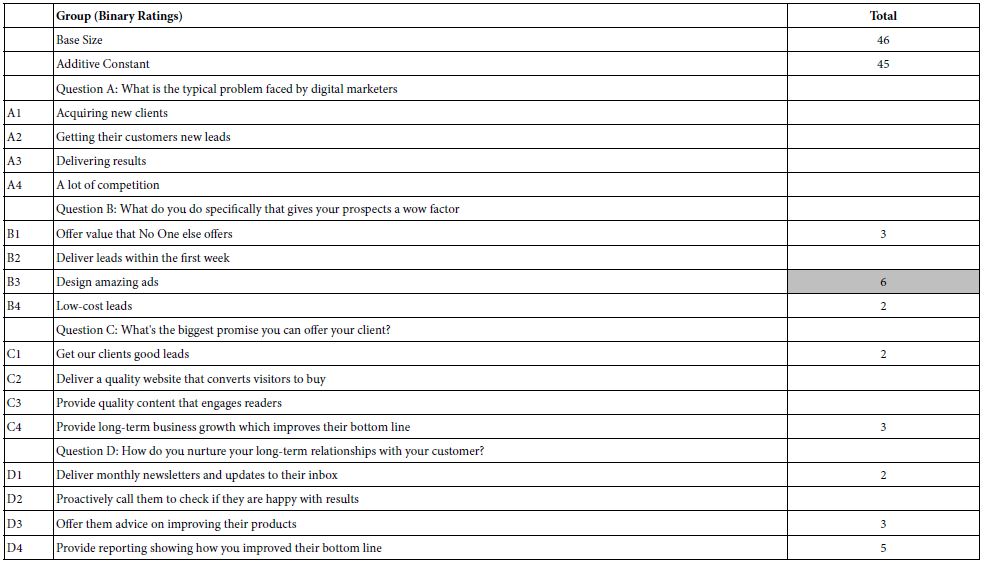
Table 2: Elements for the Total Panel which drive TOP (Sounds interesting). Only elements with coefficients > 1 are shown.
As a side note, this vision of absolute coefficients is often counter-intuitive to ‘experts’ who believe that the respondent needs all the information from the different questions to make a decision. Admirable as that point of view is, which ends up presenting complete vignettes to each respondent, the results data is almost impossible to understand, because the absolute coefficients have no meaning. It is only differences which have meaning. There is no possibility of databasing the results unless the entire study is replicated. Only then do the coefficients have meaning.
Table 2 shows the results from the Total Panel, of 46 respondents, each rating a unique set of 24 vignettes. The Table shows us places for the 16 coefficients, along with the additive constant.
This constant indicates the likelihood of respondents saying ‘buy’ in the absence of any element in the vignette. The vignettes are all designed with a minimum of two and maximum four elements. The additive constant can be thought of as a statistical correction factor. On the other hand, we can use this as a base, or a tendency for respondents to respond “buy”. This will help us gain this insight. Table 2 indicates that 45% of the responses will be 5 or 5, when they know what the system is, even when there are no specific elements to qualify the product. We could have measured this change over the years if we had done the same type of experiment.
In the interests of revealing patterns, the convention in this paper and others is to show only positive coefficients of value 2 or higher. Coefficients of 1, 0 and negative are of no interest. The low coefficients indicate that an element’s presence in a vignette “doesn’t add”. This does not necessarily mean the element detracts or is insignificant.
Eight out of 16 elements have coefficients greater than 1. All the rest generate coefficients that are 0 or negative. . However, only one element is really successful, “create amazing ads” with a coefficient of 6. Subgroups are likely to be hiding strong performers, as we shall soon see.
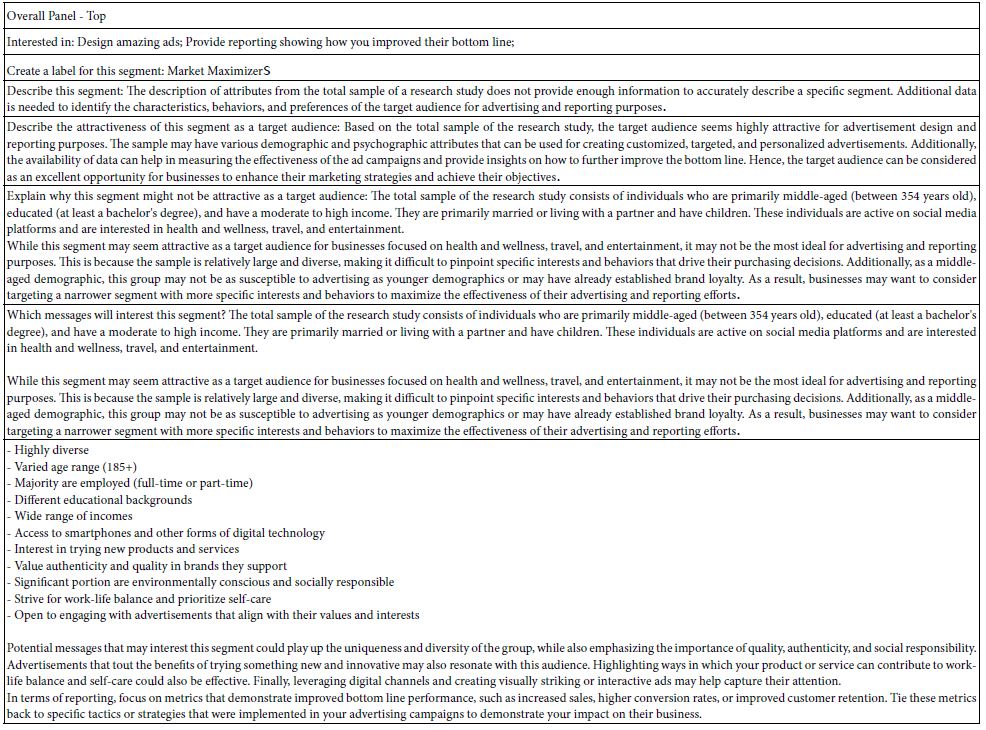
We now move to the AI interpretation of these results from the total panel. AI analysis should only be viewed as a set of tentative observations by a heuristic. AI can provide a quick answer before taking the time to analyze the entire dataset. The BimiLeap report has been upgraded to provide AI responses to the following six queries, using the coefficients for the key subgroup being summarized.
The following are the six queries.
Interested in
Create a label for this segment:
Describe this segment:
Describe the attractiveness of this segment as a target audience:
Explain why this segment might not be attractive as a target audience
Which messages will interest this segment
These queries primarily consider moderate or high performing elements with coefficients greater than +5. The elements with coefficients below 4 are considered, but not relied upon.
The AI summarization of the data, based on the six queries appears in Table 3.
Table 3: AI first scan and interpretation of the strong performing elements for the Total Panel.
Results from Self-profiling Questionnaire
The BimiLeap program instructed respondents to put themselves into one of four groups, based upon how they feel about an outside website having deep knowledge of oneself. Table 4 shows the pattern of coefficients generated by the two polar opposite groups, the first very excited and positive about the situation, the second bothered. As one might expect, the additive constants are higher for the positive group, and much lower for the negative group. Furthermore, there are more strong-performing elements in the positive group. Table 4 shows the coefficients of the elements. Table 5 shows the AI analysis of the patterns.
Table 4: Elements which drive TOP (Buy) for the two key segments emerging from the self-profiling question: How important is it that the website know my mind to give me offers?
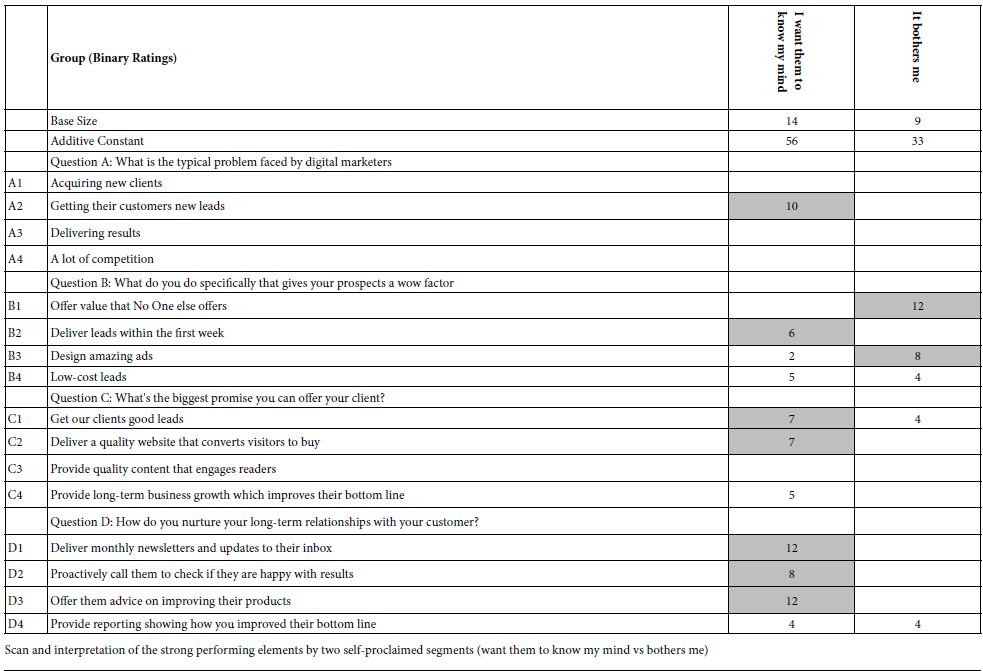
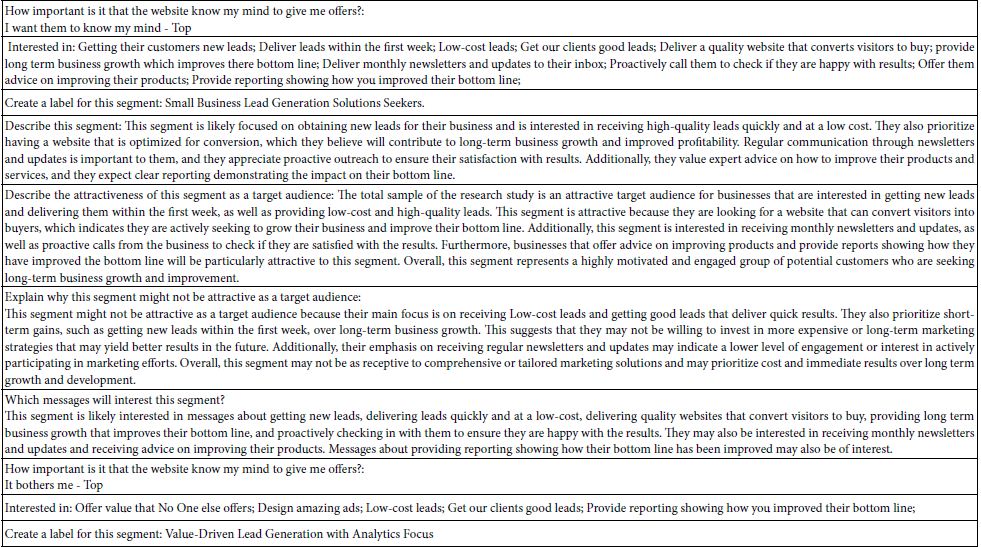

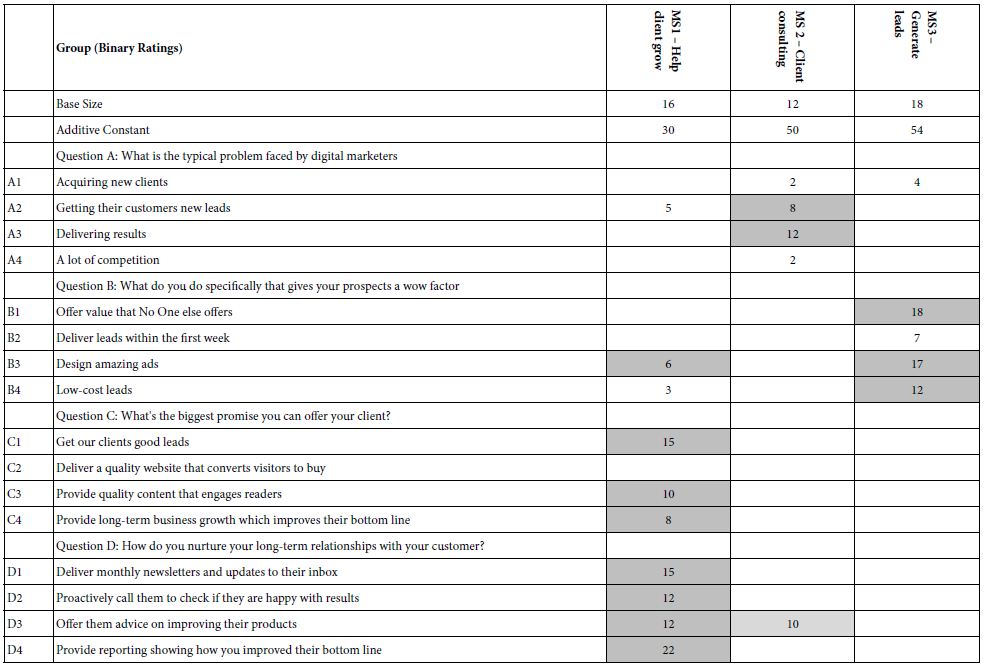
Table 5: Elements which drive TOP (Buy) for the three Mind-Sets, emerging from k-means clustering of all the element coefficients from the 46 respondents.
Dividing Respondents According to Mind-Sets Using the Coefficients
The final analysis of the data will be focused on creating Mind-Sets. These are groups of respondents that have been created by using the K-means Clustering Program based upon the similarity of the patterns made by their coefficients. We use the 16 coefficients whether they are positive or negative for clustering. The additive constant is not used in clustering [11].
BimiLeap. It generates two Mind-Sets at first, then three Mind-Sets. The Mind-Sets encompass all respondents. A person belongs to only one mind-set for the two mind-set solution, and again to only one mind-set for the three mind-set solution. The clustering results in meaningful groups that can be interpreted, despite the fact that the process is mechanical and mathematical.
Table 6 lists the elements that make up the successful performance of the Three-Mind-Solution. In order to save space, the two-mind solution is not included. The AI results are shown in Table 7, emerging after applying the six AI queries to the Mind-Sets.
Table 6: AI interpretation of the strong performing elements) by AI for the three-Mind-Set solution.
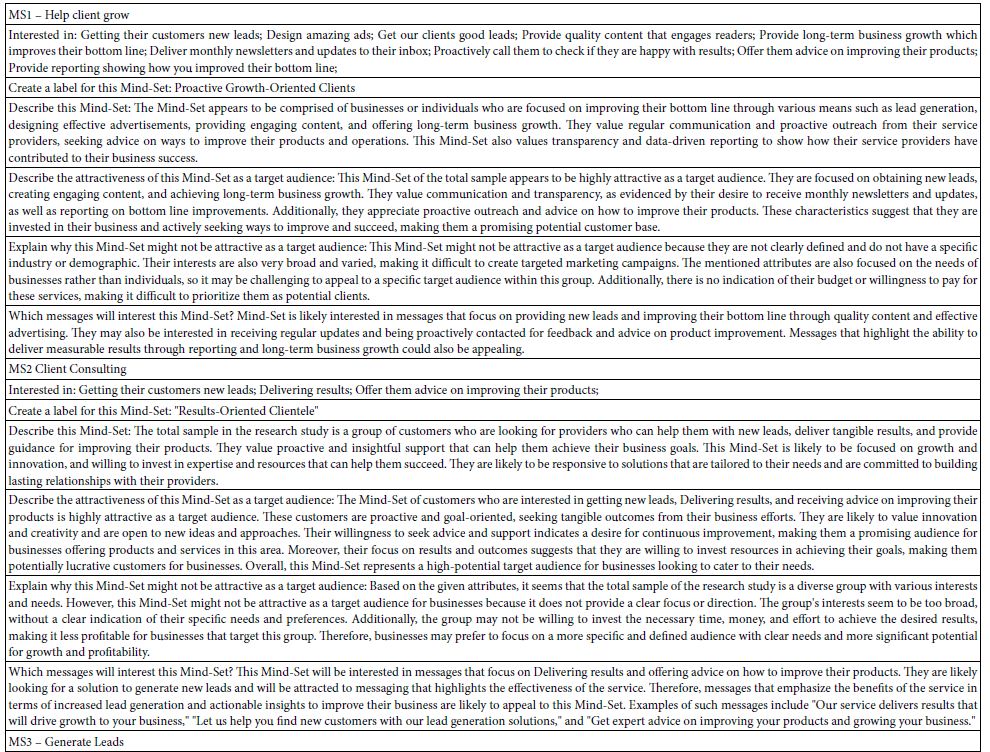
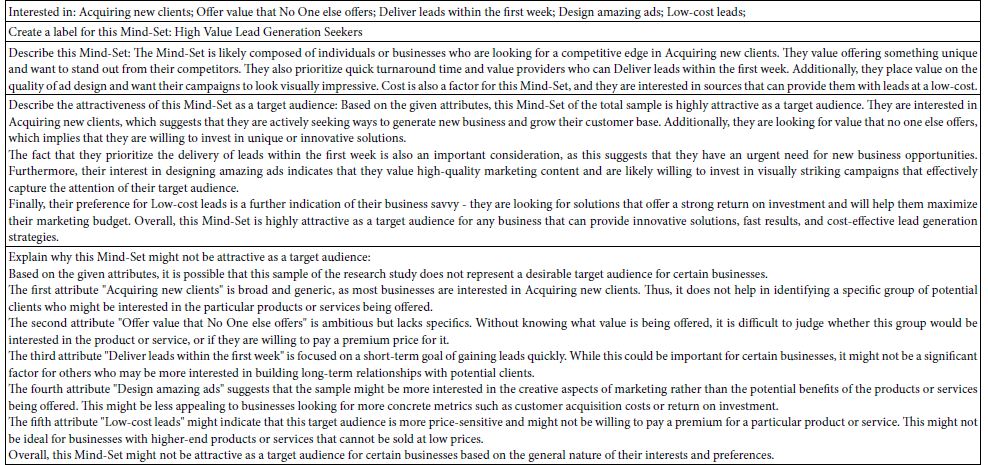

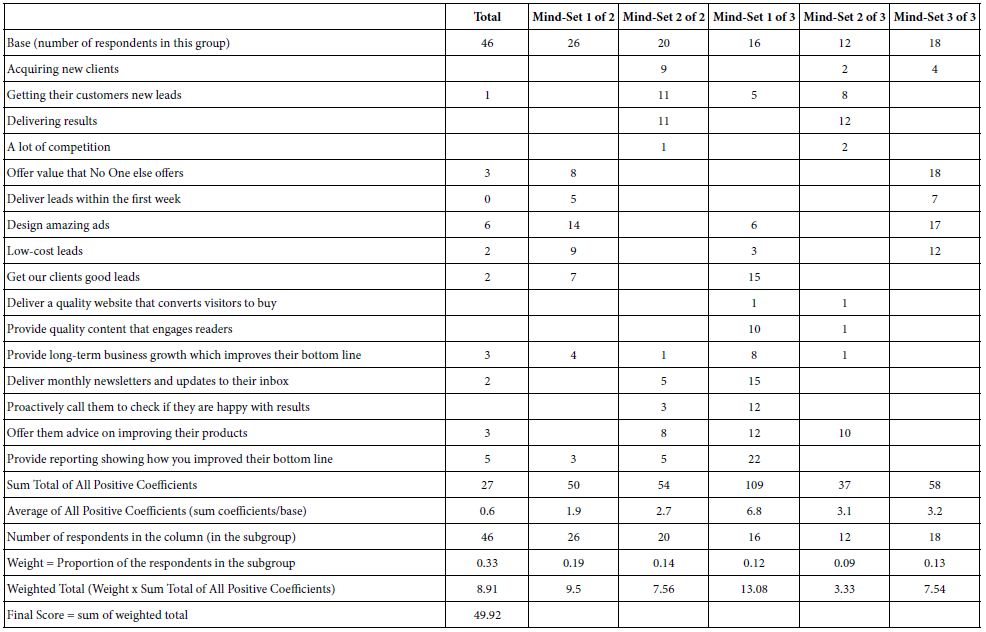
Table 7: The IDT, Index of Diverged Thought, showing the performance of the elements, and thus the strength of the thinking behind the specific Mind Genomics study.
Understanding Performance Using an Index Number (IDT, Index of Divergent Thought)
Researchers in many fields ask the same question: “How did we perform?” With Mind Genomics and AI still at an early stage, but available worldwide at the touch of a button, it becomes a matter of whether the research produced anything valuable. It is important to note that the notion of “value” does not refer to personal worth of data for the researcher or to reproducibility of science. Instead, for Mind Genomics we ask whether or not the study produced any high-performing elements. When we find strong elements, there’s a link between the element and rating questions. In these studies, the researchers are looking for this link. In those elements, the issue at hand can be better understood.
We present IDT Index of Divergent Thought as part of our effort to “systematize” the use of Mind Genomics, in an era of simple-to-use AI-powered techniques. IDT’s objective is to determine the effect of elements. IDT produces a simple, indexed result. This is shown in Table 8. When we divide the study into six groups, each sum of positive coefficients for that group is weighted by the relative number of respondents for that group. The six groups are Total, Mind-Sets 1 & 2 for the 2-Mind-Set solution, and Mind Sets 1, 2, & 3 for the 3-Mind-Set solution. The IDT is the weighted sum of positive coefficients. The weight is the ratio between the respondents per group and the total of 138.
The IDT by itself is simply an index number about how well the elements performed. With continuing use of the IDT as a metric, it may become possible to measure the degree to which a person grows in the ability to think creatively. One could imagine charting the IDT value for a person or group of people as they are challenged to think through various problems. The IDT gives us a way of measuring the ‘strength’ of alternative efforts to deal with the same issue, with different issues, after teaching interventions, and so forth. The alternatives may be the same researcher over time, the performance of studies done by individuals vs. those done by collaborating groups, and so forth. The IDT is objective, a simple index quickly calculated as part of the report to the researcher.
Discussion and Conclusions
The Mind Genomics method has been used to investigate the decision-making process for the world of the ‘everyday.’ Rather than focusing on topics of deep significance and with a long history of investigation, the researcher using Mind Genomics investigates simpler problems, such as what does a person want from a website which ‘knows’ the user. It is within that world view that the current study was done.
What emerges from Mind Genomics is far more than a simple snapshot of human decision making at the level of the concrete issue. One can sense from the use of commonplace features as elements that behind these everyday statements lay an entire universe of motivations, a universe that might totally disappear or at least lose its vitality if the statement were couched in the general, rather than in the specific. It is the richness in the meaning of everyday experience which provides deep learning. In other words, Mind Genomics provides emotion-rich, philosophically rich metaphors that ordinary, academic language cannot.
Armed with that point of view the paper no longer talks only about websites which know the person. Rather, the paper talks to the issue of emotional responses to different ways of weighting information to decide. different ways of responding to recommendations from a ‘machine’ and the concern with the nature and trustworthiness of machines which know the person. The issues lose a bit in the translation when they are stated in the form of generalities, but create immediate, palpable internal sensations when they are described by daily, identifiable events, viz., by realistic metaphors.
Beyond the actual data from the Mind Genomics exercise, however, lies the second layer of AI analysis. The AI process was told to look at the elements in general, especially those with coefficients of +6 or higher, along with the additive constant, and summarize the results through six queries. The objective of the exercise was to publicly present the data, and then the AI interpretation of the data, untouched by human hands. No attempt was made to structure the output of the AI, this effort being among the first to attempt a machine-level summarization. It is likely that we will see significant advances in ‘insights and languages, as the ever-evolving AI amplifies the structured outputs of Mind Genomics experiments.
References
- EU (2023) “What is GDPR, the EU’s new data protection law?”, https: //gdpr.eu/what-is-gdpr/, accessed May 28 (2023).
- Sprenger J (2011) Hypothetico‐ confirmation. Philosophy Compass 6: 497-508.
- Kim TW, Mejia S (2019) From artificial intelligence to artificial wisdom: what Socrates teaches us. Computer 52: 70-74.
- Longoni C, Bonezzi A, Morewedge CK (2019) Resistance to medical artificial intelligence. Journal of Consumer Research 46: 629-650.
- Longoni C, Cian L (2022) Artificial intelligence in utilitarian vs. hedonic contexts: The “word-of-machine” effect. Journal of Marketing 86: 91-108.
- Manikonda L, Deotale A, Kambhampati S (2018) December. What’s up with privacy? User preferences and privacy concerns in intelligent personal assistants. In: Proceedings of the (2018) AAAI/ACM Conference on AI, Ethics, and Society 229-235.
- Ashoori M, Weisz, JD (2019) In AI we trust? Factors that influence trustworthiness of AI-infused decision-making processes. arXiv preprint arXiv: 1912: 02675.
- Lara F, Deckers J (2020) Artificial intelligence as a socratic assistant for moral enhancement. Neuroethics 13: 275-287.
- Zemel R, Choudhuri, SG, Gere A, Upreti H, Deitel Y, Papajorgji P, Moskowitz H (2019) Mind, Consumers, and Dairy: Applying Artificial Intelligence, Mind Genomics, and Predictive Viewpoint Typing. In Current Issues and Challenges in the Dairy Industry. IntechOpen.
- Gofman A, Moskowitz H (2010) Isomorphic permuted experimental designs and their application in conjoint analysis. Journal of Sensory Studies 25: 127-145.
- Likas A, Vlassis N, Verbeek, JJ (2003) The global k-means clustering algorithm. Pattern Recognition 36: 451-461.