Abstract
Respondents evaluated systematically varied combinations of messages (vignettes) about healthful pasta. Each respondent evaluated a unique set of 48 vignettes constructed from 36 messages about different aspects of health carbs, rating it both on purchase intent and selecting the price willing to pay. Each respondents rated each vignette on both purchase intent and price would pay. Two sets of three mind-sets emerge, one based on purchase intent, one based on price would pay. Three patterns of mind-sets emerge; focus on cognitive (Brain) performance, focus on a healthier/more enjoyable life (Life), and focus on taste and sensory pleasure (Comfort Food). These mind-sets exhibit different patterns of what is important to them when making a judgment. The paper shows the ability of the emerging science of Mind Genomics to probe deeply into what seems at first to be a simple topic, healthful pasta, and the ability to reveal profound differences in the way people think about this supposedly simple, limited topic.
Introduction
During the past sixty-plus years, the notion that people ‘differ’ from each other in predictable ways has gained increasing popularity in the world of consumer research. The ever-present variation among people, observed by authors, philosophers, social scientists, biologists, not to mention governments and their politicians, no longer represents a source of irritating variability in the world of ‘nomos’, of laws which apply the same to all people. Rather, the person-to-person variations, the world of ‘idio’, is falling increasing under the scrutinizing lens of the researcher, who is searching for rules explicating that person-to-person variability.
More than sixty years ago, famed consumer researcher William D. Wells suggested that it might be possible to divide people not so much by who they ARE, but rather by how they THINK. This was the auspicious beginnings of the field of Psychographics [1], which eventuated into classifications such as PRIZM by Claritas [2], with its 68 different personas. The number of personas might seem unusually high in light of the normal desire of people to simplify the world, but the objective of PRIZM and such types of classifications is to deal with the remarkable diversity of the minds of people, doing so in a way, which makes the diversity tractable.
The move in business and research is find many mind-sets for a topic, and in so doing account for the substantial variability across people. Mind-sets, the search for ‘basic groups’, moves the reality of variability from merely an irritating fact-of-life to a front-and-center position as a signal that there are fundamental groups in the population to be discovered. The only issue is the desire to account for the variability by find ever more ‘basic factors’ in an attempt to explain as much of the variation as possible. The aforementioned system, PRIZM, is just such an example. The general focus, then, is to take a subject with a large number of aspects, like the way one thinks about life, or health, and break it down to simplistic groups. The key words are wide range, many groups, account for as much variability as possible
This paper moves in the opposite direction, looking at a topic that might be considered ‘narrow’ at the very outset, healthful pasta, and trying to divide this narrow topic even further. The objective, therefore, is to work with a narrow world that people might already consider to be ‘hard to segment because of its specificity’, and uncover even deeper-lying mind-sets.
Mind Genomics and the study of psychological granularity
We approach the topic of micro-segmentation looking at one product, healthful pasta. Pasta itself is a very large category around the world, historically important during the past centuries [3][4], and a source of continuing innovation. We are accustomed to pasta as being the carrier for a flavor-imparting and mouthfeel-imparting product, most generally that product being a sauce. Pasta can also be a carrier for vegetables, for meats, and even eaten without anything, except perhaps with a bit of melted butter to add flavor.
Our focus, micro-segmentation, means that we want to look at the different ways that a person can perceive pasta. One might ask the respondent to talk about pasta, and the different aspects of pasta, but it’s not clear that this in-depth interview or focus group interview will be able to uncover the micro-segments or realize their existence and nature when the research happens upon them. Conventional consumer research, whether interviews, surveys, and so forth, simply are instruments which, in the end, are just too dull to work. The issue is just how many ways can one talk about pasta, and what kind of questions can one ask, and then just recognize when something really new emerges.
Mind Genomics works in a variety of fashions radically different from the approaches used by consumer research. The approaches of Mind Genomics have been explicated in a number of earlier publications [5][6][7]
Experiment, not survey
Mind Genomics comprises experiments, not surveys, not discussions. Mind Genomics mixes together statements about the topic, pasta, these statements (or elements) having been combined by an underlying menu (experimental design) which dictates the combinations. For our case history with helpful pasta, we have to limit ourselves to the specific number required by the underlying experimental design. The Mind Genomics design requires six questions and six answers to each question (aka elements, messages) Table 1 shows the six questions, and the six answers to each question, or a total of 36 elements. These elements will be the raw material of the study.
One of the important aspects of Table 1 is the depth of information, the granularity of the statements. The granularity matches the type of information presented to people in every-day life, the type of information which makes the stimulus more real. People do not live in a world of abstractions, a world where the detail is sacrificed to a general phrase which is so general as to not to relate very much to the actual experience. For example, in Table 1 we might use the phrase ‘good carbohydrates’ to give the reader a sense of the stress on good for the mind, good for the body, good for everyday life. Yet, the term ‘good carbohydrates,’ pales in in comparison to the phrases in Table 1, which add color, texture, and a sense of reality.
Table 1
| Question A: How can whole gran fortified pasta be presented as a ‘brain food’? | |
| A1 | Fortified whole-grain pasta contains complex carbohydrates – the “good carbs” which are essential to healthy brain function…boosts your brainpower … keeps you mentally sharp |
| A2 | Brain friendly complex carbohydrates in fortified whole-grain pasta … low in Glycemic Index… increase mental alertness by releasing glucose |
| A3 | Iron-fortified whole-grain pasta improves memory and attention…many of us don’t get enough iron in our diet |
| A4 | Fuels the brain through the day…complex carbohydrates are digested slowly…steady glucose supply to the brain cells |
| A5 | Vitamins and anti-oxidants in fortified whole-grain pasta improve brain power & thinking… reduce risk of cognitive impairment |
| A6 | The carbohydrates in fortified whole-grain pasta supply your body with glucose… favored fuel for your central nervous system |
| Question B: How can whole grain pasta be presented as a food which improves health & performance? | |
| B1 | Look good & feel great at any age with a whole-grain fortified pasta diet… delivers plenty of energy & lifelong weight control |
| B2 | That surge of energy running through our body every time we eat whole-grain fortified pasta boosts self-confidence … so we love who we are |
| B3 | Eat your way to happiness with whole-grain fortified pasta …look & feel attractive! |
| B4 | Put radiance back into your skin with whole-grain fortified pasta, which helps you sleep better and stop night-time problems |
| B5 | Make your pasta whole-grain fortified, providing plenty of fiber …feel full and stay in a positive frame of mind all day! |
| B6 | Stop feeling tired, eat whole grain fortified pasta for extra stamina … no need to cancel your evening plans anymore! |
| Question C: How can one associate feelings with whole grain pasta (moods, emotions)? | |
| C1 | A filling whole grain fortified pasta serving…stops that regretful feeling after eating |
| C2 | Double pleasure without the guilt: whole grain lasagna is not only heavenly delicious, but healthy and nutritious too! |
| C3 | After a hearty whole grain fortified lasagna…no need to worry about weight gain |
| C4 | A whole grain fortified pasta meal comforts and soothes… exactly what you need to manage stress |
| C5 | Feel more self-assured and positive- a whole grain fortified pasta meal fills you up & satiates! |
| C6 | Prepare a whole grain fortified pasta meal…reward yourself after a hard day’s work! |
| Question D: How can the purchase behavior be described? | |
| D1 | No time for ponderous decision-making? Buy whole grain fortified pasta on autopilot…just grab and go! |
| D2 | No need to fret over nutritional content on the label / package… it’s all there…with whole grain fortified pasta |
| D3 | Buy a ready-to-mix sauce…pre-selected for you… to complement your whole grain fortified pasta purchase |
| D4 | Go online: check our healthy & delicious whole grain fortified pasta recipes |
| D5 | On our packaging .. be on the lookout for healthier & easy to prepare recipes for whole grain fortified pasta |
| D6 | Manufacturer offers smaller pack sizes – ingrain that healthy habit … go ahead, try whole grain fortified pasta varieties…economically! |
| Question E: What are the features? | |
| E1 | Whole grain fortified pasta is not always the most palatable taste & texture… a bit grainy |
| E2 | Robust, whole-grain flavor of fortified pasta…MINUS the bloating |
| E3 | Hearty, grain flavored fortified spaghetti…. made from the finest ingredients |
| E4 | Whole grain fortified pasta …a great vehicle for toppings … featuring a mild, neutral taste |
| E5 | Whole grain fortified pasta … not too dark… with that little hint of an earthy/ wheaty tone |
| E6 | Whole grain pasta…a new better taste… but may not go with your traditional tomato sauce! |
| Question F: Describe the personality of the whole grain pasta eater | |
| F1 | Pretty convincing…. for a confirmed whole-grain fortified pasta skeptic |
| F2 | Not particularly convincing… for a confirmed whole-grain fortified pasta skeptic |
| F3 | Love social interactions? Tend to be enthusiastic, verbal, and assertive? Whole-grain fortified pasta boosts YOUR sociability |
| F4 | Like interacting with people and offering your opinions freely? Whole-grain fortified pasta keeps YOU going |
| F5 | Prefer activities that you can do alone or with a close friend, such as reading, reflecting? Whole grain fortified pasta calms you … a positive effect on YOUR mood |
| F6 | Find social gatherings draining after some time? Whole grain fortified pasta reduces daily stress & irritability |
If there is any single aspect of Mind Genomics which can be said to be of major import to the world of knowledge development, that aspect might just be the study using granular messages, rather than the study using generalities, hollowed-out messages, presenting a general idea, but one without a sense of experience, richness and evocative meaning. In other words, the building blocks of Mind Genomics, are ‘cognitively rich.’
Vignettes, combinations of elements as the test stimulus
The respondent reacts to the combinations. The stimulus is presented in simple format, with no attempt to create a coherent picture, and a pleasant reading experience (See Figures 1,2). The Mind Genomics experiment comprises the presentation of disparate pieces of information, pieces which may be joined in the mind of the respondent, pieces which may be concordant or discordant. All the respondent has to do is read and rate the combination, on either one rating scale (Figure 1; Purchase Intent) or on two rating scales (Figure 1 for Purchase Intent; Figure 2 for Price. The typical commissioning professional of the research , the market researcher or the marketer, or product developer, often expresses a desire for fully formed, polished concepts, and just one or two of them, one to be selected as the ‘better’ and presumably (but not directly stated), the ‘best’ of that could be. The Mind Genomics approach flies in the face of that conventional system, presenting combinations of factoids. It is the task of the respondent to roam through the information and assign the rating.
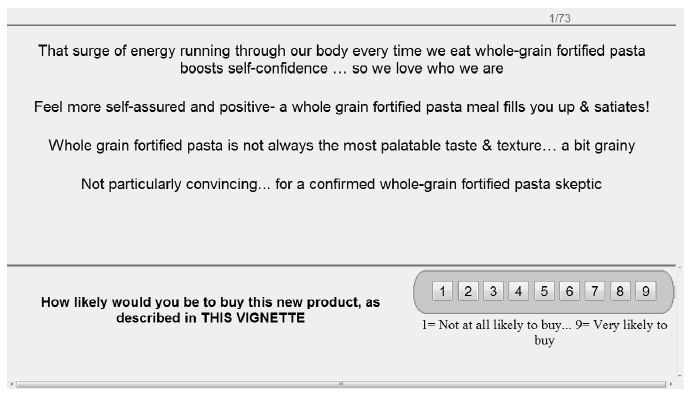
Figure 1: Example of a test combination of elements (vignette) rated on purchase interest

Figure 2: Example of the same test combination of elements, rated on price would pay
Experimental Design of test stimuli
The vignettes are constructed according to an experimental design [8]. The experimental design specifies the combinations to be created for each individual, so-called vignettes. For this study of 6 questions, 6 answers per question, comes to a set of 60 vignettes. The vignettes comprise as few as two elements, and as many as four elements, designed in such a way that each element appears equally often, that the 36 elements are statistically independent of each other, and the number of 2-element, 3-element and 4-element vignettes are always the same across respondents. A permutation scheme [9] changes the specific combinations, on a respondent-by-respondent basis. The combinations for each respondent are different from each other, allowing the Mind-Genomics system to test many of the possible combinations at least once, sometimes twice. This approach differs at its core from the conventional approach in research which selects a limited number of combinations, testing that limited set of combinations many times in to reduce the variability, viz., by averaging.
Both approaches, the Mind Genomics evaluation of many combinations and the conventional many-replicate approaches focus on the same objective – to identify how each element drives the response, doing so by reducing noise. The conventional approach averages out the noise but limits the number of vignettes to what turns out to be very few. The conventional approach assumes that the combinations selected truly provide a ‘good sample’ of the full set of data. I contrast, the Mind Genomics approach allows for a noisy measurement of each point, because each point has only one measurement. However, across many respondents the Mind Genomics study evaluates many of the possible combinations, allowing the pattern to emerge. A good metaphor for the Mind Genomics approach is the ‘MRI of the mind.’
The respondent experience
The respondent is oriented in the evaluation through a simple description, provided more as a formality than as a deep introduction to the topic (Figure 3). The respondent reads the vignette and rates the vignette on two scales, purchase intent and price would pay, defined as shares of stock (Table 2). The respondent rates the vignette on the first, and then the second scale appears. The respondent rates the vignette on the second scale and then next vignette appears. Respondents have no problem sifting through any size vignette, reading what is presented, and making their judgment. Indeed, to the respondent, there is no sense of complete versus incomplete. The vignette is simply a collection of elements to be read as a unity and then rated.
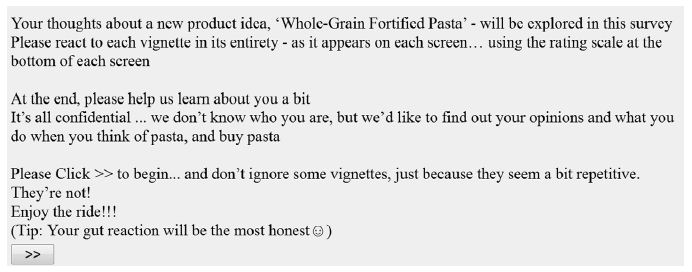
Figure 3: The orientation page, instructing the respondent what to do.
Table 2: The rating scales
| 1. How likely would you be to buy this new product, as described in THIS VIGNETTE |
| 1= Not at all likely to buy… 9= Very likely to buy |
| 2. If a company were to make this NEW product and you had a chance to buy shares in the company, at a special one-time deal of $5.00- a share, how many shares would you purchase, after reading THIS vignette? |
| 1= 0 SHARES 2= 10 SHARES 3= 30 SHARES 4= 50 SHARES 5= 70 SHARES 6= 80 SHARES 7= 100 SHARES |
Prepare data for analysis
Each respondent evaluates 48 vignettes, created from the 36 elements. All elements appear an equal number of times across the48 vignettes. The respondent’s rating is assigned according to a Likert Scale (Rating Scale 1) or in terms of different dollar values (Rating Scale 2). For each respondent and each vignette, the rating scales are transformed prior to analysis by OLS (ordinary least-squares) regression.
a. For rating scale #1 (purchase), the first transformation (TOP3) shows the likelihood of the response ‘I’ll buy this product as described by the vignette.’ The 9-point Likert Scale is transformed to a binary scale, with ratings of 1-6 transformed to 0 to denote either ‘not buy’ or ‘may buy / may not buy.’ Ratings of 7-9 are transform to 100 to denote ‘will probably or definitely buy.’ The transform from a category or Likert scale to a binary scale follows the approach of consumer researchers and public opinion pollsters who find that it is easier for their audiences to understand no/yes, rather than the meaning of say a 6.3 on a 9-point scale.
b. For rating scale #1 (purchase), the second transformation (BOT3) shows the likelihood of the response ‘I will not buy this product as described by the vignette.’ The 9-point Likert Scale is transformed to a binary scale, but ratings of 1-3 are transformed to 100 denoting ‘not buy’ and ratings of 4-9 are transformed to 100, denoting ‘may/may not buy or probably/definitely buy. We will be interested in the elements which drive a respondent away from buying, towards actively rejecting the product. The best way to discover the ‘drivers’ of rejection is to look at the part of the underlying rating scale dealing with active rejection.
c. For rating scale #2 (price), we transform the rating value to the dollars selected. This gives us a sense of how much people are willing to pay.
When we look at the actual data from our 151 respondents, each of whom evaluated the 48 vignettes, we see a distribution in each of these dependent variables. We see that the respondents distribute their ratings on the 9-point scale, and that there quite a number of vignettes which score well, assigned a rating of 7-9 (see Figure 4, left panel). We also see that despite the high ratings of purchase intent, the respondents do not feel that the shares of stock in the company making the product are worth very much (Figure 4, middle panel). Finally, when we plot price of the share on the ordinate versus purchase intent on the abscissa, two measures of acceptance, on involving behavior, the other invoking economics, we see the expected relation between purchase intent (‘I like it more’) and price willing to pay (Figure 4, right panel).
Figure 4 gives a sense of the general type of information provided by data in which the test stimuli have little or no cognitive richness, but are rather test stimuli, the responses to which are measured and summarized. There is little to be gained from an in-depth analysis of the data at this point because the data has little cognitive richness. We can say that the patterns appear to follow one or another structure, but we cannot actually feel that we are entering into the ‘mind’ of the respondent. The researcher could develop a picture of some aspect of the mind of the respondent by looking at the patterns of purchase intent vs price for different groups, such as males versus females, and so forth. The researcher would then learn that for a specific group (to be named after analysis), the respondents in that group are likely to say that they would pay a fair bit MORE for the product as the purchase rating goes from level A to level B, whereas a complementary group would not pay a fair bit more for the same change in purchase rating, from Level A to Level B. As long as one can measure purchase intent and price on many stimuli one can create these graphs for the total panel, for any subgroup, and in turn show differences in pattern, and then hypothesize about what might be responsible for those group-to-group differences in the patterns of the data.
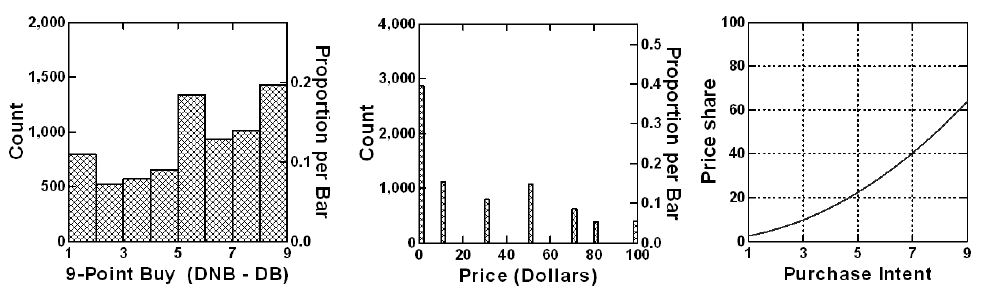
Figure 4: Distribution of ratings for purchase, of price willing to pay, and the ‘smoothed and summarized’ relation between price willing to pay and purchase intent. The data come from the full group of 151 respondents, each of whom evaluated 48 unique vignettes.
The Mind Genomics ‘project’ moves in a deeper direction, putting numbers on the individual elements which constituted the building blocks of the vignettes. The deep goal of Mind Genomics is to put numbers onto these elements, numbers which are meaningful to the respondent and the researcher alike, numbers which tell a story, and shed light on the decision-making process. The cognitively rich array of elements in Table 1 provides the matrix of messages. The nature of the respondent’s mind can be understood a bit more deeply when these different elements have numbers attached to them. When these numbers attached to the elements emerge from behavior rather than from direct evaluation of the elements in a survey, the insight into the mind is even deeper. When the elements compete with each other, the resulting numbers show the ‘drawing power’ of each element.
Transform the data to prepare for regression modeling
The experimental design, creating as it does 48 vignettes for each person, allows for a statistical analysis which relates the presence/absence of the elements to the dependent variable. The data matrix is set up as a set of rows, specifically 48 rows for each respondent, each row corresponding to one of the 48 vignettes. The elements are the columns, 36 columns altogether, one column for each element. For each vignette, a column can either show the value ‘0’ when the element is absent from the vignette, or a ‘1’ when the element is present in the vignette. The next two columns correspond to the actual rating assigned by the respondent. The final three columns correspond to transformed data. The first of the final three columns is labelled TOP3, taking on the value 0 when the rating was 1-6 (viz., not buy or may/may not buy), and taking on the value 100 when the rating was 7-9 (probably/definitely buy). The second of the final three columns is labelled BOT3, taking on the value 100 when the rating was 1-3 (definitely Not buy/probably Not buy), and taking on the value 0 when the rating was 4-9 (might/might not buy, probably/definitely buy). The third and last of the final three columns is labelled PRICE corresponding to the price defined by the number shares x dollars/share. Table 3 shows a portion of the data table, rotated for the sake of space, with the data in the table ready for analysis by OLS (ordinary least-squares.)
The data are now ready for analysis by OLS (ordinary least-squares) regression. The objective is to create a mathematical equation of the form below, the equation showing how each of the 36 elements drives the response. The 36 elements will be the independent variables, the three newly created variables (TOP3, BOT3, Dollar Price) will be the dependent variables. The matrix show in Table 3 is ready for analysis, both at the level of each of the 151 respondents, and at the level of all of the respondents, or some defined subset of the responses.
Table 3: Example of data from the study, along with the transformation, and ready for OLS (ordinary least-squares) analysis
| Vignette |
V1 |
V2 | V3 | V4 | V5 |
V6 |
| A1 |
0 | 0 | 1 | 0 | 1 |
0 |
| A2 |
0 |
0 | 0 | 0 | 0 |
0 |
| A3 |
0 |
1 | 0 | 0 | 0 |
0 |
| A4 |
0 |
0 | 0 | 1 | 0 |
1 |
| A5 |
0 |
0 | 0 | 0 | 0 |
0 |
| A6 |
0 |
0 | 0 | 0 | 0 |
0 |
| B1 |
1 |
0 | 0 | 0 | 0 |
1 |
| B2 |
0 |
0 | 0 | 0 | 0 |
0 |
| ……. | ||||||
| F2 |
1 |
0 | 0 | 0 | 0 |
0 |
| F3 |
0 |
0 | 0 | 0 | 0 |
0 |
| F4 |
0 |
0 | 1 | 0 | 0 |
0 |
| F5 |
0 |
0 | 0 | 0 | 0 |
0 |
| F6 |
0 |
0 | 0 | 0 | 0 |
0 |
| Original Rating | ||||||
| Purchase Int |
3 |
3 | 5 | 3 | 6 |
3 |
| Shares (Select) |
2 |
2 | 2 | 2 | 4 |
1 |
| Transformed Variables | ||||||
| TOP3 |
0 |
0 | 0 | 0 | 0 |
0 |
| BOT3 |
100 |
100 | 0 | 100 | 0 |
100 |
| Dollar Price |
10 |
10 | 10 | 10 | 50 |
0 |
Create individual level models for TOP3, BOT3, and Price, respectively, generating three sets of 151 models or equations, each set comprising 36 coefficients
Each model is an equation of the form: Transformed Rating = k1(A1) + k2(A2) … k36(F36)
The equation is absent the additive constant, viz., goes through the origin. This form of the equation makes it easier to compare coefficients for TOP3 and BOT3. The equation shows us the number of transformed rating points attributed to each element, when that element is included in the vignette. Thus, when the coefficient is + 11, we interpret this to mean that 11 transformed rating points are added to the rating. For the case of TOP3, a +11 means that when the element is incorporated into the vignette, an additional 11% of the respondents will assign the vignette the rating of 7-9. For the case of BOT3, a+11 means that when the element is incorporated into the vignette, an additional 11% of the respondents will assign the vignette the rating of 1-3. Finally, for PRICE, when the coefficient is +11, the incorporation of the element into the vignette will increase the number of dollars by 11.
Create the three models (equations) for the Total Panel
Table 4 shows the coefficients for the 36 elements, sorted by the coefficients for TOP3, interest in purchasing the pasta product. The important thing to observe about Table 4 is the sense of ‘knowing the mind of the respondent,’ simply by knowing the text of the elements. The modeling provides the numbers. It is the numbers which allow us to sort the data and to get a sense of which elements most likely will drive purchase, which elements will prevent purchase, as well as which elements are most valuable versus least valuable. Note that the Mind Genomics output presents what could be an overwhelming volume of numbers. In order to let patterns emerge, Table 4 presents only coefficients of 7 or higher for TOP3 and for BOT3.
Table 4: Coefficients for the three models (TOP3, BOT3, PRICE) for the total panel
|
Coefficients for the Total Panel Model has no additive constant |
TOP3 |
BOT3 |
PRICE |
|
| A1 | Fortified whole-grain pasta contains complex carbohydrates – the “good carbs” which are essential to healthy brain function … boosts your brainpower … keeps you mentally sharp |
12 |
10 |
|
| A2 | Brain friendly complex carbohydrates in fortified whole-grain pasta … low in Glycemic Index. increase mental alertness by releasing glucose |
10 |
9 |
|
| A3 | Iron-fortified whole-grain pasta improves memory and attention…many of us don’t get enough iron in our diet |
8 |
||
| A4 | Fuels the brain through the day…complex carbohydrates are digested slowly…steady glucose supply to the brain cells |
11 |
7 |
8 |
| A5 | Vitamins and anti-oxidants in fortified whole-grain pasta improve brain power & thinking… reduce risk of cognitive impairment |
12 |
10 |
|
| A6 | The carbohydrates in fortified whole-grain pasta supply your body with glucose… favored fuel for your central nervous system |
10 |
7 |
8 |
| B1 | Look good & feel great at any age with a whole-grain fortified pasta diet… delivers plenty of energy & lifelong weight control |
13 |
4 |
11 |
| B2 | That surge of energy running through our body every time we eat whole-grain fortified pasta boosts self-confidence … so we love who we are |
10 |
8 |
|
| B3 | Eat your way to happiness with whole-grain fortified pasta…look & feel attractive! |
11 |
9 |
|
| B4 | Put radiance back into your skin with whole-grain fortified pasta, which helps you sleep better and stop night-time problems |
13 |
7 |
9 |
| B5 | Make your pasta whole-grain fortified, providing plenty of fiber …feel full and stay in a positive frame of mind all day! |
10 |
9 |
|
| B6 | Stop feeling tired, eat whole grain fortified pasta for extra stamina …no need to cancel your evening plans anymore! |
12 |
10 |
|
| C1 | A filling whole grain fortified pasta serving…stops that regretful feeling after eating |
10 |
7 |
|
| C2 | Double pleasure without the guilt: whole grain lasagna is not only heavenly delicious, but healthy and nutritious too! |
12 |
10 |
|
| C3 | After a hearty whole grain fortified lasagna.no need to worry about weight gain |
12 |
10 |
|
| C4 | A whole grain fortified pasta meal comforts and soothes. exactly what you need to manage stress |
11 |
9 |
|
| C5 | Feel more self-assured and positive- a whole grain fortified pasta meal fills you up & satiates! |
11 |
9 |
|
| C6 | Prepare a whole grain fortified pasta meal… reward yourself after a hard day’s work! |
8 |
||
| D1 | No time for ponderous decision-making? Buy whole grain fortified pasta on autopilot…just grab and go! |
7 |
7 |
|
| D2 | No need to fret over nutritional content on the label / package. it’s all there…with whole grain fortified pasta |
7 |
||
| D4 | Go online: check our healthy & delicious whole grain fortified pasta recipes |
11 |
8 |
|
| D5 | On our packaging … be on the lookout for healthier & easy to prepare recipes for whole grain fortified pasta |
7 |
||
| D6 | Manufacturer offers smaller pack sizes – ingrain that healthy habit … go ahead, try whole grain fortified pasta varieties…economically! |
8 |
||
| E2 | Robust, whole-grain flavor of fortified pasta…MINUS the bloating |
8 |
6 |
6 |
| E3 | Hearty, grain flavored fortified spaghetti… made from the finest ingredients |
11 |
8 |
|
| F1 | Pretty convincing…. for a confirmed whole-grain fortified pasta skeptic |
8 |
7 |
|
| F4 | Like interacting with people and offering your opinions freely? Whole-grain fortified pasta keeps YOU going |
10 |
7 |
8 |
| F5 | Prefer activities that you can do alone or with a close friend, such as reading, reflecting? Whole grain fortified pasta calms you …a positive effect on YOUR mood |
8 |
10 |
6 |
| F6 | Find social gatherings draining after some time? Whole grain fortified pasta reduces daily stress & irritability |
9 |
7 |
|
| D3 | Buy a ready-to-mix sauce.pre-selected for you… to complement your whole grain fortified pasta purchase |
8 |
7 |
6 |
| E4 | Whole grain fortified pasta .a great vehicle for toppings … featuring a mild, neutral taste |
7 |
8 |
6 |
| E5 | Whole grain fortified pasta ..not too dark…with that little hint of an earthy/ wheaty tone |
7 |
8 |
6 |
| F3 | Love social interactions? Tend to be enthusiastic, verbal, and assertive? Whole-grain fortified pasta boosts YOUR sociability |
12 |
5 |
|
| E6 | Whole grain pasta…a new better taste. but may not go with your traditional tomato sauce! |
14 |
2 |
|
| F2 | Not particularly convincing… for a confirmed whole-grain fortified pasta skeptic |
14 |
2 |
|
| E1 | Whole grain fortified pasta is not always the most palatable taste & texture… a bit grainy |
23 |
Highest TOP3: Look good & feel great at any age with a whole-grain fortified pasta diet… delivers plenty of energy & lifelong weight control
Highest BOT3: Whole grain fortified pasta is not always the most palatable taste & texture… a bit grainy
Highest PRICE: Look good & feel great at any age with a whole-grain fortified pasta diet… delivers plenty of energy & lifelong weight control
As we read through the data in Table 4 it is no necessary to accept or reject hypotheses. Mind Genomics presents us with a list of the different elements, and their scores. There is no necessity to begin with any hypothesis that must be falsified. There may be absolutely no prior knowledge at all about healthful pastas, in which case these would be the results from the pioneering efforts. The real thinking can now begin, to look at the winner versus the losers, and create grounded hypotheses, results from simple experiments. Furthermore, the experiment will provide a great deal of additional knowledge and insight, as we soon will see in the subsequent sections.
Divide the 151 respondents into three complementary mind-sets, based upon the pattern of coefficients for a dependent variable
The division into three mind-sets was done in order to compare the nature of mind-sets for TOP3, BOT3, and PRICE, respectively. The three sets of coefficients give us a sense of how the 36 elements drive positive interest in purchase (TOP3), drive negative interest in purchase (BOT3), and drive price that would be paid (PRICE).
Quite often there is an assumption that people differ in what they like, and so the respondents are divided by convenient geo-demographic data such as gender, age, where the respondent lives, and so forth. Occasionally the respondents are divided by what they say they feel to be important (e.g., taste versus price versus convenience versus health), such information obtained by an additional questionnaire administered at the time of the evaluation. A third and equally common way to divide the respondents is by what they say they have done, either in consumption or in purchase. All three ways of dividing people end up showing differences in the pattern of responses to the elements, but the patterns are quite noisy, and the underlying ‘story’ is hard to discern. It is not clear whether the variation is noise, or a weakly attenuated signal. What is clear, however, is that WHO A PERSON IS DOES NOT PREDICT HOW A PERSON RESPONDS TO SPECIFIC MESSAGES.
Once the coefficients are created for a variable, e.g., TOP3, we use clustering to divide the 151 respondents into exactly three groups. The choice of three groups is done by fiat, to divide the respondents into ‘fine grained groups,’ not too many and not too few. The clustering is done by minimizing the ‘distance’ between pairs of respondents within a cluster, based upon a measure of distance (D = (1-Pearson Correlation)), with the distance based upon the coefficients. Two respondents whose 36 coefficients show the same exact pattern of responses to the messages, generate a Pearson Correlation of +1, and a distance between then of 0 (D = 1-1 = 0). In contrast, two respondents whose 36 coefficients show precisely opposite patterns of responses generate a Pearson Correlation of -1, and a distance between them of 2 (D = 1 – – 1 = 2).
We run the separate k-means clustering program separately for each of the three sets of coefficients [10]. These three separate analyses each generates its own group of three mind-set. The three mind-sets for each of the three dependent measures (TOP3, BOT3, PRICE) need no necessary relation to each other. For example, two respondents falling into the same mind-set for one dependent variable (e.g. TOP3) need not fall into the same mind-set for the other dependent variables (e.g. BOT3 and PRICE, respectively).
Once we define the mind-sets for each dependent variable, we then run three regressions, again without the additive constant, one regression equation for all the data from Mind-Set1, a second regression for all the data from Mind-Set2, and finally a third regression for all the data from Mind-Set3.
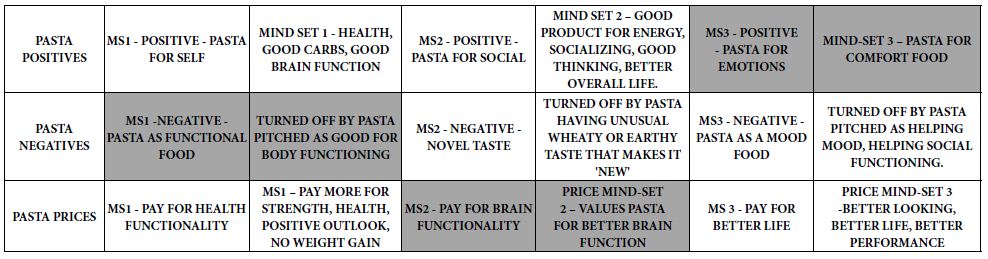
Themes of the mind-sets. Our first analysis of the mind-sets considers the themes. There are really three themes: Brain function, Life performance, and Pasta as food, respectively. Each general theme is positive for some mind-sets and negative for others. The elements were all written as positive descriptors, so the negatives come from people’s dislike of the content of the message, not from the structure of the message.
Brain function
TOP3 Mind Set 1 – Good brain function
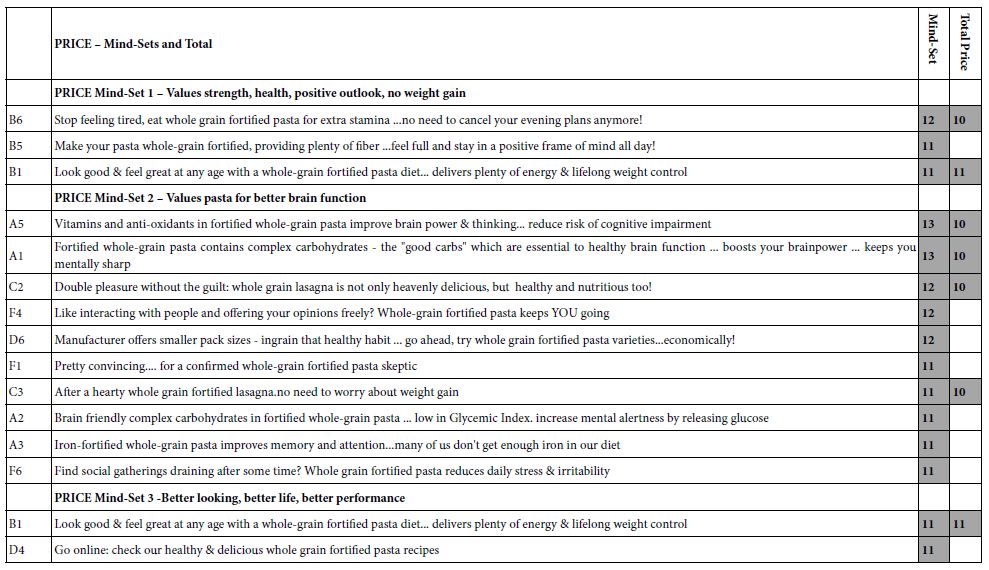
PRICE Mind-Set 2 – Values pasta for better brain function
Life performance
TOP3 Mind Set 2 – Good product for energy, socializing, good thinking, better overall life.
PRICE Mind-Set 3 -Better looking, better life, better performance
PRICE Mind-Set 1 – Values strength, health, positive outlook, no weight gain
BOT3 Mind-Set 1 – Turned off by pasta seen as a functional fuel for behavior
BOT3 Mind-Set 3 – Turned off by pasta for mood
Comfort food
TOP3 Mind-Set 3 – Pasta as comfort food
BOT3 Mind Set 2 – Turned off by novel taste, wheaty
Strong performing elements in the three mind-sets
Mind Genomics studies generate a great deal of data, results which are interesting in and of themselves because the test stimuli are meaningful. In the interests of clarity and space, the mind-set data will be reduced to show only the strong performing elements for the specific mind-set, and the performance of those strong performing elements for the Total Panel as well. In the interests of simplicity, we now present only those elements with coefficients of +10 or higher.
The data appear in Table 5 (TOP3), Table 6 (BOT3), and Table 7 (PRICE), respectively. The strong performing elements are shown in shaded cells. It is not necessary to go through each table, but rather simply look at the name assigned to the mind-set to get a sense of the commonality. The names themselves, however, are not what is important. Rather, it is the membership of the individuals in the mind-set and the nature of the commonality in the mind-set, which commonality may or may not be simple to discover. The fact that the study focused on what might be considered a ’micro-topic,’ healthful pasta may be the cause both of richness of information about the micro-topic, but also harder-to-name subsets of this micro-topic, which is quite unified to begin with.
Table 5: Coefficients for TOP3 by mind-set and total panel. Only the strong performing elements for the mind-sets are shown
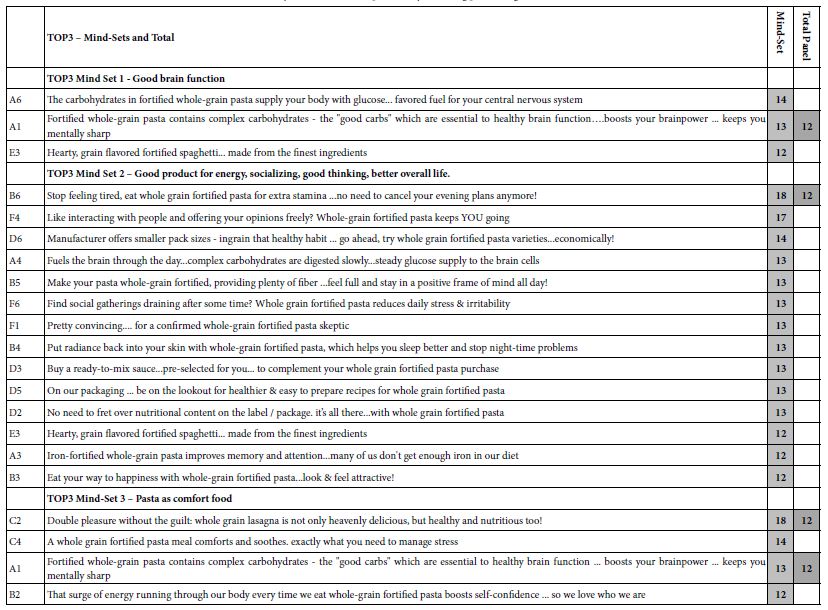
Table 6: Coefficients for BOT3 by mind-set and total panel. Only the strong performing elements for the mind-sets are shown.
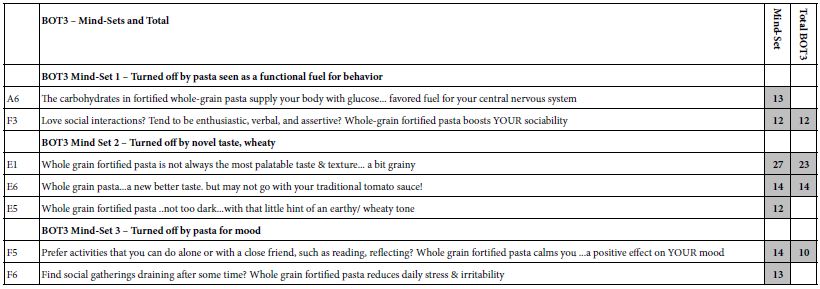
Table 7: Coefficients for PRICE by mind-set and total panel. Only the strong performing elements for the mind-sets are shown.
The surprising resilience of cognitive economics patterns – price vs purchase (TOP3)
Figure 4 above suggests a monotonic increasing function of PRICE versus rated purchase intent on the 9-point scale. The underlying data is a scattergram from all of the respondents. The curve shows the smoothed relation, estimated by the smoothing function of the Systat statistical analysis program [11]. The pattern makes intuitive sense; for healthful pasta people say that they would pay more for a product that they like.
The same analysis can be done for the data from the three groups of mind-sets, derived in term from TOP3, from BOT3, and from PRICE, respectively. Figure 5 shows these nine smoothed curves. Again, Purchase Intent refers to the 9-point rating scale, Price refers to the dollars, and the data contain all the vignettes for the relevant mind-set. What is remarkable about Figure 5 is the dramatic similarity of the patterns, no matter how the respondents are divided. There may be slight variation, but the patterns are almost identical.
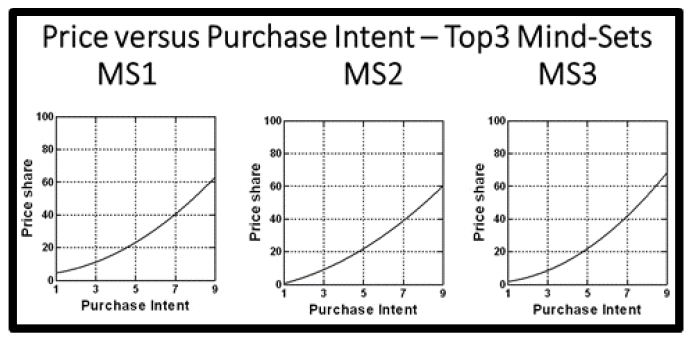
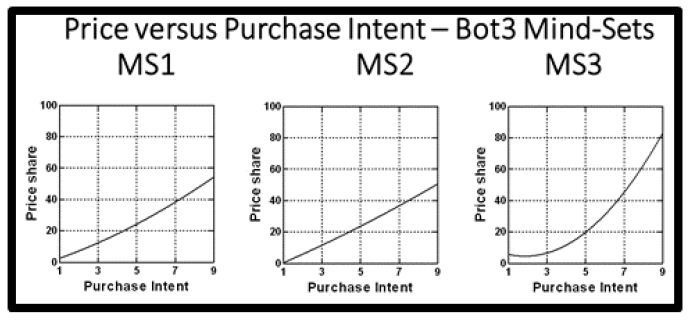
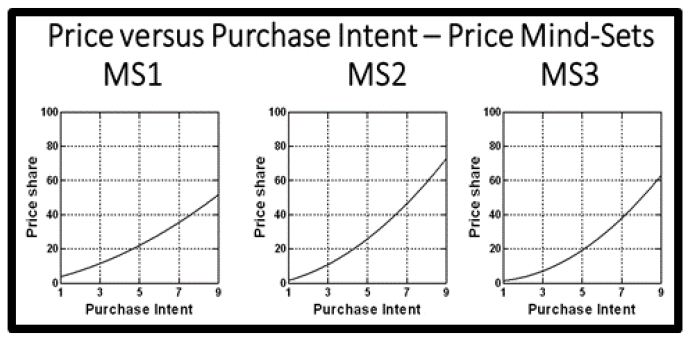
Figure 5: Relation between Price willing to pay (ordinate) and 9-point rating of purchase (abscissa), for three dependent variables (TOP3, BOT3, PRICE), each generating three mind-sets. The curves emerge from smoothing the raw data to show the underlying pattern.
Finding these mind-sets in the population
One of the hallmarks of Mind Genomics is that the mind-sets distribute in apparently random ways through the population, a fact which disturbs the traditional researcher searching for a co-variation between HOW THE PERSON THINKS ABOUT A TOPIC (the mind-set) and WHO THE PERSON IS, OR WHAT THE PERSON DOES, OR EVEN THE PERSON’S GENERAL ATTITUDES (GENERAL PSYCHOGRAPHICS.) In only very rare cases do we find strong co-variation between the mind-sets and other factors about a person. We should not be surprised at this lack of co-variation. The old adage ‘birds of a feather flock together’ does not seem to hold true when we focus on the deep variation between people on a topic, even people living in the same household. People may share some general attitudes, but it is rare, if ever, to find two people who agree completely on the granular aspects of any topic.
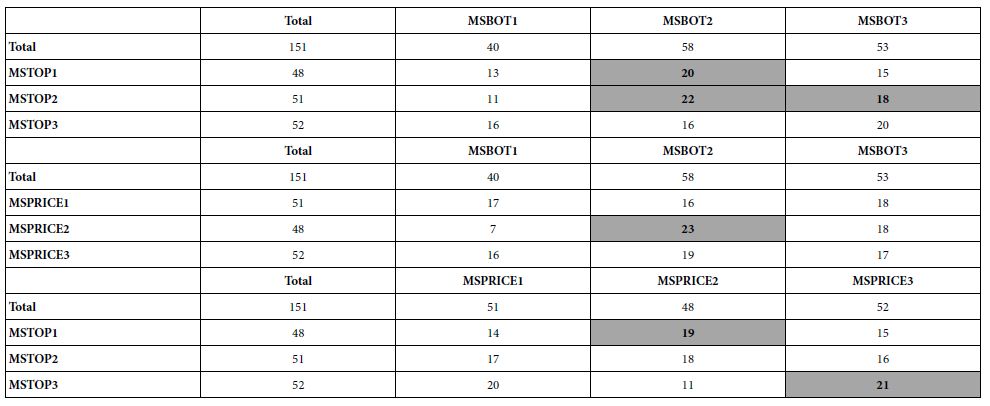
Table 8 shows the distribution of the three mind-sets for each dependent variable in terms of total, gender, age, and where the person lives. Table 9 shows the cross-tabulation of the mind-sets. Any value greater than 40% of the total panel is darkened. For example, there are 68 males. We would expect an equal 1/3 distribution, of 23,23,23 for the three mind-sets. We have chosen the 40% cut-off as worthy of note. Thus, for 68 respondents, 40% means more than 27.2 respondents. We round to the lower whole number (27). It Is clear from both tables that knowing a person’s membership in either a geo-demographic subgroup (Table 8) or in a mind-set (Table 9) does not allow us to easily predict the person’s membership in any other type of mind-set.
Table 8: Cross-tabulation of membership in gender, age, and residence by respondents in the total panel, and in the three groups of three mind-sets each. There is no clear pattern.
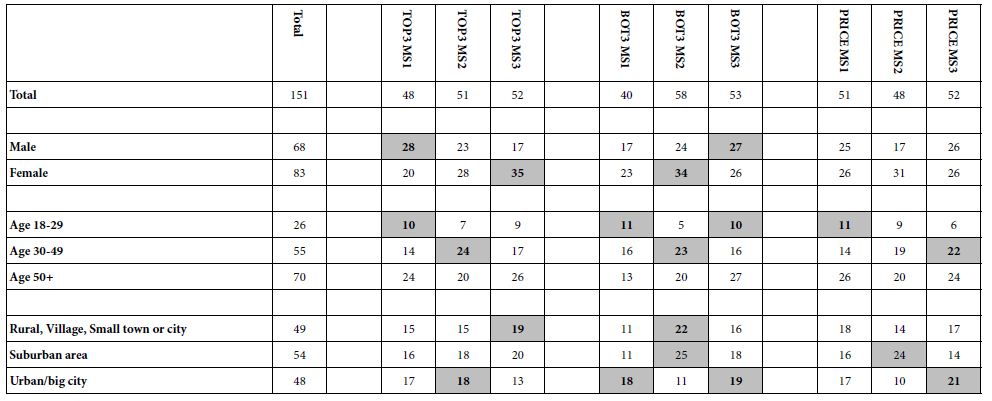
Table 9: Cross-tabulation of membership in the three groups of three mind-sets each. There is no clear organizing pattern allowing prediction of mind-set membership from knowledge of other mind-set membership.
Predicting the profile of mind-set memberships using the PVI (personal viewpoint identifier)
During the past four years it has become increasingly obvious to authors Moskowitz and Gere that the practical applications of Mind Genomics would increase in number and scope when one could move beyond the limited number of respondents and apply the mind-set ‘clustering’ or ‘segmentation’ to the world at large.
Initial observations of how researchers were using segmentation revealed that the segments emerging from typical studies were very large, very general, and lacking the granularity. The typical segmentation appeared to emerge from the top down, so that one could divide people into general personas. The division would be made on the basis of questionnaires about general topics, leading to a limited number of personas, general groups of people [2][12][13]
The segmentation made interesting reading, the personas were described in detail, but there was no clear way to link these personas to the specific topic, especially when the topic is so granular as healthful pasta, and more so when the topic does not yet even exist.
Traditional segmentation is interesting, but really inactionable at the granular level simply because the segmentation is created with general propositions in mind, not with respect to a specific product. In a deep philosophical sense, one might say that traditional segmentation is imbued with sociology, organizing the world at large, the ‘nomothetic,’. In contrast, Mind Genomics segmentation is imbued with psychology, organizing the response to a granular topic, focusing on the individual, the ‘idiographic’.
In order to make the Mind Genomics segmentation more usable the analogy used is that Mind Genomics segmentation discovers groups of ‘mental primaries’, and not groups of people. The research would reveal these primaries, combinations of ideas, as shown by the three groups of mind-sets. Those mind-sets would be primaries, like color primaries. One needs a tool, a mental colorimeter, as it were, to assign a new person to one of these three primaries. With three sets of mind-sets, one for each dependent variable, the tool would have to assign a new person to one mind-set for each dependent variable.
The approach to create these assignments uses Monte Carlo simulation of the data, with 20,000 iterations. In the actual study, there were three such PVI’s created, one for each of the three dependent variables. The objective was t create a six-question tool for each dependent variable. The six questions are taken from the 36 elements used to create the mind-set segmentation for the dependent variable. The six questions are answered on an anchored, two-point scale. With six questions and a two-point scale, the PVI questionnaire generates exactly 64 combinations. Each combination links with one of the relevant three mind-sets.
Figure 6 shows the introduction to the PVI. The respondent simply presses a link, and is taken to the introduction, which requests participation and then background information. The information will be stored in a database for later use.
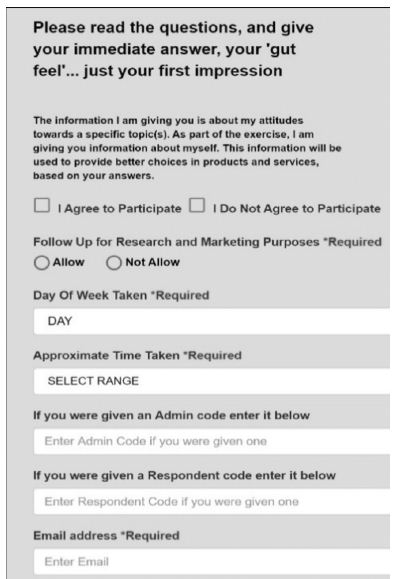
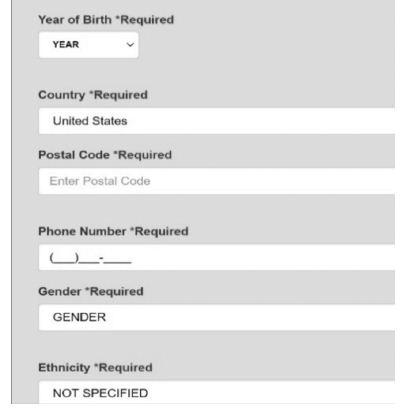
Figure 6: Introduction to the PVI, showing the request for permission and for background information. As of this writing (Summer, 2020) the link is:
https://www.pvi360.com/TypingToolPage.aspx?projectid=215&userid=2018
Figure 7 shows the actual PVI, with three sets of six questions. Each respondent will receive the same PVI, but the order of PVI’s will be randomize across respondents, as will the order of questions within each PVI. With three PVI’s, one per dependent variable, there are six orders of the PVI’). Second, within each PVI, the order of the questions will be randomized. For each PVI there are 6! Orders of questions, i.e., 6x5x4x3x2x1 or 720 orders
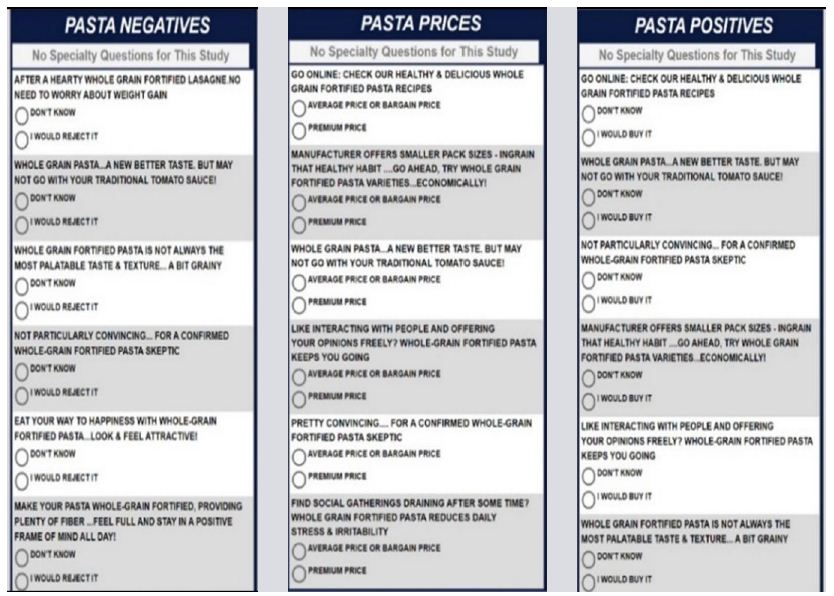
Figure 7: The actual PVI, for the three dependent variables.
Finally, Table 10 shows an example of feedback for a respondent, who completed the three PVI’s. The segment membership and the feedback are shown by the shaded cells. The researcher has the option to provide no feedback at all, to provide mind-set membership, or provide mind-set membership, feedback as well as information about the segments to which the respondent does not belong!
Table 10: Feedback for one respondent based upon pattern of answers to the three PVI’s. The shaded cells show the mind-set to which the respondent belongs, and the feedback for that mind-set.
Discussion and conclusions
When the topic of healthful pasta was first proposed some years ago and the study run (late 2012), the notion of Mind Genomics as a cartography was in its infancy. The research objective at the time was to determine what specific messages pertaining to pasta would prove to be most compelling. The effort at that time, only nine years ago, was to explore messaging, with the objective that here was a tool, Mind Genomics, which could provide a great deal of deal on many alternative messages. Up to then, the conventional wisdom was either to test single messages (so-called promise testing) or test fully formed concepts, polished, dense paragraphs, presenting a few ideas in a well-executed, almost seamless package. The idea was novel — discover through systematic experimental design powerful albeit mind-set specific messages.
When one looks at the richness of the data, the first question which emerges is ‘what do these data tell us about good carbs, or healthy pasta?’ This first question is the scientific aspect. The second question is ‘how do I use these data to help people enjoy a healthier diet’. The third question is ‘how do I used these data for commercial purposes.’ There are other questions of a research nature, such as ‘why do people fall into the mind-sets they do,’ ‘why is the price-purchase intent curve so similar across mind-sets,’ and the ever-recurring question ‘are these mind-sets stable, and does a person person’s mind-set ever change?’
What do these data tell us about good carbs?
This first question is answered by an abundance of data. The elements below are the strong performing elements. Rather than working with one theme at a time, and either saying that theme (e.g., brain power) is important or not important, Mind Genomics works with many themes. Thus, the information which emerges is far richer, a landscape of information rather than a single image, a single idea. The notion of the cartography, the landscape, is dramatically different from the more traditional, focused, hypothetico-deductive system, which considered one hypothesis or theme at a time, and through experiment attempting to falsify it [14] In Mind Genomics, the effort is to explore a broad landscape, not investigate each location off the landscape in a sequence of seemingly disconnected experiments, only later put together by a met-analysis
In terms of specifics, here are promising messages.
Look good & feel great at any age with a whole-grain fortified pasta diet… delivers plenty of energy & lifelong weight control
Put radiance back into your skin with whole-grain fortified pasta, which helps you sleep better and stop night-time problems
Stop feeling tired, eat whole grain fortified pasta for extra stamina …no need to cancel your evening plans anymore!
Vitamins and anti-oxidants in fortified whole-grain pasta improve brain power & thinking… reduce risk of cognitive impairment
Fortified whole-grain pasta contains complex carbohydrates – the “good carbs” which are essential to healthy brain function … boosts your brainpower … keeps you mentally sharp
Double pleasure without the guilt: whole grain lasagna is not only heavenly delicious, but healthy and nutritious too!
After a hearty whole grain fortified lasagna.no need to worry about weight gain
How do I use these data to help people enjoy a more healthful diet?
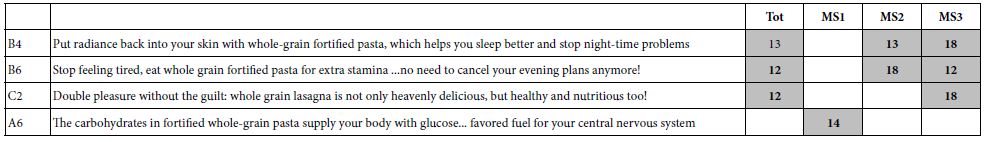
A growing issue in today’s world is the unhealthiness of the diet, the growing issue of obesity, and the need to create a better way to eat so that obesity and diet-related diseases such as diabetes do not ravage our society. The discovery of strong performing messages allows those who communicate about healthful living to discover ‘what to say’ and ‘what not to say.’ One might surmise that any nutrition professional would know what to say, and that the information shown. Nutrition professionals know the science behind the food but may not know what messages convince. Indeed, as Table 11 shows, what appeals to the total panel may appeal strongly to only some of the respondents, and not to others. It is here that the PVI, the personal viewpoint identifier, emerges with the power to assign a new person to a mind-set, and thus know at the start of the relationship with that new person the kinds of messages that will resonate.
Table 11: Strong performing messages may appeal to the total without appealing to all mind-sets or may appeal strongly to only one mind-set.
Are there ‘rules’ about how many mind-sets exist, and does a person’s mind-set change over time?
As Mind Genomics experiences increasing application, with more studies and more situations, questions of the number of mind-sets emerge, as well as the invariance of a mind-set. There is no fixed n umber of mind-sets. Each topic can be investigated in depth, to generate an array of different mind-sets. Unlike basic colors, of which there are only three (red, yellow, blue), mind-sets emerge for virtually any topic where decisions are made on the basis of information. This study on good pasta shows one can take one topic and ‘drill down’ to create at least three mind-sets. There are smaller topics within good pasta, such as brain function, which themselves can generate mind-sets. As for the invariance of mind-sets over time for a single person, that question remains a topic for the next generation of investigators.
Acknowledgement
Attila Gere thanks the support of the Premium Postdoctoral Researcher Program of the Hungarian Academy of Sciences
Reference
- Barry J, Weinstein A (2009) Business psychographics revisited: from segmentation theory to successful marketing practice. Journal of Marketing Management25: 315-340.
- Brower M (2018) Claritas (formerly Nielsen) Segmentation and Market Solutions. The Charleston Advisor. 18: 15-20.
- Shelke K (2016) Pasta and Noodles: A Global History. Reaktion Books.
- Webb D (2019) Pasta’s history and role in healthful diets. Nutrition Today. 54: 213-220
- Moskowitz HR (2012) ‘Mind genomics’: The experimental, inductive science of the ordinary, and its application to aspects of food and feeding. Physiology & behavior107: 606-613. [crossref]
- Moskowitz HR, GofmanA Beckley J, Ashman H (2006) Founding a new science: Mind genomics. Journal of sensory studies. 21: 266-307.
- Moskowitz HR, Gofman A (2007) Selling Blue Elephants: How to Make Great Products that People Want Before They Even Know They Want Them. Pearson Education
- Box GE, Hunter JS (1961) The 2 k—p fractional factorial designs. Technometrics. 3: 311-351
- Gofman A, Moskowitz H (2010) Isomorphic permuted experimental designs and their application in conjoint analysis. Journal of sensory studies. 25: 127-145.
- Jain AK, Murty MN, Flynn PJ (1999) Data clustering: a review. ACM computing surveys (CSUR). 31: 264-323.
- Wilkinson L (2010) Systat. Wiley Interdisciplinary Reviews: Computational Statistics. 2: 256-257.
- Kahle LR (1986) The nine nations of North America and the value basis of geographic segmentation. Journal of Marketing 50: 37-47.
- Wells WD (1975) Psychographics: A critical review. Journal of marketing research12: 196-213.
- Lakatos I (1976) Falsification and the methodology of scientific research programmes. In Can theories be refuted? (pp. 205-259). Springer, Dordrecht.