Abstract
We present a cartography of how people respond to statements about corruption in the use of public funds, using the procedures of Mind Genomics. Respondents read and rated short vignettes about corruption, systematically varied in four aspects, specifically who is IN CHARGE, FOR WHAT is the public money used, WHAT HAPPENED, and what were the EFFECTS, respectively. The data suggest that different elements drive ‘Makes me Angry,’ versus ‘Drives me to do Something’ versus ‘Engages my Attention.’ Mind Genomics further reveals mind-sets, showing different criteria that respondents used to evaluate the individual messages. The paper then shows how to assess the interactions between who is IN CHARGE and the other attributes, and how to measure the degree to which the ‘right person’ can reduce the seriousness of the corrupt act.
Introduction
As we continue apace into the 21st century, now in 2020, we can recognize that the brave new world of tomorrow looks a lot like the brave new world of yesterday. Technology may have given more capabilities to more people, but we remain ever aware that the human condition is filled with behaviors that we would call unethical. Over the centuries the sins that we commit stay the same, whether sins of lust, avarice, theft, murder, and so forth [1]. The situation changes, but people do not. Indeed, the French proverb has never been as true as it is now ‘The more things change the more they remain the same.’ We deal here with the response to the notion of corruption. There is an extensive legal literature, an extensive sociological literature, an extensively moral and ethics literature, as well as literatures in specific field, all deal with aspects of corruption of one or another sort. References abound. There is no need to quote the literature; it is simply gargantuan. One need only look at the number of different papers dealing with corruption, as indexed by Google Scholar®. Table 1 gives a sense of the enormity of the literature.
Table 1: ‘Hits’ in Google Scholar® as of February 2020
|
Corruption in |
Number of Hits |
|
Education |
1,503,000 |
|
Public Works |
1,220,000 |
|
Public Funds |
1,070,000 |
|
Taxation |
498,000 |
|
Corporate Governance |
468,000 |
|
Medicine (Funds) |
180,000 |
|
Military Procurement |
58,600 |
A review of the literature through Google Scholar reveals many different aspects to the investigation of corruption, as well as a long and venerable history. Corruption is not new, but rather as old as society. One might think, of course, that in the state of nature as posited by Swiss philosopher Jean Jacques Rousseau [2] there might not have been corruption, but putting philosophy aside, all philosophers and students of society recognize the inimical nature of misusing public resources for private and person gains. Some, however, go so far as to investigate whether in the end the ‘invisible hand’ so promoted by Adam Smith, might work to make good the evil that corruption produces [3, 4]. The focus of this paper and its contribution is on the evaluation of the seriousness of corruption from the point of view of the average citizen. We focus here specifically on the misuse of public resources by of different kinds, by different types of people. Can we understand what is perceived to be important by different people? Can we understand how the perception of corruption can be reduced by identifying different people doing corrupt act? And finally, can we find out the types of corruption to which people ‘pay attention’, i.e., raise eyebrows, but really manifest themselves by holding the respondent’s interest. As we will see, not all corruption is equally ‘interesting;’
There is little, however, in the way of a psychological analysis of people who are confronted with the facts of corruption. There are, of course, no lack of information about reactions to corruption. One need only listen to the vox populi, the voice of the people, on a daily basis to hear allegations of corruption, emotional reactions to such allegations, and hypotheses about who is doing ‘what,’ and why, leading to the corruption. Despite the voluminous detail about corruption as a legal and societal topic, and corruption as a topic for the news and gossip columns, there appears to be a paucity of experiments on the person, subjective reaction to corruption. The focus of this paper is on corruption with the psychology of the everyday, those quotidian reports of corruption in different situations. If we were to put this paper into the context of history and academic literature, the paper falls into the group of papers dealing with the psychology of corruption, rather than the sociology of corruption. The paper complements and augments efforts to understand corruption, papers that we would call ‘methodological’ rather than substantive. Examples of these papers abound, with the topics united by a search for method, but diverse in the specific areas, such as governmental corruption [5], organizational corruption [6] criminal corruption [7], or political corruption [8]. Zaloznaya has put it best in the title of a recent paper ‘The social psychology of corruption: Why it does not exist and why it should [9].”
The Mind Genomics ‘cartographic’ process to explore and map a topic
Mind Genomics is an emerging science, a branch of experimental psychology dealing with the psychology of the ordinary, of the everyday [10, 11]. Mind Genomics has roots in experimental psychology itself, especially when studying consideration time (response time), as well as roots in statistical experimental design [12], and in consumer research. The objective of the research is to understand how people make decisions in the ordinary events of their lives. As such, the topics are not specific, often artificial, non-representative situations designed to reveal a phenomenon. Rather, the study is designed as a step to create of a library of understanding of behavior, metaphorically mapping the mind of people, and the alternative ways that make their decisions in the same topic area (here corruption). The easiest way to understand Mind Genomics is through a worked research example, with real data, dealing with a meaningful problem. Our topic in this paper is the misallocation, or really misappropriation of public funds by various individuals. The question was posed by senior author CHL as one of the topics of her personal ongoing study of today’s society and the change of values. Mind Genomics proceeds by a series of steps, in a systematic manner to map out an area of human thinking or human behavior. We call the approach a ‘cartography’ because there is no underlying hypothesis of ‘what exists,’ and/or what should happen. Rather, Mind Genomics presents the information in a systematized form, and uses mathematical modeling to relate the information given (acts by people, and their results) to judgments. The structure which emerges give a sense of how people ‘think’ about relevant problems, in this case issues involved in the misallocation of community funds designated for certain projects of a societal nature.
Step 1 – Select the topic, the four questions, and the four answers to each question: The topic here is the misallocation of public funds by individuals in power. The four questions are shown in Table 2, each followed by the four answers to that question. In the actual experiment the respondent does not see the full question, although as Table 2 shows, part of the question is embedded in the answer to make the experiment easier. Since the Mind Genomics method is inexpensive, easy, and fast, it lends itself to iterative experiments, each taking no more than a few hours. Consequently, the questions and the answers need not be the correct ones. The researcher can repeat the experiment for several iterations, until the questions and the answers make sense, and are exactly on target, at least from the point of view of experts in the topic area.
Table 2: The four questions, and the four answers to each question
|
Question A: Who is person in charge of making the decision? |
|
|
A1 |
In charge: wealthy businessperson |
|
A2 |
In charge: member of traditional ruling class |
|
A3 |
In charge: woman director from a local school |
|
A4 |
In charge: well-known & successful actor |
|
Question B: What is money used for? |
|
|
B1 |
Purpose: money to fund student education programs |
|
B2 |
Purpose: money to fund environment safety & sustainability |
|
B3 |
Purpose: money for hospitals, schools, roads |
|
B4 |
Purpose: money to maintain citizen health |
|
Question C: What happened? |
|
|
C1 |
Event: money simply disappears. |
|
C2 |
Event: money redirected to ‘new uses’ by controlling ‘inner circle’ |
|
C3 |
Event: call vote to redirect money to new use |
|
C4 |
Event: land sold, money directed to payoff ‘newly discovered ‘ government obligations |
|
Question D: What was the effect? |
|
|
D1 |
Effect: people demonstrate to demand politicians and government should act with morals |
|
D2 |
Effect: people are what’s happening — rush to grab their portion … Me First Mentality |
|
D3 |
Effect: economy stagnates, young people leave in droves |
|
D4 |
Effect: demoralized angry people who are angry at growing gap between rich & poor |
Step 2 – Create the response rating: For this study we considered two different responses, become angry, and prompted to do something. The 5-point rating scale comprised two statements in a single rating, either be angry (no, yes), do something (no, yes). The lowest point on the scale was ‘irrelevant.’
The actual instruction was simple: Please read the whole screen & type the number which shows how you feel
1=No idea what to do…
2=Not angry … Will do nothing
3=Angry …Will do nothing…
4=Not angry … Will work actively to make change.
5=Angry … Will work actively to make change
Step 3 – Send out an invitation to respondents to participate : The participants were part of the Luc.id panel, comprising 29+ million respondents in the US and many more world-wide. These respondents are incentivized to participate.
Step 4 – Present 24 vignettes as the experiment: When a respondent opts in to participate, the respondent receives 24 vignettes, one vignette at a time, the vignettes created according to a recipe book, or experimental design [13]. Each vignette comprises at most one answer from a question, but many vignettes are lacking answers from one or two questions, so the vignettes range from two elements (answers) to four elements. The respondent reads each of the 24 vignettes, and for each vignette assigns a rating on the above-shown 5-point scale. The task takes no more than 5–7 second for each vignette. Each respondent evaluates a totally unique set of combinations. It is rare in a sample of 50 respondents, each respondent evaluating 24 vignettes, (total of 1200 vignettes) to encounter more than one-two vignettes which are repeated. The combinations are selected to be permutations of each bother, but also to share no vignettes in common. The scientific rationale is to cover as many combinations as possible, even with ‘noise’, a sharp contrast to the standard way of testing a limited number of combinations but testing them with many respondents in order to reduce ‘noise.’ To distinguish Mind Genomics from conventional research we can say that Mind Genomics looks for the for the general pattern, which emerges clearly from the noise. Conventional research cannot find underlying general patterns because the strategy for conventional research is to measure with precision, and not with scope.
Step 5 – Create four new variables in place of the single 5-point rating scale
Not Angry: Ratings 1, 2, and 4 become 100, ratings 3 and 5 become 100
Angry: Ratings 3 and 5 become 100, ratings 1,2 and 4 become 0
Would not take action: Ratings 1 and 2 and 3 become 100, ratings 4 and 5 become 0
Would take action: Ratings 4 and 5 become 100, ratings 1,2 and3 become 0
Each respondent thus generates a vector of four new numbers, one number for each of the four new variables. A person can either be Not Angry or Angry, but not both. A person can be promoted now to take no action or to take action, but not both. The value of each of these four new variables is completely determined by the one rating assigned by the respondent, using the 5-point scale. As a standard practice, we want to avoid the situation where an individual’s ratings for all 24 vignettes are either 100, or 0, based upon the transformation of the original 1–5 rating scale. In that unfortunate case, viz., when all 24 vignettes have the same value, the analysis program (OLS, ordinary least-squares regression) will ‘crash’, returning the disheartening but appropriate statement ‘your dependent variable has no variance.’ We avoid this statistical problem by adding a very small positive number to each newly created value. We add a very low random number
(< 10–5) to each newly created binary answer, 0 or 100. Now, each respondent has four numbers, corresponding to the four newly created variables, all numbers around 0 or 100, but not exactly 0 or 100. This prophylactic action prevents the regression program from crashing.
Step 6: Invite respondents to participate: The panelists came from a pool of respondents who had previously agreed to participate in these studies. The respondents were provided by Luc.id, Inc., the on-line panel provider which has provided panels for numerous previous Mind Genomics studies. Luc.id takes care of the invitation, the remuneration for participation, and complies with the privacy issues, shielding the respondent from being identified, except with respect to gender and age.
Step 7: Orient the respondent: Each respondent who agreed to participate was led to a website, shown an orientation page, and instructed to read the entire vignette, and to select a rating from the 5-point scale to reflect the respondent’s feeling about that specific vignette just read. The Mind Genomics program recorded the rating, transformed it, and measured the Consideration Time (response time) from the moment the vignette appeared on the screen to the moment that the vignette was rated. Consideration Times lasting 9 seconds or longer were assumed to reflect other activities going on at the same time and were transformed to 9.
Step 8: Create the individual level models for each respondent for each of the three major responses (feel anger, feel prompted to do something, Consideration Time, respectively) : The model or equation, created by the aforementioned OLS regression, relates the presence/absence of the 16 elements (see Table 1) to the specific binary response. For each person and for each of the three dependent variables, the equation is written as: Dependent variable = k1(A1) + k2(A2) … k16(D4).
The equation shows the contribution of each element to the rating. There is no additive constant here because it is difficult to interpret what the constant ‘means’ in this particular study. ratings. The powerful is each element coefficients represent the number of points on the binary 0/100 scale contributed by the specific answer or the number of seconds taken to read the element when it is present in the vignette. The coefficients give a sense of how the elements ‘drive’ the ratings.
Step 9: Create new Mind-sets based upon the pattern of coefficients : Using the individual level models created in Step 8, cluster the 50 respondents into two groups, doing so three times, one for each of the three dependent variables (anger, act, Consideration Time.) The clustering is based upon well-accepted procedures to divide groups of ‘things’ based upon the patterns exhibit by these things [14] The coefficients emerging from the 50 individual equations for a single dependent variable (e.g., Consideration Time) are used to divide the respondents into two groups. For this Mind Genomics cartography, we used k-means, with the Pearson correlation as the measure of distance. The clustering program creates the clusters or segments strictly using mathematical considerations, without interpreting what the clusters ‘mean.’ Finally, the meaning of the clusters is assigned by the researchers. The clusters are then relabeled ‘mind-sets’ to reflect the fact that they show how people’s mind consider the same evidence but arrive at different conclusions.
Step 10: Classify the respondent regarding membership in key subgroups : Defined each respondent by age, gender, concern with corruption, and by mind-set for each of the three dependent variables. The first three variables, gender, age, concern with corruption, come from a simple classification questionnaire administered at the start of the Mind Genomics experiment. The latter, membership in Mind-sets, comes from the statistical analysis in Step 9. Our focus will be on Total Panel and on Mind-sets, although one can do a complete analysis looking at the general attitudes about corruption, as well as gender, and age.
Step 11: Compute average ratings by the total panel, and the key self-defined subgroups: Each group comprised individuals who were ‘homogeneous’ with respect to one variable of classification, that variable being self-defined (e.g., age). Table 3 shows the average ratings for all respondents in a key group (row) by all of the vignettes that the respondent evaluated. The experimental design ensured that the respondents tested different vignettes, so the averages just give a sense of the differences among the groups, but averages computed on comparable, not identical vignettes.
Table 3: Average ratings by total panel key groups, across all the relevant vignettes for the subgroup.
|
Base size |
Anger – No |
Action – No |
Anger – Yes |
Action – Yes |
Consideration Time |
|
|
Total |
50 |
54 |
52 |
46 |
48 |
3.3 |
|
Gender – Male |
27 |
50 |
47 |
50 |
53 |
3.4 |
|
Gender – Female |
23 |
58 |
58 |
43 |
42 |
3.2 |
|
Age < 29 |
15 |
58 |
66 |
42 |
34 |
1.6 |
|
Age 30+ |
32 |
54 |
44 |
46 |
56 |
4.4 |
|
Age Not given |
3 |
|||||
|
Q3=1 not interested at all regarding corruption in the world of government & public issues |
8 |
46 |
62 |
54 |
38 |
1.9 |
|
Q3=2 would like to change something but don’t know / feel powerless |
16 |
57 |
53 |
43 |
48 |
3.4 |
|
Q3=3 angry at government corruption & voice my protest |
6 |
49 |
49 |
51 |
51 |
4.0 |
|
Q3=4 feel personally endangered by corruption in government & try to become a role model for change |
2 |
56 |
39 |
44 |
61 |
4.0 |
|
Q3=5 Option decline to answer |
8 |
56 |
64 |
44 |
37 |
2.9 |
For example, look at consideration time, No differences by gender, Old respondents take much longer to respond than do younger respondents (4.4 seconds vs 1.6 seconds).
Those respondents not interested in the topic of corruption (Question 3, answer 1) or simply decline to answer (Question 3 answer 5) show much shorter consideration times. Even ahead of the experiment, they announce their disinterest, and give a cursory response, a very short one, suggesting that they are totally uninterested. Future researchers might use this question or the pattern of response times to screen out respondents who clearly do not wish to pay attention, or who behaviorally appear to rush through the evaluation. At a more granular level consider the two age groups, respondents 29 and younger versus 30 and older. The younger respondents will be angrier, but also more likely to take no action. The older respondents will feel less angry but say that they feel that they are more likely to take action. The foregoing analysis is the type of analysis one does with survey day, looking at the mean rating, and drawing conclusions from the patterns of the ratings. The data points themselves, averages, are not ‘cognitively rich.’ The analysis by averages (along with inferential statistics) tells us about more versus less of an attribute. It will be the job of Mind Genomics to embed cognitive richness into the results, the analysis, and in turn, the conclusions and the next steps beyond the research.
Step 12 – Build models (equations) relating elements to binary ratings : The underlying experimental design combining the 16 elements into 24 vignettes allows the researcher to estimate the contribution of each element to the rating or to consideration time. In Step 10 we combine the data from respondents who belong to a specific group (e.g., males, e.g., mind-set 1 based on consideration time). The 16 answers or elements remain uncorrelated with each other, because we are simply combining different experimental designs. In practice, we create one ‘grand’ equation for each of the three main dependent variables, Angry-YES, Do Something-Yes and Consideration Time. The form of the equation is the same for the three different variables: Dependent variable = k1(A1) + k2(A2) … k16(D4). The only difference is the source of the data, which this time is the data from the larger group, rather than from the individual respondent as we did in Step 8 above.
Step 13 – What drives key responses by total panel and emergent mind-sets? : The focus now turns to the interpretation of the results. We begin with the total panels, shown in Table 3. The table presents the coefficients. For the contribution of elements to ‘angry’ and to ‘do something’ we have shaded every element which has a coefficient of 16 or higher, or a consideration time of 1.1 seconds or longer. These are elements which are statistically ‘significant’ in terms of inferential statistics (absolute value of the t-statistic > 2). One way to ‘make sense’ of the vast amount of metricized data is to sort the table, first by those elements driving ‘angry’ and by those elements driving ‘Do something.’ Table 3 suggests that anger is ignited by EVENTS which occur, or the PURPOSE for which the money was allocated. Being prompted to do something is ignited by the EFFECT that the action has, and by WHO is in charge, and presumably doing the stealing. The consideration time differs by element, but for total panel there is no clear pattern.
When we plot the coefficients for Do Something vs Angry
(Figure 1) we see that they are independent of each other. Knowing that an act makes one angry does not predict whether the person will do anything. There appears to be only one anomalous element, where there is little anger, but people want to do something. This is D1, Effect: people demonstrate to demand politicians and government should act with morals.
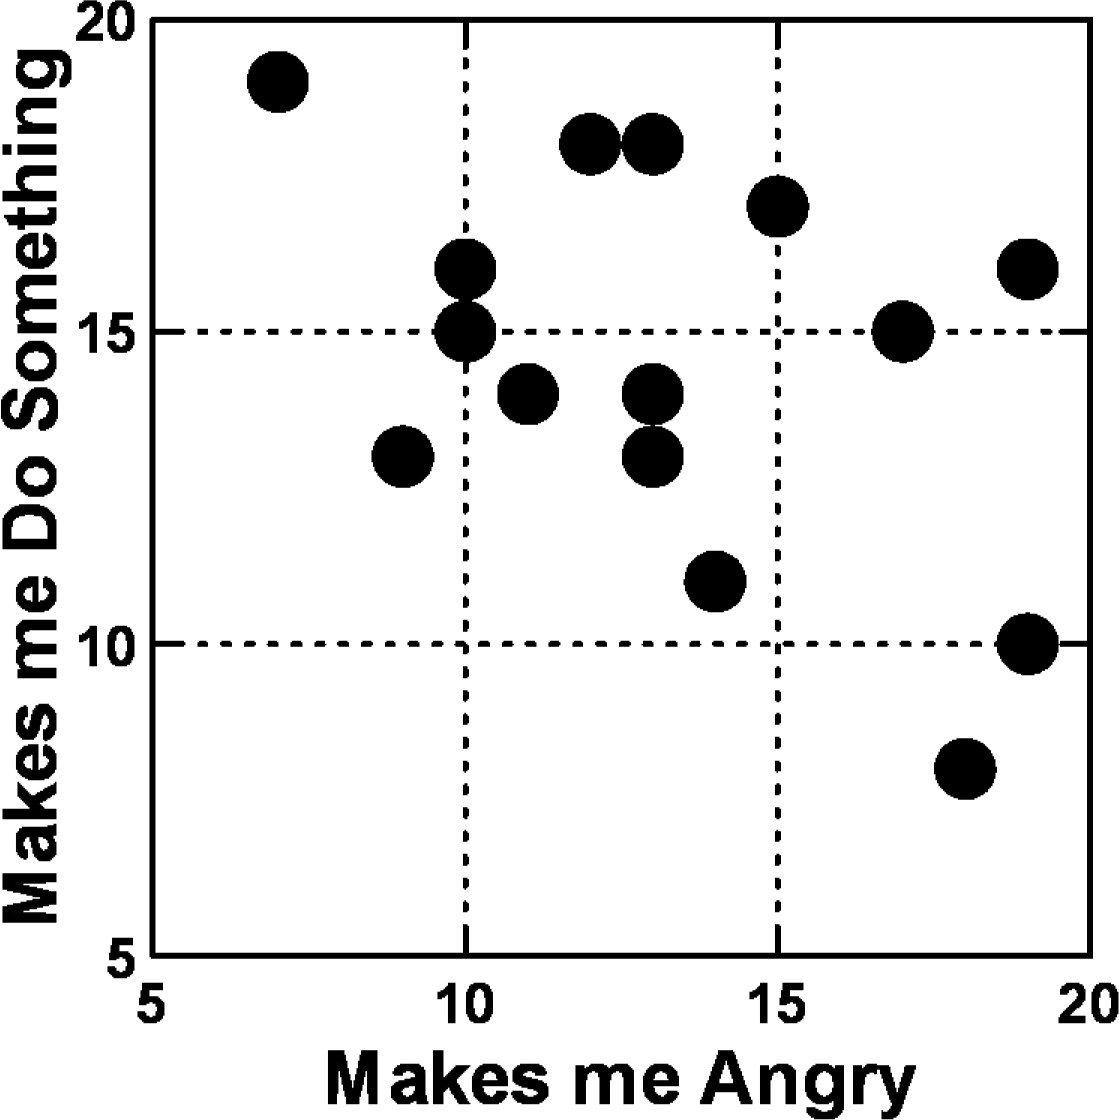
Figure 1: Scatterplot of relation between coefficients for ‘Do something’ versus for ‘Angry’ Data from the total panel.
Moving beyond the total panel to mind groups defined by the pattern of responses
A continuing outcome of Mind Genomics experiments is the discovery of mind-sets, groups of individuals who are similar to each other in the criteria that they adopt to make a decision. As noted in Steps 8 and 9 above, we created the individual-level models. We then clustered the respondents three times, each time based on the pattern of their individual models but using different data sets. The data sets were, respectively, the 50 individual equations created for ‘makes me angry’, the 50 individual equations created for ‘prompts me to want to do something,’ and finally the 50 individual equations created for Consideration Time
Table 4 shows the key results for clustering based on ‘makes me angry.’
Table 4: What drives corruption: How the 16 elements drive ratings of angry, ‘do something,’ and the consideration time to read and process the element
|
|
Total Panel |
Feel Angry |
Promoted to Do something |
Consideration Time |
|
Strongly drives ‘Angry’ |
||||
|
C4 |
Event: land sold, money directed to payoff ‘newly discovered ‘ government obligations |
19 |
10 |
1.2 |
|
D3 |
Effect: economy stagnates, young people leave in droves |
19 |
16 |
0.9 |
|
C2 |
Event: money redirected to ‘new uses’ by controlling ‘inner circle’ |
18 |
8 |
1.2 |
|
C1 |
Event: money simply disappears. |
18 |
8 |
0.9 |
|
B4 |
Purpose: money to maintain citizen health |
17 |
15 |
1.1 |
|
Strongly drives ‘Prompted to do something’ |
||||
|
D1 |
Effect: people demonstrate to demand politicians and government should act with morals |
7 |
19 |
0.5 |
|
D4 |
Effect: demoralized angry people who are angry at growing gap between rich & poor |
13 |
18 |
0.7 |
|
B3 |
Purpose: money for hospitals, schools, roads |
12 |
18 |
1.1 |
|
B1 |
Purpose: money to fund student education programs |
15 |
17 |
0.7 |
|
A1 |
In charge: wealthy businessperson |
10 |
16 |
1.0 |
|
Not a strong driver |
||||
|
C3 |
Event: call vote to redirect money to new use |
13 |
13 |
1.4 |
|
A2 |
In charge: member of traditional ruling class |
10 |
15 |
1.1 |
|
B2 |
Purpose: money to fund environment safety & sustainability |
13 |
14 |
1.0 |
|
A4 |
In charge: well-known & successful actor |
11 |
14 |
1.0 |
|
A3 |
In charge: woman director from a local school |
9 |
13 |
0.8 |
|
D2 |
Effect: people are what’s happening — rush to grab their portion … Me First Mentality |
14 |
11 |
0.7 |
Mind-set 1 – Angry when reading about what happened, or who was in charge
Mind-set 2 – Angry when reading about the effects of corruption
Table 5 shows the key results for clustering based on ‘Prompts me to want to do something.’
Table 5: Two mind-sets based upon coefficients for ‘Makes me angry’
|
Clusters based on coefficients for ‘Makes me angry’ |
MS1 Angry |
MS 2 Angry |
|
|
Mind-set 1 – Angry when reading about what happened, or who was in charge (n=30) |
|||
|
C1 |
Event: money simply disappears. |
38 |
4 |
|
C2 |
Event: money redirected to ‘new uses’ by controlling ‘inner circle’ |
34 |
-6 |
|
A3 |
In charge: woman director from a local school |
29 |
-8 |
|
A1 |
In charge: wealthy businessperson |
28 |
-8 |
|
A2 |
In charge: member of traditional ruling class |
28 |
-1 |
|
C4 |
Event: land sold, money directed to payoff ‘newly discovered ‘ government obligations |
26 |
10 |
|
A4 |
In charge: well-known & successful actor |
25 |
-5 |
|
Mind-set 2 – Angry when reading about the effects of corruption (n=20) |
|||
|
D3 |
Effect: economy stagnates, young people leave in droves |
-13 |
48 |
|
D2 |
Effect: people are what’s happening — rush to grab their portion … Me First Mentality |
-12 |
32 |
|
D4 |
Effect: demoralized angry people who are angry at growing gap between rich & poor |
-10 |
31 |
|
D1 |
Effect: people demonstrate to demand politicians and government should act with morals |
-19 |
29 |
|
Does not Strongly Anger either mind-set |
|||
|
B4 |
Purpose: money to maintain citizen health |
15 |
21 |
|
B3 |
Purpose: money for hospitals, schools, roads |
7 |
19 |
|
B1 |
Purpose: money to fund student education programs |
15 |
19 |
|
B2 |
Purpose: money to fund environment safety & sustainability |
16 |
18 |
|
C3 |
Event: call vote to redirect money to new use |
19 |
3 |
Mind-set 1 – Want to do something when learning who was in charge (n=25)
Mind-set 2 – Want to do something when learning about the effect of corruption (n=25)
Table 6 shows the key results for clustering based on Consideration Time’
Table 6: Two mind-sets based upon coefficients for ‘Prompts me to want to do something’
|
Clusters based on coefficients for ‘Prompts me to want to do something’ |
MS1 Do |
MS2 Do |
|
|
Mind-set 1 – Want to do something when learning who was in charge (n=25) |
25 |
25 |
|
|
A1 |
In charge: wealthy businessperson |
38 |
-3 |
|
A2 |
In charge: member of traditional ruling class |
33 |
0 |
|
A3 |
In charge: woman director from a local school |
33 |
-3 |
|
A4 |
In charge: well-known & successful actor |
28 |
4 |
|
Mind-set 2 – Want to do something when learning about the effect of corruption (n=25) |
|||
|
D4 |
Effect: demoralized angry people who are angry at growing gap between rich & poor |
10 |
32 |
|
D3 |
Effect: economy stagnates, young people leave in droves |
12 |
30 |
|
D2 |
Effect: people are what’s happening — rush to grab their portion … Me First Mentality |
0 |
29 |
|
D1 |
Effect: people demonstrate to demand politicians and government should act with morals |
16 |
28 |
|
Does not strongly affect either mind-set |
|||
|
B3 |
Purpose: money for hospitals, schools, roads |
6 |
22 |
|
B2 |
Purpose: money to fund environment safety & sustainability |
11 |
14 |
|
C4 |
Event: land sold, money directed to payoff ‘newly discovered ‘ government obligations |
7 |
13 |
|
B4 |
Purpose: money to maintain citizen health |
16 |
13 |
|
C3 |
Event: call vote to redirect money to new use |
9 |
12 |
|
B1 |
Purpose: money to fund student education programs |
14 |
12 |
|
C2 |
Event: money redirected to ‘new uses’ by controlling ‘inner circle’ |
5 |
6 |
|
C1 |
Event: money simply disappears. |
12 |
6 |
Mind-set 1 – Longest Consideration Time (most involved in reading) when information is about Who is in Charge (n=21)
Mind-set 2 – Longest Consideration Time when information is about the specific event which happened (n=29)
Can the response to corruption be modified by WHO is perceived as the corrupt person
Up to now the analysis has focused on each of the 16 elements as a contributor to the feeling of being angry, of wanting to do something, or of capturing the attention of the respondent (consideration time). What happens, however, when we do the analysis, but hold constant the person in charge. That is, when the corruption occurs, is the magnitude of the corruption the same when we have two radically different individuals in charge, such as a a wealthy businessperson versus a woman director from a local school? Or does being one of the individuals, e.g., the woman director from a local school, give the person a ‘pass’ on corruption?. Most people would probably say that WHO a person IS does not affect how the person is judged. That statement is reasonable, expected, and totally ‘politically correct.’ It may or may not be true. The interaction of WHO and ACTION as joint drivers of innocence versus guilt can quantified easily by Mind Genomics, following these analysis steps.
- The permutation structure of the Mind-Genomics study creates many different combinations, in which the person in charge and the act of corruption appear together. It will be the fact that there are so many different combinations tested that will allow us to uncover the interactions, to measure the response to each element in the presence of each of the other elements in the study. We will thus uncover either no effect, or suppression, or synergism, respectively.
- We explore the nature of the interaction by so-called ‘scenario analysis,’ a term coined specifically for this type of analysis and discussed in depth in the book ‘Selling Blue Elephants’ [10].
- For our analysis, we sort the data file of 1200 records by the specific value of Answer or Element A, ‘who is in charge.’ There are four specific individuals in charge and some vignettes there is no individual stated to be in charge. The underlying permuted experimental design thus allows us to create five strata of vignettes, each stratum defined by the value of Question A, viz., the specific person in charge.
- For each of the five strata, we have the remaining 12 elements acts as independent variables, which they can do because the underlying experimental designs, when combined, still keeps the 12 elements statistically independent of each other.
- Once again, the OLS regression analysis is run, stratum by stratum, for each of the three dependent variables (Makes me angry; Prompts me to do something; Consideration Time).
- Table 7 show the five strata across the top, beginning with A0 (those vignettes with no mention of who is in charge), and then the strata where the person in charge is, respectively, a wealthy businessperson, a member of the traditional ruling class, a woman director from a local school, or a well-known and successful actor. The structure of the table is the same for each of the three dependent variables. We will focus on the first dependent variable, ‘Makes me angry.’
- To conserve space, and to illustrate the principles, we present only the strongest two elements and the weakest two elements, based upon the stratum which is lacking an element from question A (who is in charge).
- We first look at the Maximum coefficient across all 12 elements. This is the highest coefficient of any element B1-D4, which are now the independent variables in the model. For ‘makes me angry’ the highest coefficient is 27 when there is no person in charge. This is element B4 (Purpose: money to maintain citizen health). The maximum coefficient varies by who is in charge. When a member of the traditional ruling class is mentioned, the maximum coefficient is much higher, 39.
- The standard deviation of 12 coefficients is a measure of variation across the 12 coefficients. It is 7 for the stratum where there is no mention of a person in charge, but 16, much greater, when there the person in charge is a member of the traditional ruling class.
- The Table then shows the highest coefficients for the strata lacking the person in charge. These are elements B4 (Purpose: money to maintain citizen health) and C4 (Event: land sold, money directly to pay off ‘newly discovered’ government obligation.) One can see how these two basically anger-producing can be affected by changing the specific person in charge. When element B4 is substituted (A well-known & successful actor), the anger from 27 to 9!.
- The table then shows the lowest coefficient for the strata lacking the person in charge. This is D2: (Effect: people are what’s happening — rush to grab their portion …Me First Mentality.) This element starts out with a very low anger producing response, a coefficient of +7. Put in the same well-known and successful actor in charge, and the anger goes to 16.
- The same insights can be obtained from the other dependent variables. The table is shortened to show the key numbers from the analysis, and to explicate some of the anomalies which can emerge when elements of a ‘corruption’ nature are paired with the individual in charge. Sometimes the corruption can be overlooked, sometimes it can be made more severe.
Table 7: Two mind-sets based upon coefficients for Consideration Time
|
Clusters based on coefficients for Consideration Time |
MS1 CT |
MS2 CT |
|
|
Mind-set 1 – Longest Consideration Time (most involved in reading) when information is about Who is in Charge (n=21) |
|||
|
A2 |
In charge: member of traditional ruling class |
2.3 |
0.0 |
|
A4 |
In charge: well-known & successful actor |
2.2 |
-0.2 |
|
A1 |
In charge: wealthy businessperson |
2.1 |
0.0 |
|
A3 |
In charge: woman director from a local school |
2.0 |
-0.4 |
|
Mind-set 2 – Longest Consideration Time when information is about the specific event which happened (n=29) |
|||
|
C3 |
Event: call vote to redirect money to new use |
1.0 |
1.9 |
|
C2 |
Event: money redirected to ‘new uses’ by controlling ‘inner circle’ |
1.1 |
1.8 |
|
C4 |
Event: land sold, money directed to payoff ‘newly discovered ‘ government obligations |
0.8 |
1.8 |
|
Does not strongly engage either mind-set |
|||
|
C1 |
Event: money simply disappears. |
1.3 |
1.2 |
|
B3 |
Purpose: money for hospitals, schools, roads |
1.0 |
1.3 |
|
B4 |
Purpose: money to maintain citizen health |
0.8 |
1.1 |
|
B2 |
Purpose: money to fund environment safety & sustainability |
0.7 |
1.4 |
|
B1 |
Purpose: money to fund student education programs |
0.1 |
1.3 |
Finding these individuals in the population
A continuing finding from Mind Genomics studies is that who a respondent IS does not easily predict how the respondent will think, in general, and cannot at all predict how a specific person will think when the topic is limited, and for which there is no available data. In other words, efforts to predict mind-set membership will not be particularly successful because people stay the same in terms of WHO they are, yet respond differently for different topics. We need another method to assign a new person to a newly created or identified mind-set, with the property that no matter who the person is, and no matter what the mind-sets are, the assignment is as effective as possible. The assumption is that there are NO DATA in the world available relevant to the newly discovered mind-sets, or at least no data exhibiting sufficient precision. Recent work by author Gere has emerged out with a PVI, a personal viewpoint identifier, based upon the ability of the degree of the elements to separate people and divide them into meaningful groups. The PVI involves Monte Carlo simulation of the mind-set models. The mind-set segments themselves can come from anywhere. It is the job of the researcher to identify the mind-sets, and their nature. The PVI simply finds the mind-sets in the population. The metaphor here is ‘mining ore that is 98% saturated with what is being sought’ (the PVI, created precisely for the topic) versus ‘mining ore that is ½% saturated with is being sought’ (using massively powerful analytics with Big Data, conveniently available, but often totally irrelevant). For this study we created three separate PVIs, based upon the pairs of patterns of the coefficients for the three dependent variables in this study, Anger, Do Something, and attention (Consideration Time.) These three PVI’s are incorporated into one test instrument, shown in Figure 1. The result is a set of 18 questions, which when answered together assigned the new person into the appropriate mind-set for each dependent variable (Figure 1).
Table 8: Scenario analysis, showing how the different people ‘in charge’ affects the response to the other elements.
|
|
No one stated to be in charge |
|
In charge: wealthy businessperson |
In charge: member of traditional ruling class |
In charge: woman director from a local school |
In charge: well-known & successful actor |
|
|
A0 |
A1 |
A2 |
A3 |
A4 |
|||
|
Dependent variable = Makes me angry |
|||||||
|
Maximum coefficient across B1-D4 |
27 |
34 |
39 |
27 |
26 |
||
|
Standard deviation of 12 coefficients |
7 |
9 |
16 |
5 |
5 |
||
|
B4 |
Purpose: money to maintain citizen health |
27 |
|
23 |
24 |
22 |
9 |
|
C4 |
Event: land sold, money directed to pay off ‘newly discovered ‘ government obligations |
26 |
|
23 |
22 |
14 |
19 |
|
D1 |
Effect: people demonstrate to demand politicians and government should act with morals |
10 |
1 |
13 |
14 |
12 |
|
|
D2 |
Effect: people are what’s happening — rush to grab their portion… Me First Mentality |
7 |
22 |
26 |
18 |
16 |
|
|
Dependent variable = Prompts me to want to do something |
|||||||
|
Maximum coefficient across B1-D4 |
56 |
32 |
34 |
32 |
26 |
||
|
Standard deviation of 12 coefficients |
16 |
9 |
12 |
8 |
7 |
||
|
B3 |
Purpose: money for hospitals, schools, roads |
56 |
|
3 |
24 |
25 |
18 |
|
B4 |
Purpose: money to maintain citizen health |
25 |
|
23 |
20 |
5 |
21 |
|
D2 |
Effect: people are what’s happening — rush to grab their portion …Me First Mentality |
2 |
26 |
23 |
13 |
1 |
|
|
D3 |
Effect: economy stagnates, young people leave in droves |
2 |
29 |
30 |
29 |
12 |
|
|
Dependent variable = Consideration Time |
|||||||
|
Maximum coefficient across all B1-D4 |
2.0 |
3.6 |
2.8 |
2.4 |
2.3 |
||
|
Standard deviation of 12 coefficients |
0.4 |
0.7 |
0.7 |
0.5 |
0.6 |
||
|
D3 |
Effect: economy stagnates, young people leave in droves |
2.0 |
|
-1.1 |
2.0 |
1.3 |
1.2 |
|
C4 |
Event: land sold, money directed to payoff ‘newly discovered ‘ government obligations |
1.8 |
3.6 |
1.0 |
0.5 |
1.0 |
|
|
B1 |
Purpose: money to fund student education programs |
0.7 |
1.0 |
0.2 |
1.3 |
1.4 |
|
|
D2 |
Effect: people are what’s happening — rush to grab their portion … Me First Mentality |
0.6 |
-0.8 |
2.8 |
1.1 |
0.9 |
|
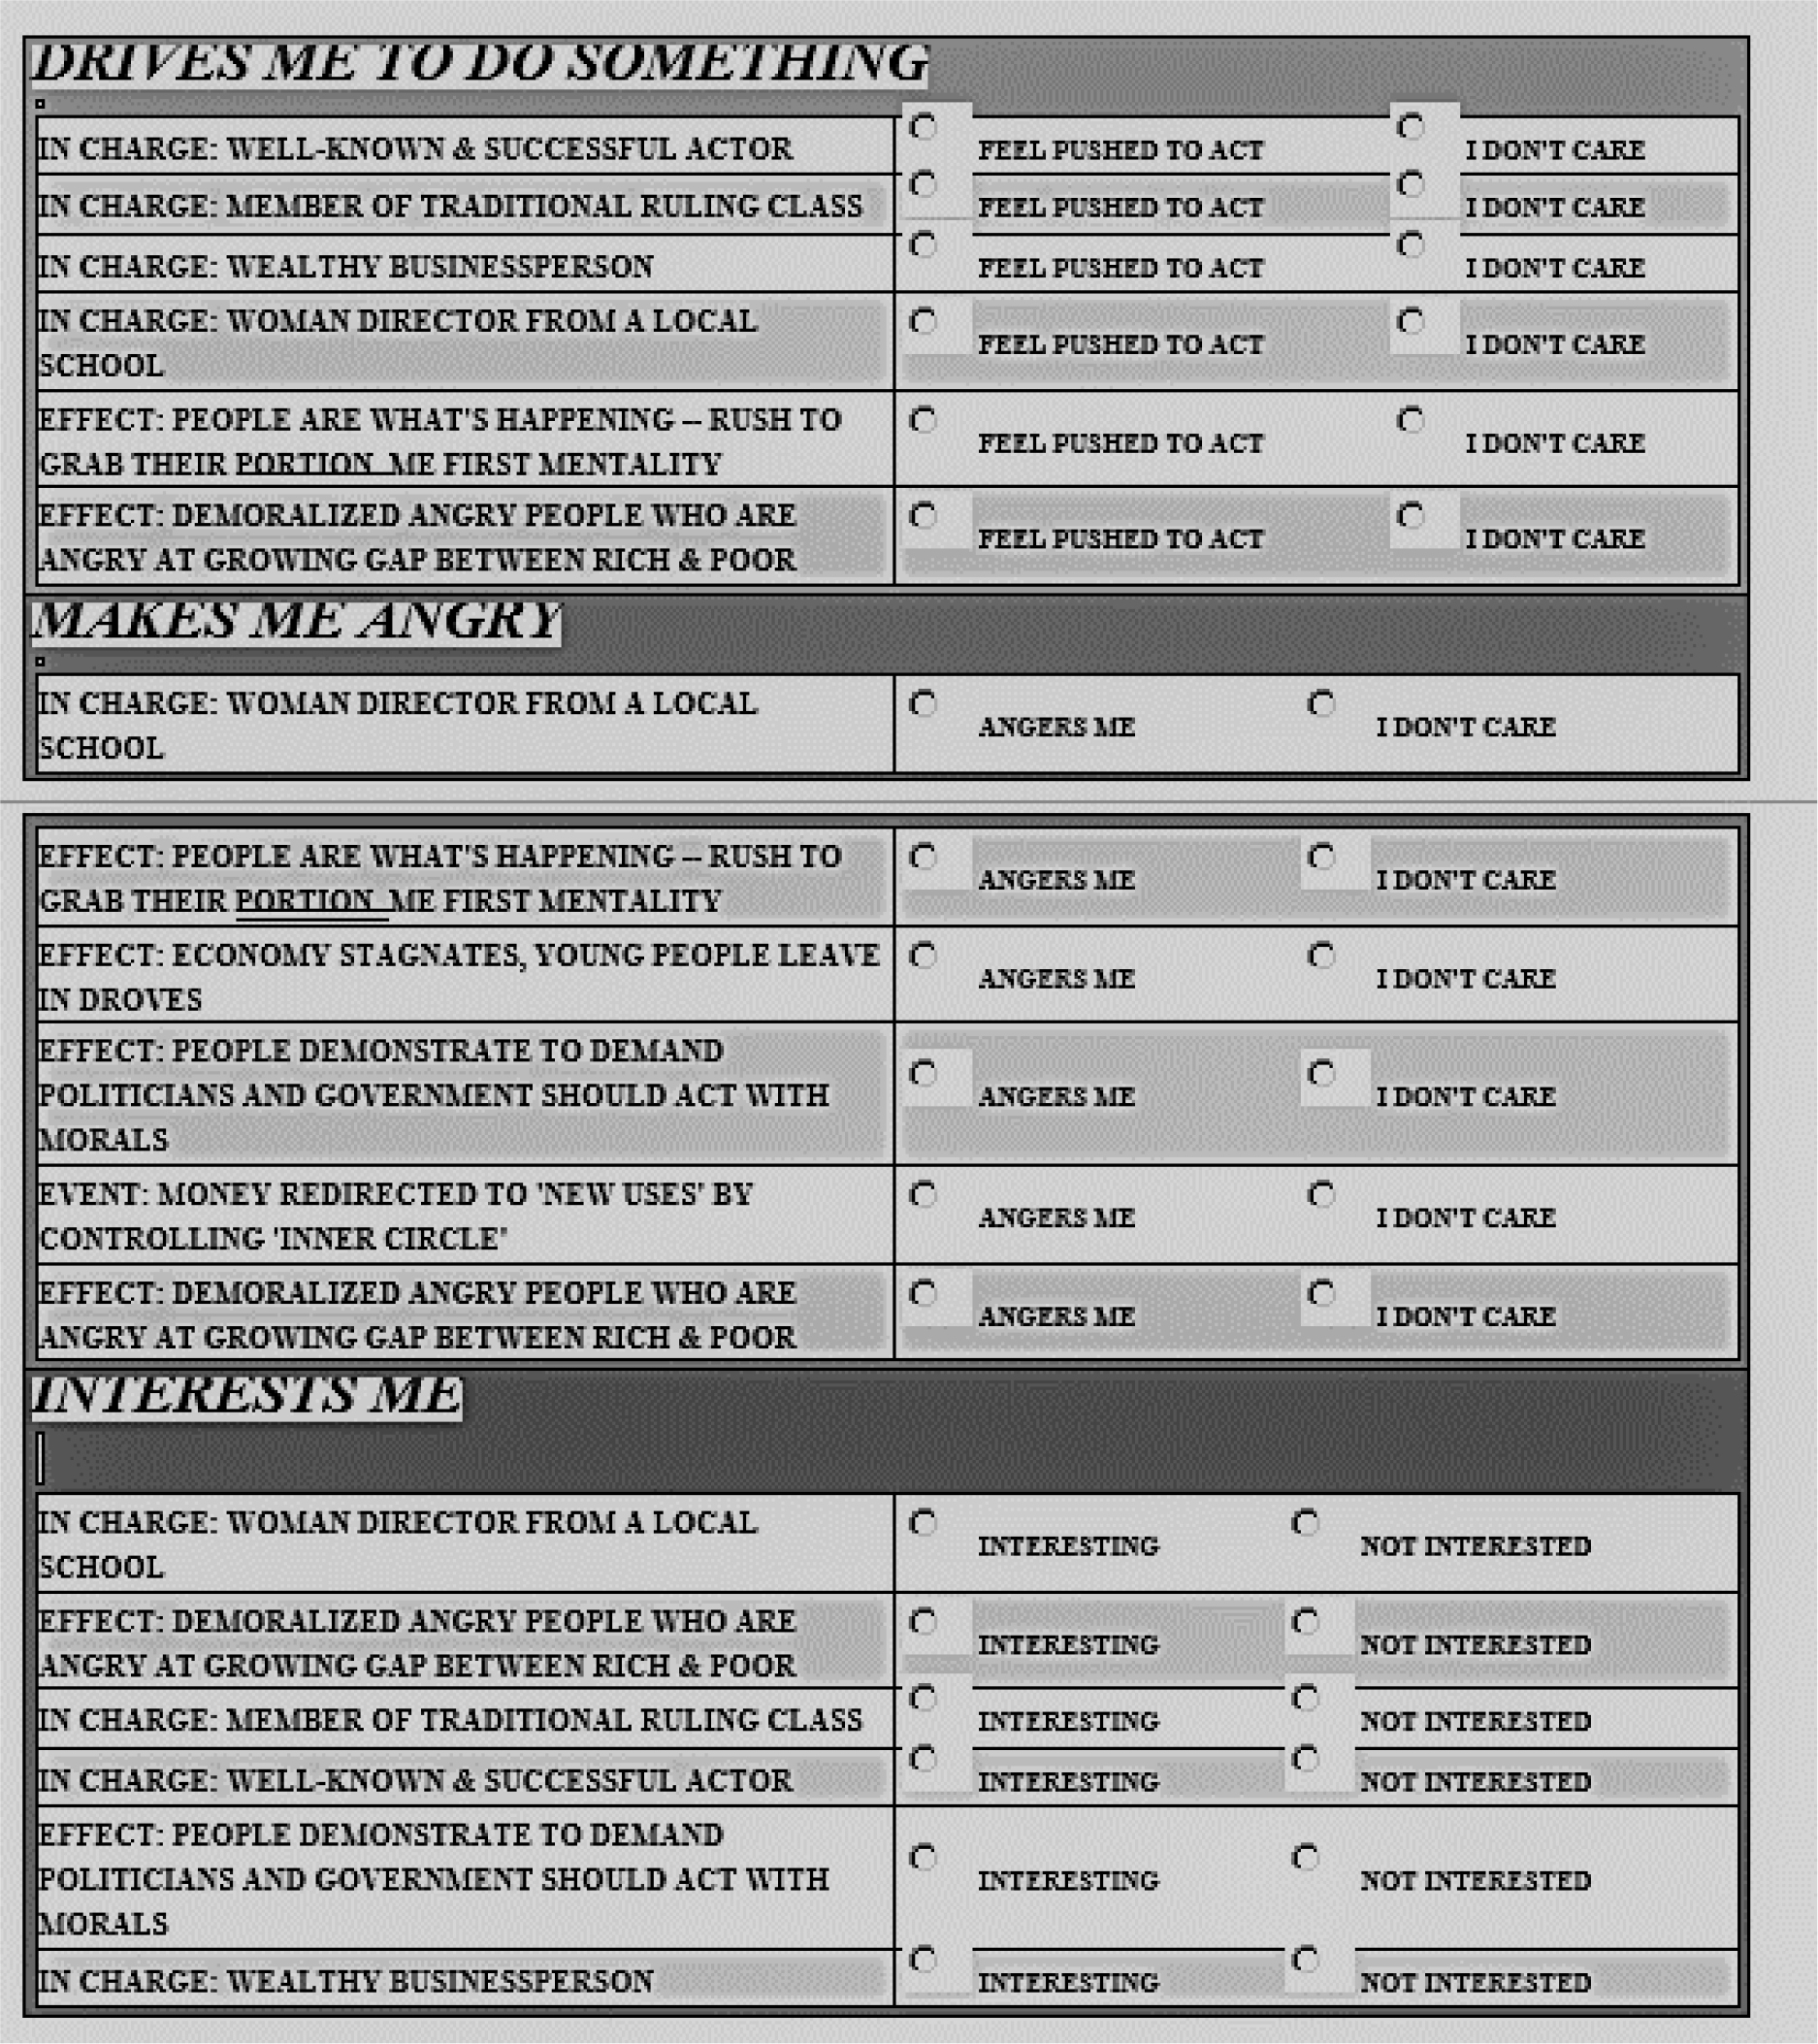
Figure 2: The PVI (personal viewpoint identifier) which assigns a new respondent into one of two complementary mind-sets for each variable (drives me to do something, makes me angry, interests me).
Discussion and conclusion
At the most fundamental level, the project of Mind Genomics is to understand the way people think by presenting to them combinations of messages relevant to a topic, and then measuring their cognitive response (rating), or now their subconscious response (Consideration Time.) The traditional way of such approaches is to isolate the variables, and test these variables, perhaps with many replicates, so that one can ‘suppress the noise.’ The ingoing belief is that one-at-a-time research, with low noise, will eventually reveal how people make decisions. There is another aspect to the traditional approach. That is to create unusual situations, situations which by happenstance allow the researcher to decide between or among different ingoing hypotheses. This is the so-called experimentum crucis, the crucial experiment whose outcome decides for one hypothesis, and falsifies another. Science thus advances, one observation at a time, producing perhaps a cadre of observations about nature that must be woven together by one or another enterprising researcher looking for the ‘grand pattern.’ How then could conventional research address the topic of corruption using traditional methods. The answer is not clear. The respondent might be asked directly to rate the seriousness of the corruption, but as we see the seriousness, as measured by the coefficient, can be influenced by the other elements in the vignette, such as ‘Who is in charge.’ Mind Genomics provides an alternative way to explore human decision making, this alternative using the type of stimuli to which a person is exposed daily, viz., combinations of messages. The benefits are that the research can cover a wider array of topics, rolled up into one in the vignettes, can create a within subjects design leading to the discovery of mind-sets, can do the work quickly, affordably, and allow for iterations. Perhaps the most important benefit is that the topic can be explored, and the different Mind Genomics studies combined to create an integrated library of knowledge about a topic in a very short time. The knowledge about corruption, the experiment taking two hours, advances our knowledge considerably. One can only wonder to what extent our knowledge and understanding might advance regarding ethics and their violation if our ‘project’ were to do these Mind Genomics cartographies in a concerted, systematic, deliberate, and expansive way.
Acknowledgement
Attila Gere thanks the support of Premium Postdoctoral Research Program of the Hungarian Academy of Sciences.
References
- Brooks RC (1909) The nature of political corruption. Political Science Quarterly 24: 1–22.
- Rousseau JJ (2018) Rousseau: The Social Contract & other later political writings. Cambridge University Press.
- Gopinath C (2008) Recognizing & justifying private corruption. Journal of Business Ethics 82: 747–754.
- Nye JS (1967) Corruption & political development: A cost-benefit analysis. American Political Science Review 61: 417–427.
- Balafoutas L (2011) Public beliefs & corruption in a repeated psychological game. Journal of Economic Behavior & Organization 78: 51–59.
- Ashforth BE, Anand V (2003) The normalization of corruption in organizations. Research in Organizational Behavior 25: 1–52.
- Zimring FE, Johnson DT (2005) On the comparative study of corruption. British Journal of Criminology 45: 793–809.
- Lancaster TD, Montinola GR (1997) Toward a methodology for the comparative study of political corruption. Crime, Law & Social Change 27: 185–206.
- Zaloznaya M (2014) The social psychology of corruption: Why it does not exist & why it should. Sociology Compass 8: 187–202.
- Moskowitz HR, Gofman A (2007). Selling blue elephants: How to make great products that people want before they even know they want them. Pearson Education.
- Moskowitz HR, Gofman A, Beckley J, Ashman H (2006) Founding a new science: Mind genomics. Journal of sensory studies. 21: 266–307.
- Box GE, Hunter JS, Hunter WG (2005). Statistics for experimenters: design, innovation, and discovery (2ndedn). New York: Wiley-Interscience.
- Gofman A, Moskowitz HR (2010) Isomorphic permuted experimental designs & their application in conjoint analysis. Journal of Sensory Studies 25: 127–145
- Dubes R, Jain AK (1980) Clustering methodologies in exploratory data analysis. Advances in Computers. 19: 113–228 Elsevier.