Abstract
Two studies were run to understand the driving factors for intangibles, the first study dealing with attendance at an academic/business conference, the second dealing with the likelihood of voting for a candidate promoting specific values. In each study, groups of US respondents, varying in age and gender, each evaluated unique sets of 24 vignettes, comprising 16 different messages with the vignettes created by experimental design, following the Mind Genomics paradigm.Noticeable and occasionally significant age and gender differences emerged in the set of elements driving positive responses, but the group differences did not tell a coherent story. Only when the respondents were divided into mind-sets, based upon the pattern of their responses did a coherent story emerge, both for the first experiment on conferences, and the second experiment on candidates. Focusing analysis on age and gender may hinder the search for more profound difference among people, one based upon mind-set. With mind-sets, inter-individual variation in thinking about a topic becomes to become more interpretable and meaningful.
Introduction
Convincing others to do something may occupy a great deal of time. Whether the convincing is to have a child eat or behave, convincing children to study, convincing another to become romantically involved, purchase, and so forth, the normal life of a person in society is grounded in the act of persuading. A great deal of a nation’s literature, a great deal of psychology and sociology, not to mention economics, deals with the various aspects of attempts to convince.
Convincing individuals varies by the nature of the topic. Thousands of years ago the Greeks, masters of rhetoric, realized that it was both the substance of the argument and the form of the argument which were important. Yet, to make the topic simple, we may summarize the process by first observing the problem, second by proposing solutions, third explaining how the solutions will work, and fourth, appealing to the individual interests of the audience. Beyond that, the rest is method and content, respectively, for those wanting to do the convincing, and by the need states and susceptibilities of those who are to be convinced. The literature of decision making is vast and cannot be dealt in a simple ‘methods paper.’ Rather, the objective of this paper to present a new, alternative approach, Mind Genomics, which emerges from experimental psychology and disciplined behavioral science [1]. Mind Genomics at its heart comprises experiments which identify ‘causation’ when messages are used to convince a decision maker.
This paper introduces a relatively new approach to study the art of ‘convincing.’ Mind Genomicshas been used in the form of conjoint measurement to understand what messages one to use in order to convince. Mind Genomics focuses in the application of conjoint measurement to the decisions, and the decision rules, of the everyday experience [2, 3]. The paper use Mind Genomics to compare two types of ‘convincing,’ one to ‘sell a professional conference,’ the other to sell a ‘candidate’ for an election. Historically, conjoint measurement has been used to identify the relative importance of factors in a considered decision, such as insurance selection, or health benefits. The respondent is provided with pairs of stimuli, whose composition is known for each alternative in the pair. The respondent must select one of the two stimuli. The pattern of selections can be processed by an accepted computation scheme to generate the ‘utilities’ or ‘impact’ of each element of the set of elements. The methods can be tedious, but have found use in large-scale, expensive, but critical decisions, such as the choice of medical and so forth [4].
Mind Genomics – foundations and processes
The scientific method teaches that variables should be separated and studied in ‘splendid isolation.’ For most variables the isolation works, but not necessarily in messages. Typically, messages come to people in combinations, with the different messages complementing each other, suppressing each other, or even synergizing with each other so that the whole, the combination, often is far more impactful than would be by the sum of individual impacts. In normal life, we do not encounter single messages, except perhaps for those signaling ‘emergency’ or ‘danger.’ When we are exposed to single messages in a research context or in public opinion polling, we focus unduly on the topic, and give biased answers by trying to ‘guess’ the correct answer, or answer in the way that the researcher expects.
The Mind Genomics approach differs dramatically from the conventional one-at-a-time approach espoused by traditional research. The researcher presents the respondent with different combinations of messages, instructing the respondent to ‘vote’ for the combination. The approach seems a bit odd, based upon the traditional method of ‘one at a time.’ When compared to conventional approaches, we can say that that the Mind Genomics approach is more Socratic, holistic, yet systematic, and oriented towards creating combinatorial models for persuasion and communication:
Holistic: The test stimuli are combinations of messages, not single messages alone. The holistic approach simulates what we see in real, daily life. For the most part, we deal with mixtures of stimuli coming at us all the time. When we talk, walk, drive, read, eat, and so forth, we do not pay attention to one variable, except perhaps for a very short time to examine it more closely. We live in the moment, the moment comprising a kaleidoscope of changing combinations.
Socratic: The Socratic method comprises a question and answer dialogue. Carried out effectively, the dialogue reveals the underlying structure of the topic. Socratic dialogue is not the pure science to which we are accustomed (nomothetic), for it is intensely individual rather than general (idiographic). Yet, for topics studying the act of judgment itself, the Socratic method can generate the necessary test material by which the researcher uncovers some individual ‘rules’ of decision.
Systematic: The abovementioned answers to questions are ‘elements,’ namely simple, easy to comprehend statements, almost factoids. These elements or answers to questions are combined by the discipline of experimental design into small, easy to read combinations. [2]. Mind Genomics is based upon the belief that when making a decision the respondent ‘grazes’ for information, rather than ingests, chews, and digests, respectively. The Mind Genomics research process recognizes grazing, and is designed to be fast and minimally intellectual, metaphorically similar to grazing at a superficial level. No effort is made to combine the different elements into a flowing paragraph.
Models: Mind Genomics develops mathematical models showing how each element or answer ‘drives’ the response. The response may be a rating (would not attend to would attend, would vote for candidate to would vote for candidate), the selection of an emotion or feeling from a set of several alternatives (happy, sad, curious, excited, etc.), the selection of a price, the selection of an end use, etc. The models show the linkage between the different elements and the rating.
Steps in the Process – Creation of raw materials through a Socratic process: The researcher selects a topic. The researcher then asks four questions which ‘tell a story.’ Asking the four questions can be hard, and forces creative and critical thinking. Most people are not educated to ask questions in a systematic way, in contrast to a reporter or writer who does so by habit when creating a coherent story. Once the four questions are asked, it become very easy to provide four simple answers to each question. The concern is often raised as to whether the questions are truly the ‘correct questions’ to ask, and in turn, whether the four answers to each question suffice, as well as whether or not they are the proper answer. It takes a while to disabuse the novice of the reality that there are no correct questions nor answers, but rather report ‘blocks’ at this stage, because they either cannot think of questions, and freeze up, or they take the instruction literally, and cannot ‘tell a story.’ With practice, however, they realize that the narrative can tell a story, but not the polished story to which they have been accustomed.
Steps in the Process –Creating the vignettes using experimental design to specify combinations: Mind Genomics traces back to the evaluation of combinations of messages, with the combinations prescribed by experimental design, or metaphorically by a set of recipes which combine the individual messages into known combinations. For the Mind Genomics studies run here, with the four questions and four answers per question, each respondent evaluated a unique set of 24 vignettes or combinations. Each vignette comprised 2, 3 or 4 answers, at most one answer from each question. The answers are coded 0 when absent from a vignette, and 1 when presented in a vignette. The experimental design ensures that each respondent evaluates the 16 answers in different combinations, and that the answers or elements are statistically independent of each other. The statistical independence will allow the researcher to create individual-level equations, one for each respondent, relating the presence/absence of the 16 elements either to the binary transformed rating (0/100) or to the consideration time (CT).
Table 1 shows the schematic for eight vignettes from Respondent #1. The respondent evaluated the eight vignettes in sequence. The combination is defined by the experimental design. A ‘0’ represents the fact that the element was absent from the vignette. A ‘1’ represents the fact that the element was present in the vignette. The respondent rating on a 9-point scale was recorded, along with CT, consideration time, the number of seconds elapsing between the presentation of the vignette on the screen and the rating. The CT is recorded to the nearest tenth of a second.
Table 1. Eight vignettes from the conference study.
|
Order |
A1 |
A2 |
A3 |
A4 |
B1 |
B2 |
B3 |
B4 |
C1 |
C2 |
C3 |
C4 |
D1 |
D2 |
D3 |
D4 |
Rating |
CT |
|
1 |
0 |
0 |
1 |
0 |
0 |
0 |
0 |
0 |
0 |
0 |
1 |
0 |
1 |
0 |
0 |
0 |
4 |
9.0 |
|
2 |
1 |
0 |
0 |
0 |
0 |
0 |
0 |
1 |
1 |
0 |
0 |
0 |
0 |
0 |
0 |
0 |
4 |
4.5 |
|
3 |
1 |
0 |
0 |
0 |
0 |
0 |
1 |
0 |
0 |
0 |
0 |
0 |
1 |
0 |
0 |
0 |
4 |
3.0 |
|
4 |
0 |
0 |
0 |
1 |
0 |
0 |
0 |
1 |
1 |
0 |
0 |
0 |
0 |
0 |
0 |
0 |
4 |
2.0 |
|
5 |
0 |
1 |
0 |
0 |
0 |
0 |
0 |
0 |
0 |
0 |
0 |
1 |
0 |
1 |
0 |
0 |
5 |
3.2 |
|
6 |
0 |
1 |
0 |
0 |
0 |
0 |
1 |
0 |
0 |
1 |
0 |
0 |
0 |
0 |
0 |
1 |
6 |
2.9 |
|
7 |
0 |
0 |
1 |
0 |
0 |
1 |
0 |
0 |
0 |
1 |
0 |
0 |
0 |
0 |
1 |
0 |
5 |
6.1 |
|
8 |
0 |
0 |
0 |
1 |
0 |
0 |
1 |
0 |
0 |
0 |
0 |
1 |
0 |
0 |
1 |
0 |
5 |
4.6 |
Study 1 – ‘Selling a conference’
Study 1 focused on how one ‘sells’ or at least advertises a conference about the evolving area of data analytics, when the audience comprises random people.
Conferences are important as a key venue for academics. It is important to market conferences, to communicate what the conference provides for the attendee [5]. Beyond the conference as an academic product to be marketed, the conference is a topic of interested in itself, The conference is a contained environment where relevant interpersonal behaviors are strongly demonstrated. Researchers have investigated conferences from the outside, from the benefits of the respondent [6]. One of the key benefits is making connections [7].
Conferences themselves are a venue for sociological and psychological research. The conference is a specific venue, offering the chance to observe a variety of different behaviors. For example, one research avenue is to study behavior at conferences in terms of the behaviors of males versus females. An anthropological approach might look at the conference as a venue wherein certain attitudes are manifest in behaviors, in the so-called ‘lived experience’ [8]. There are a variety of dimensions to conferences, dimensions which can serve as the foundation of research to understand the mind and motivations of those who attend the conference. These dimensions range from the conference as a venue of information to be disseminated and learned, involving different groups, such as academics versus practitioners, respectively [9, 10], as well as networking vs knowledge [11–13]. Then there is the ever-present dimension of the conference as a venue to introduce students, and to let the students interact with senior professionals [14, 15].
Table 2 presents the four questions and the 16 answers. The actual questions were recorded, along with the answers, and then slightly edited to ensure proper English. Note that the answers are simple, with three dots (…) replacing some connectives, to make reading easier.It is important to note that the elements or messages, i.e., the answers to the questions, are simple. They are descriptive, and generally feature a single idea. They will be combined in a simple way, as a set of phrases, centered, on the screen, one atop the other, with no effort to connect them. Although it seems quite ‘stark’ and unreal to have a paragraph or concept comprise a block of phrases with no connectives, the reality is that this structure makes the task easy for the respondent, who really ‘grazes’ for information, rather than reading the entire concept in depth. When the same task is implemented with paragraphs created in better English style, as grammatically correct paragraphs, the task becomes onerous and boring. Mind Genomics studies are generally executed on the Internet, often with respondents recruited by a panel provider specializing in the process of panel creation and deployment for research studies. For this study, the researchers entered the questions, answers, and rating scale in a program designed to run these studies. The program, BimiLeap (short for Big Mind Learning Application), mixes the answers according to an experimental design, presenting 24 combinations of elements to each respondent who participates. The entire process takes 3–5 minutes for a respondent.
Table 2. Conference, list of elements.
|
|
Question A: What is the conference topic? |
|
A1 |
teach how machines help you market and sell much better |
|
A2 |
teach you how big data about people help you sell more |
|
A3 |
marketing secrets to sell to customers |
|
A4 |
learn how find a really good customer |
|
|
Question B: What is special about the conference? |
|
B1 |
features workshop …learn practice and grow |
|
B2 |
have drinks and meals and snacks with real experts |
|
B3 |
workshop to learn technology made easy and fun |
|
B4 |
Meet interesting people who can really teach you |
|
|
Question C: Who should attend the conference? |
|
C1 |
made for new hired young folk |
|
C2 |
for students to really make them grow |
|
C3 |
business employers go to meet young potential hires |
|
C4 |
students go to meet and select mentors |
|
|
Question D: What is interesting about the conference beyond the topic? |
|
D1 |
when you leave you free technology good & gift basket |
|
D2 |
two days of fun BEFORE AND AFTER in a great location |
|
D3 |
organized around an archaeological site you can explore |
|
D4 |
near A SEASIDE TOWN IN SEASON |
The respondents were 50 Americans, 18 years or older. The respondents were provided by a panel company specializing in providing anonymous respondents for these types of studies (Luc.id, Inc.) The actual elements were created at a conference of professors and students. Each respondent evaluate a unique set of 24 vignettes, created by experimental design. The experimental design ensures that all 16 elements are statistically independent of each other, permitting the use of OLS, ordinary least-squares linear regression, to relate the presence or absence of the element to the rating. An algorithm permuted or modified the specific combinations, maintaining the underlying experimental design, but ensuring that the specific combinations different from one respondent to another [16]. The research benefit of permutation is to generate a more representative and thus a more valid model because the researchtests more of the potential mixtures of elements. That is, rather than reducing variability by testing the same limited set of combinationsmany times, and suppressing variability by averaging it out, Mind Genomics deals with variability by covering a wider array of potential test combination. Mind Genomics is statistically powerful, and conservative by design, measuring many stimuli rather than imputing from a less noisy, far less representative sample of possible vignettes.
Ratings, transformations, and averages: The original ratings were assigned on a anchored 9-point scale (1=Do not choose … 9=Choose.) The practice of Mind Genomics is to divide the rating scale into two parts. We did this division two times. The first time was ‘Choose to attend’ (1–6 transformed to 0 to denote not choose to attend; 7–9 transformed to 100 to denote choose to attend). The second time was ‘Reject’, (1–3 transformed to 100 to denote reject; 4–9 transformed to 0 to denote not reject.) The program further recorded the ‘consideration time’ (CT), operationally defined as the number of seconds between the appearance of the vignette on the screen and the respondent’s rating of the vignette on the 9-point scale.
Table 2 shows the mean ratings for the three dependent variables by key subgroups. These subgroups are total, gender, age, and the two mind-sets or clusters of respondents, with respondents in the same cluster showing similar patterns of response coefficients (see below). It is clear from Table 2 that the subgroups differ from each other in their ratings.
Table 2A. Means of the dependent variables (Accept, Reject, Consideration Time) for key subgroups.
|
|
Conference – Means of Dependent Variables |
||
|
Conference |
Attend |
Reject |
CT |
|
Total |
49 |
16 |
3.5 |
|
Male |
57 |
13 |
3.0 |
|
Female |
34 |
22 |
4.2 |
|
Young Age 21–39 |
43 |
8 |
2.9 |
|
Old Age 40+ |
51 |
20 |
3.8 |
|
Mind-Set 2A Attends for fun |
48 |
16 |
4.0 |
|
Mind-Set 2B Attends for professional reasons |
50 |
16 |
2.7 |
Males are much more likely to say ‘I will attend’ than are females (57 versus 34, meaning that 57% of the responses of males to the vignettes are 7–9, whereas only 34% of the responses of females are 7–9).
Older respondents are more likely to say I will attend than do younger respondents (51 vs 43)
Dividing the respondents into groups based upon the pattern of how elements drive ‘attend’ (i.e., mind-sets) suggest no difference in frequency of responding ‘attend,’ but as we will see, strong differences in the elements which drive them to say ‘attend.’
The differences in ‘reject’ can be interpreted in the same way.
When we measure the consideration time, we see that women take longer to respond, that older take longer to respond, and that Mind-Set 2A takes longer to respond
Thus far, all that the data has revealed is the average rating and the response time. Those measures provide some idea of the differences between groups. Furthermore, Mind Genomics provides far deeper information for the simple reason that the elements themselves are cognitively rich, having deep meaning. It is not simply the stimulus, but the fact that the stimulus can be understand in and of itself.
Modeling to show causality: The next step, this time for deeper understanding, creates a simple model or equation, relating the presence/absence of the 16 elements to the binary ratings. The regression modeling, OLS regression (ordinary least-squares) works with the full data set of respondents in the subgroup. The output is a simple linear expression relating the presence/absence of the 16 elements to the rating, after the binary transformation. The regression model lacks an additive constant, for the simple reason that in the absence of elements the respondent is not likely to either accept or reject the conference. This is called ‘regression through the origin.’
We express the equation as: Binary transformed rating = k1(A1) + k2(A2) …k16(D4)
Deep learning – total panel, age and gender: It is from the coefficients and their commonality that we learn the most about what drives ‘accept’ the conference, i.e., expect to attend. Table 3 shows the strong performing elements presented in shaded cells, and bold font. Strong performing is based upon the fact that in previous studies these coefficients are both statistically significant (from inferential statistics), and meaningful in terms of ‘real-word’ situations. When we look at the commonality of strong performing elements across elements and subgroups, we see different sets of strong-forming elements. If we had to hazard a guess about which elements are consistently strong performers, we would say that the answers to Question D (What is interesting about the conference beyond the topic?). That finding may be correct at the superficial level, but it leaves out the world of people who attend conferences to become stronger in their profession.
Table 3. Coefficients of the models relating the presence/absence of the elements to the ‘attend’ rating, after recoding
|
|
Conference – Attend |
Total |
Young (21–39) |
Old (40+) |
Male |
Fem |
|
A1 |
teach how machines help you market and sell much better |
13 |
13 |
13 |
15 |
4 |
|
A2 |
teach you how big data about people help you sell more |
3 |
3 |
5 |
5 |
-4 |
|
A3 |
marketing secrets to sell to customers |
10 |
3 |
13 |
4 |
18 |
|
A4 |
learn how find a really good customer |
15 |
13 |
17 |
10 |
20 |
|
B1 |
features workshop..learn practice and grow |
16 |
12 |
17 |
18 |
12 |
|
B2 |
have drinks and meals and snacks with real experts |
17 |
11 |
20 |
20 |
12 |
|
B3 |
workshop to learn technology made easy and fun |
14 |
8 |
17 |
16 |
10 |
|
B4 |
Meet interesting people who can really teach you |
11 |
-1 |
17 |
10 |
12 |
|
C1 |
made for new hired young folk |
5 |
11 |
2 |
15 |
-9 |
|
C2 |
for students to really make them grow |
14 |
22 |
11 |
22 |
4 |
|
C3 |
business employers go to meet young potential hires |
7 |
5 |
9 |
14 |
0 |
|
C4 |
students go to meet and select mentors |
7 |
18 |
1 |
13 |
-3 |
|
D1 |
when you leave you free technology good & gift basket |
26 |
19 |
30 |
24 |
28 |
|
D2 |
two days of fun BEFORE AND AFTER in a great location |
28 |
31 |
26 |
32 |
23 |
|
D3 |
organized around an archaeological site you can explore |
19 |
6 |
24 |
25 |
10 |
|
D4 |
near A SEASIDE TOWN IN SEASON |
24 |
29 |
21 |
28 |
22 |
Beyond the discovery of ever-present individual differences, variation in the criteria of judgment, is the postulation by Mind Genomics that for every topic of experience, no matter how ‘micro’, there are a limited number of different groups, mind-sets, metaphorically alleles or variations of genes. These mind genomes do not need to covary with the typical groupings to which we have become accustomed, e.g., age, gender, and nor even behavior and attitude, such as attending conferences.
The comparison of Mind Genomes to the science of biological genomics is, to stress the point, metaphorical. In the biological science of Genomics, the belief is that there are actual alleles that can be manipulated and reinserted into cells to change their behavior. There is the belief that these alleles have actual physical reality. In the world of Mind Genomics, the mental alleles are hypothetical constructs, patterns of decision criteria which emerge from the statistical method of clustering, a procedure in the mathematics of numerical analysis. That is, there is no belief in the physical reality of the mind genome, the mental allele, but just a convenient, and sensible group of ideas which float together.
These mind genomes or mind-sets emerge from the pattern of coefficients for the different elements, with the pattern uncovered by experimentation (our respondent study with the 50 respondents), the creation of individual-level models (made possible by the experimental design), and then the clustering individuals by the pattern of their coefficients (application of clustering, a method in numerical analysis.)
When we follow the procedure of experimentation, modeling, clustering, afterwards extracting meaningful sets of ideas or clusters, we end up with three different groups.Clustering simply places the objects (here respondents) into a set of complementary, non-overlapping groups, using mathematical criteria. The objective to minimize the number of clusters (parsimony), as well as ensure that each cluster or mind-set makes sense (interpretability). Table 4 shows the performance of all 16 elements by total, and by each of the two emergent mind-sets, i.e., emergent clusters of respondents based on the pattern of coefficients. It is clear from Table 4 that separating the mind-sets allows the strong performing elements to do far better than they do when the data from all 50 the respondents are combined to create the one group, total panel. Mind-set segmentation through clusteringremoves much of the suppression of element performance attributable to the opposing patterns of responses of different mind-sets to the same element. The countervailing forces emerge, and can be separated from each other, placed by the researcher into the different mind-sets (clusters), with the result being radically different patterns of coefficients released by the suppressing, mutually cancelling effect by the opposite mind-set.
Table 4. Performance of elements driving Choosing a Conference. Data based on the total panel and the two mind-sets.
|
|
Dependent Variable: Attend the conference |
Tot |
MS 2A |
MS2B |
|
|
Mind-Set 1 – Attends for fun |
|
|
|
|
D2 |
two days of fun BEFORE AND AFTER in a great location |
28 |
35 |
16 |
|
D4 |
near A SEASIDE TOWN IN SEASON |
24 |
32 |
12 |
|
D1 |
when you leave you free technology good & gift basket |
26 |
26 |
25 |
|
D3 |
organized around an archaeological site you can explore |
19 |
23 |
13 |
|
C2 |
for students to really make them grow |
14 |
16 |
10 |
|
|
Mind-Set 2B– Attends for professional reasons |
|
|
|
|
B2 |
have drinks and meals and snacks with real experts |
17 |
10 |
27 |
|
B3 |
workshop to learn technology made easy and fun |
14 |
8 |
23 |
|
B1 |
features workshop..learn practice and grow |
16 |
12 |
21 |
|
B4 |
Meet interesting people who can really teach you |
11 |
5 |
21 |
|
A4 |
learn how find a really good customer |
15 |
14 |
19 |
|
A3 |
marketing secrets to sell to customers |
10 |
8 |
17 |
|
|
Not strong in either mind-set |
|
|
|
|
A1 |
teach how machines help you market and sell much better |
13 |
14 |
12 |
|
C3 |
business employers go to meet young potential hires |
7 |
7 |
7 |
|
A2 |
teach you how big data about people help you sell more |
3 |
3 |
6 |
|
C1 |
made for new hired young folk |
5 |
4 |
4 |
|
C4 |
students go to meet and select mentors |
7 |
9 |
1 |
Engagement – Measurement of consideration time (CT) for conference elements: In order to identify the existence of mental processing of stimulus input, such as our elements, experimental psychologists introduced the notion of reaction time, later called response time, and now in this stage of Mind Genomics called ‘consideration time.’ The underlying notion is that longer consideration times signal that more complicated mental processing is occurring.The original measures of reaction time were done when the respondent was instructed to observe a test stimulus (see, feel, hear, taste, smell), and then report when the respondent could detect the stimulus (i.e. the stimulus was present), or report when the respondent could recognize the nature of the stimulus. The right-most column of Table 2 above presents the average consideration times (CT) for the 24 vignettes rated by each respondent in the relevant subgroups. Table 2 suggests that, on average, the time to read and rate a vignette is approximately 3.5 seconds. The younger respondents read and rate the vignettes far more quickly than do the older respondents (2.9 seconds vs 3.8 seconds). Males read and rate the vignettes far more quickly than do females (3.0 seconds vs 4.2 seconds). Finally, Mind-Set 2B (Conferences for professional development) reads and rates the vignettes far more quickly than does Mind-Set 2A (Conferences for fun), specifically 2.7 seconds versus 4.0
Knowing the consideration time tells us something about the general speed of reading and decision- making but does not tell us anything about the consideration time given to the individual elements. That consideration time is a measure of engagement of the respondent with the message. The engagement may be short or long for a variety of reasons, such as length and complexity of the message, basic ‘stickiness’ of the message to keep the respondent focused, and so forth. The respondent cannot tell the researcher which particular element in a vignette ‘engages’ attention, but through experimental design and modeling, along with a measure of response time to the entire vignette, the researcher can estimate the number of seconds that is most likely taken up by the specific element, such as a particularly provocative phrase. Systematic design reveals just what just what phrases are ‘sticky’, when they are ‘sticky,’ and with whom.
The strategy is the same as used to develop the models relating the presence/absence of the 16 elements to the rating. The analysis uses OLS (ordinary least-squares) regression to relate the presence/absence of the elements to the consideration time, measured to the nearest 10thof a second. The equation is the same, except for the dependent variable: Consideration Time (Time interval from presentation to rating) = k1(A1) + k2(A2) …k16(D4)
Table 5 suggests a different story for the commonality among the longest consideration times for the group:
Total panel –serious aspects such as workshops and mentors
Younger –mentors and growth
Older respondents – learning new technology easily and with fun
Males – workshops and mentors
Females – learn new technology, learn at the start of the career
Mind-Set 2A (Conferences are for fun) – learning new skills, then many of the professional growth elements
Mind-Set 2 B (Conferences are for professional development) – no elements show unusually long engagement. Equal attention is paid to all elements
Table 5. Consideration time for all elements by total panel and key subgroups (conference).Element coefficients of 1.2 seconds or higher are shown in shaded cells.
|
|
Consideration Time for each element |
Tot |
Young (21–39) |
Old (40+) |
Male |
Fem |
MS 2A- Fun |
MS2B – Prof. Development |
|
B3 |
workshop to learn technology made easy and fun |
1.5 |
1.0 |
1.8 |
1.0 |
2.4 |
1.7 |
1.1 |
|
B1 |
features workshop …learn practice and grow |
1.3 |
1.1 |
1.3 |
1.3 |
1.3 |
1.5 |
0.8 |
|
C2 |
for students to really make them grow |
1.2 |
1.4 |
1.2 |
0.8 |
1.6 |
1.4 |
1.0 |
|
C4 |
students go to meet and select mentors |
1.2 |
1.4 |
1.1 |
1.2 |
1.1 |
1.5 |
0.6 |
|
D2 |
two days of fun BEFORE AND AFTER in a great location |
1.2 |
1.1 |
1.3 |
1.1 |
1.4 |
1.5 |
0.7 |
|
B2 |
have drinks and meals and snacks with real experts |
1.2 |
0.9 |
1.2 |
1.1 |
1.3 |
1.3 |
1.1 |
|
C3 |
business employers go to meet young potential hires |
1.1 |
1.1 |
1.2 |
0.9 |
1.4 |
1.3 |
0.9 |
|
C1 |
made for new hired young folk |
1.0 |
0.7 |
1.2 |
0.6 |
1.6 |
1.3 |
0.6 |
|
D3 |
organized around an archaeological site you can explore |
0.9 |
0.8 |
1.0 |
0.6 |
1.2 |
1.0 |
0.7 |
|
A3 |
marketing secrets to sell to customers |
0.8 |
0.2 |
1.1 |
0.8 |
0.9 |
0.7 |
1.1 |
|
D1 |
when you leave you free technology good & gift basket |
0.8 |
0.7 |
0.9 |
0.7 |
1.1 |
0.8 |
0.8 |
|
D4 |
near A SEASIDE TOWN IN SEASON |
0.8 |
0.7 |
0.9 |
0.5 |
1.2 |
1.0 |
0.6 |
|
B4 |
Meet interesting people who can really teach you |
0.8 |
0.5 |
0.9 |
0.7 |
0.9 |
0.9 |
0.7 |
|
A1 |
teach how machines help you market and sell much better |
0.8 |
0.6 |
0.8 |
1.0 |
0.6 |
0.9 |
0.6 |
|
A2 |
teach you how big data about people help you sell more |
0.7 |
0.6 |
0.8 |
0.8 |
0.9 |
0.8 |
0.7 |
|
A4 |
learn how find a really good customer |
0.7 |
0.5 |
0.7 |
0.8 |
0.7 |
0.8 |
0.4 |
Study 2 – ‘Selling a political candidate’
If the topic of conferences is of interest to academics and to those sponsoring conferences, in contrast, the topic of political candidates and their messaging is of interest to virtually everyone, or almost everyone, especially in elections where two or more sides, radically opposite, vie for power. Furthermore, election and the messaging of the candidates must address the many different dimensions on which a candidate can appeal to her or his audience, and the many different facets, the granularity of each dimension, that must somehow be considered
More than 80 years ago, the mind of the voter was already of interest [17], but of course one could go back centuries to Machiavelli, to Aristotle, and to Plato for even older points of view. These philosophers talked a great deal about citizens and their leaders. Many of their points, including appeal to emotion, hold today. One need only read Machiavelli’s ‘Prince,’ Aristotle’s ‘Politics’ or Plato’s ‘Dialogue’ to see the politics of today presented by the eminent thinkers of the past. Today’s world works with tools taken from marketing, attempting to persuade people to vote in the same way one might persuade people to buy toothpaste [18]. There is a great deal of effort put in by consultants, polling organizations, and so forth to identify messages which at once most strongly resonate with the electorate, as well as being appropriate, realistic, and believable. Despite the best efforts of marketers to provide honest data, perhaps somewhat copy-edited (‘massaged’), today’s political messaging is believed a lot less than was the case years and decades before [19].
Marketing theory has also entered political messaging and polling. The notion of inward vs outward orientation in the mind of a consumer has been applied to an Australian election, revealing the application of this construct to election messaging [20].This inward versus outward orientation more clearly focuses on what affects the voter, and moves beyond the more tradition of description of one’s behavior, such as mudslinging, defined both as allegations about the candidate’s family, but also references to an opponent’s voting record, broken campaign promises, rumors on health and financial dealings, and the use of harsh language.
More recent approaches to studying political communication focus on how to legitimize one’s point of view, and not just to convince the voter based upon one or two key points. Legitimizing one’s point of view is akin to building one’s brand, again recognizing the mind of marketing, as it enters the political arena [21] discussed the political communication as exemplified by George Bush and by Barack Obama, when they had already won the election, and were trying to convince the electorate about their efforts of the war on terror, in 2007 and 2009. In Reye’s words, ‘strategies of legitimization can be used individually or in combination with others and justify social practices through: (1) emotions (particularly fear), (2) a hypothetical future, (3) rationality, (4) voices of expertise and (5) altruism.’By 2010, the marketing concepthad entered the world of communication. The five strategies, or motivations for message, just above, would be quite familiar to today’s marketer. The final aspect making a study of political messaging interesting is the increasing importance of social media on the political process. Research published almost a decade ago suggest that in the early years of social media the interplay of social media and political viewpoint was not particularly strong [22]. Kim’s words of a decade ago can be contrasted with the emergence of political messaging in the form both of real news and of fake news. It is worthwhile quoting Kim’s now-passe language, quite important in 2011, and probably based upon research conducted the year or two before. It would hard to substantiate Kim’s words today, as of this writing.
The increasing popularity of social network sites (SNSs) has raised questions about the role of social network media in the democratic process. This study explores how use of SNSs influences individuals’ exposure to political difference. The findings show a positive and significant relationship between SNSs and exposure to challenging viewpoints, supporting the idea that SNSs contribute to individuals’ exposure to cross-cutting political points of view. Partisanship was not found to interact with SNS use, suggesting that SNSs contribute to expanding exposure to dissimilar political views across individuals’ partisanship. Online political messaging also has a direct effect on exposure to dissimilar viewpoints, and it mediates the association between SNSs and exposure to cross-cutting political views. (Bold added for emphasis)
Specifics of the candidate study: The principles underlying the Mind Genomics studies remain the same, no matter what the topic. The second study, done around the same time concerned a political candidate, of an unnamed political party. The respondents were US adults, recruited by the same company as the respondents in Study 1 on ‘selling a conference.’
The key differences in the two studies were the topic, the elements (Table 6), and the use of a 5-point scale, rather than a 9-point scale for the scale. For the rating of ‘win’, the 5-point scale was transformed to the binary values of 0 (ratings 1–3), and 100 (ratings 4–5). For the rating of ‘lose,’ the 50point scale was transformed the binary value of 100 (ratings 1–2), and 0 (ratings 3–5). All modeling was done using the binary scale, not the original scale.
Table 6. Candidate – List of elements
|
|
Question A: What is the situation of the country? |
|
A1 |
The country has economic problems |
|
A2 |
The people are skeptical about politics in general |
|
A3 |
The country is experiencing political instability |
|
A4 |
The people suffer from unemployment |
|
|
Question B: Describe the candidate’s personality. |
|
B1 |
He/she is rightfully egocentric |
|
B2 |
He/she concerned about people well-being |
|
B3 |
He/she has a vision to develop the country |
|
B4 |
He/she is going to be the people’s voice in government |
|
|
Question C: How does the candidate draws people to himself/herself? |
|
C1 |
He/she is always on tv |
|
C2 |
He/she has been active all the time not only during the campaign |
|
C3 |
He/she listens to people personally |
|
C4 |
He/she talks about own achievement |
|
|
Question D: How does the candidate call to action? |
|
D1 |
He/she is a role model |
|
D2 |
He/she tell others to do his/her job |
|
D3 |
He/she corrupts people for vote |
|
D4 |
He/she doesn’t care about acting at all |
Table 7 give a sense of the response patterns for the different vignettes, across the different groups. What is most interesting is that when the topic is political, something serious and relevant to the respondents, the consideration time is a second longer than the consideration time for the conference (3.5 seconds for the conference, 4.4 seconds for the candidate.) The experimental design is the same, the elements are approximately of the same size, but the respondents spend more time reading. This pattern, longer consideration times for important topics, has continued to emerge again and again in experiments by author Moskowitz (unpublished data)
Table 7. Means of the dependent variables (Accept, Reject, Consideration Time) for key subgroups
|
|
Candidate – Means of Dependent Variables |
||
|
Candidate |
Vote For |
Vote Against (1–2à 100) |
Consideration Time |
|
Total |
37 |
35 |
4.4 |
|
Young (21–39) |
34 |
34 |
3.9 |
|
Old (40+) |
38 |
35 |
4.8 |
|
Male |
31 |
36 |
4.2 |
|
Female |
41 |
34 |
4.7 |
|
MS2C – Protect |
26 |
36 |
4.5 |
|
MS 2D – Develop |
44 |
34 |
4.4 |
Table 8 shows the results for Total, Age and Gender, respectively.
Table 8. Performance of elements driving Choosing a Conference. Data based on the total panel, age and gender, respectively.
|
|
|
Tot |
Young (21–39) |
Old (40+) |
Male |
Female |
|
A1 |
The country has economic problems |
8 |
13 |
6 |
20 |
-1 |
|
A2 |
The people are skeptical about politics in general |
13 |
20 |
10 |
17 |
10 |
|
A3 |
The country is experiencing political instability |
15 |
21 |
11 |
21 |
11 |
|
A4 |
The people suffer from unemployment |
15 |
15 |
16 |
22 |
10 |
|
B1 |
He/she is rightfully egocentric |
12 |
9 |
14 |
12 |
12 |
|
B2 |
He/she concerns about people’s well-being |
20 |
17 |
23 |
17 |
23 |
|
B3 |
He/she has a vision to develop the country |
19 |
24 |
17 |
20 |
18 |
|
B4 |
He/she is going to be the people’s voice in government |
20 |
18 |
22 |
20 |
21 |
|
C1 |
He/she is always on tv |
4 |
2 |
4 |
0 |
7 |
|
C2 |
He/she has been active all the time not only during the campaign |
14 |
17 |
11 |
9 |
19 |
|
C3 |
He/she listens to people personally |
20 |
18 |
21 |
12 |
27 |
|
C4 |
He/she talks about own achievement |
0 |
-8 |
4 |
-3 |
3 |
|
D1 |
He/she is a role model |
21 |
17 |
24 |
12 |
28 |
|
D2 |
He/she tell others to do his/her job |
-4 |
-14 |
2 |
-9 |
-1 |
|
D3 |
He/she corrupts people for vote |
-6 |
-7 |
-5 |
-13 |
-2 |
|
D4 |
He/she doesn’t care about acting at all |
1 |
-3 |
2 |
-13 |
10 |
The key drivers for winning are the personal characteristics of the candidate, especially the care about the people and being a role model.
He/she concerned about people well-being
He/she has a vision to develop the country
He/she is going to be the people’s voice in government
He/she concerns about people well-being
He/she has a vision to develop the country
He/she is going to be the people’s voice in government
Some key differences emerge, mostly in terms of degree
Men are concerned about the situation in the country
Women are concerned about the candidate ‘being involved’
Younger respondents do not like a boastful, dominating person who tells others what to do. In contrast, older respondents don’t care. This is a subtle but an importance difference between different age cohorts, representing an emerging sensitivity to ‘authenticity’
Applying the clustering approach to the 50 coefficients generates two clearly different, and interpretable mind-sets, shown in Table 9. Mind-Set 1 responds to the candidate as a leader in the unstable times. Mind-Set 2 responds to the candidate as a nation builder.
Table 9. Performance of elements driving voting for a candidate. Data based on the total panel and the two mind-sets.
|
|
|
Tot |
MS2C |
MS2D |
|
|
Mind-Set 2C – Candidate as a leader |
|
|
|
|
A2 |
The people are skeptical about politics in general |
13 |
21 |
6 |
|
A3 |
The country is experiencing political instability |
15 |
19 |
11 |
|
D1 |
He/she is a role model |
21 |
19 |
24 |
|
|
Mind-Set 2D – Candidate as nation builder |
|
|
|
|
B3 |
He/she has a vision to develop the country |
19 |
-2 |
35 |
|
B2 |
He/she concerns about people’s well-being |
20 |
5 |
31 |
|
B4 |
He/she is going to be the people’s voice in government |
20 |
7 |
29 |
|
B1 |
He/she is rightfully egocentric |
12 |
-2 |
23 |
|
C3 |
He/she listens to people personally |
20 |
15 |
22 |
|
|
Elements not strongly motivating to either mind-set |
|
|
|
|
A4 |
The people suffer from unemployment |
15 |
15 |
14 |
|
C2 |
He/she has been active all the time not only during the campaign |
14 |
13 |
14 |
|
D4 |
He/she doesn’t care about acting at all |
1 |
-1 |
5 |
|
A1 |
The country has economic problems |
8 |
15 |
3 |
|
C1 |
He/she is always on tv |
4 |
7 |
0 |
|
D2 |
He/she tell others to do his/her job |
-4 |
-7 |
0 |
|
D3 |
He/she corrupts people for vote |
-6 |
-5 |
-6 |
|
C4 |
He/she talks about own achievement |
0 |
7 |
-7 |
We finish the detailed analyses of the by looking at the consideration time attributable to each element. Recall from the previous analysis of conferences that the form of the model for consideration time comprised a simple linear model, without an additive constant. The experimental design for this study of a candidate is precisely the same as the experimental design for the study of a conference, namely 24 vignettes comprising 2–4 elements per vignette. When we deconstruct the contribution of each element to consideration time (Table 10) we find that virtually all but three of the consideration times are 1.0 second or longer, several twice as long at 2.0 and 2.1 seconds. Thus, the topic itself, is a major driver of consideration time, a subject to be explored more fully. There is no clear pattern of covariation between the response time and who the respondent is, except that the younger respondents show somewhat shorter consideration times, very much shorter for descriptions of the candidate’s personal behavior (e.g., C1 and C4.)
Table 10. Consideration time for all elements by total panel and key subgroups (conference)
|
|
Consideration time for each element: Election of a candidate |
Tot |
Age 20–39 |
Age 40 Plus |
Male |
Female |
MS1 Political leader |
MS2 Builder |
|
D4 |
He/she doesn’t care about acting at all |
2.0 |
2.0 |
2.0 |
2.0 |
2.0 |
1.5 |
2.4 |
|
C2 |
He/she has been active all the time not only during the campaign |
2.0 |
1.8 |
2.0 |
2.2 |
1.8 |
2.0 |
1.9 |
|
B4 |
He/she is going to be the people’s voice in government |
1.9 |
1.5 |
2.1 |
1.9 |
1.9 |
1.8 |
2.0 |
|
A4 |
The people suffer from unemployment |
1.9 |
1.8 |
1.9 |
1.7 |
2.0 |
2.2 |
1.7 |
|
B1 |
He/she is rightfully egocentric |
1.8 |
1.8 |
1.9 |
2.0 |
1.6 |
1.9 |
1.7 |
|
C3 |
He/she listens to people personally |
1.7 |
1.0 |
2.1 |
1.9 |
1.6 |
1.9 |
1.6 |
|
B3 |
He/she has a vision to develop the country |
1.7 |
1.2 |
2.1 |
1.9 |
1.6 |
1.9 |
1.6 |
|
A2 |
The people are skeptical about politics in general |
1.7 |
1.3 |
1.8 |
1.5 |
1.8 |
1.9 |
1.5 |
|
A1 |
The country has economic problems |
1.7 |
1.7 |
1.7 |
1.6 |
1.8 |
1.8 |
1.6 |
|
D3 |
He/she corrupts people for vote |
1.6 |
1.6 |
1.6 |
1.3 |
1.8 |
1.4 |
1.8 |
|
C4 |
He/she talks about own achievement |
1.6 |
0.9 |
1.9 |
1.7 |
1.5 |
1.9 |
1.4 |
|
C1 |
He/she is always on tv |
1.6 |
0.7 |
2.0 |
1.8 |
1.4 |
1.8 |
1.5 |
|
B2 |
He/she concerns about people’s well-being |
1.6 |
1.3 |
1.8 |
1.7 |
1.5 |
1.7 |
1.4 |
|
A3 |
The country is experiencing political instability |
1.6 |
1.4 |
1.7 |
1.3 |
1.8 |
1.6 |
1.5 |
|
D1 |
He/she is a role model |
1.5 |
1.6 |
1.4 |
1.3 |
1.6 |
1.4 |
1.6 |
|
D2 |
He/she tell others to do his/her job |
1.4 |
1.3 |
1.5 |
0.9 |
1.8 |
1.2 |
1.5 |
Who belongs to these mind-sets, and how to discover them
The mind-sets for both the conference and the candidate make sense. Yet, a standard cross tabulation of membership in the mind-set versus the standard classifications of gender and age suggest that the mind-sets do not divide simply across easy-to-measure subgroups based upon who a person IS. Table 11 shows the cross tabulation of mind-set membership versus age and gender. There is no clear relation. Indeed from author Moskowitz’s experience, except for the most obvious of cases (e.g., age versus concern with problem of dying), the relation between the way a person thinks and who the person IS appears to be tenuous at best. Furthermore, even asking a person about general thoughts regarding a topic does not suffice to place a person into a mind-set
Table 11. Two-way table showing the relation between membership in a mind-seg (column) and both age and gender, respectively.
|
Conference |
Total |
MS2A: Fun Seeker |
MS2B: Prof. Development |
|
Total |
39 |
25 |
14 |
|
Male |
22 |
15 |
7 |
|
Female |
17 |
10 |
7 |
|
Age 23–39 |
11 |
9 |
2 |
|
Age 40+ |
28 |
16 |
12 |
|
Candidate |
Total |
MS2C: Political Leader |
MS2D: Nation Builder |
|
Total |
54 |
23 |
31 |
|
Male |
25 |
13 |
12 |
|
Female |
29 |
10 |
19 |
|
Age 23–39 |
19 |
7 |
12 |
|
Age 40+ |
35 |
16 |
19 |
A new way be developed to probe membership in a group defined by the specifics or granular aspects of the way a person thinks about a topic. Conferences and candidates are large subjects. The mind-sets which emerge are limited to the topic revolving around questions and answers investigated in the Mind Genomics study. It may well be that the easiest way to discover the membership of a person in a mind-set segment is to accept the fact that the mind-set segment is granular at best. That ‘best’ may be to assign a new person to the granular-based mind-set uncovered in the Mind Genomics experiment. Authors Gere and Moskowitz have created an algorithm based on the separation of the mind-sets across the 16 elements. Using a Monte-Carlo simulation, they identified a set of six elements, the pattern of binary answers to which, suggest membership in one mind-set or the other. Figure 1 shows the PVI, the personal viewpoint identifier, emerging from this exercise.
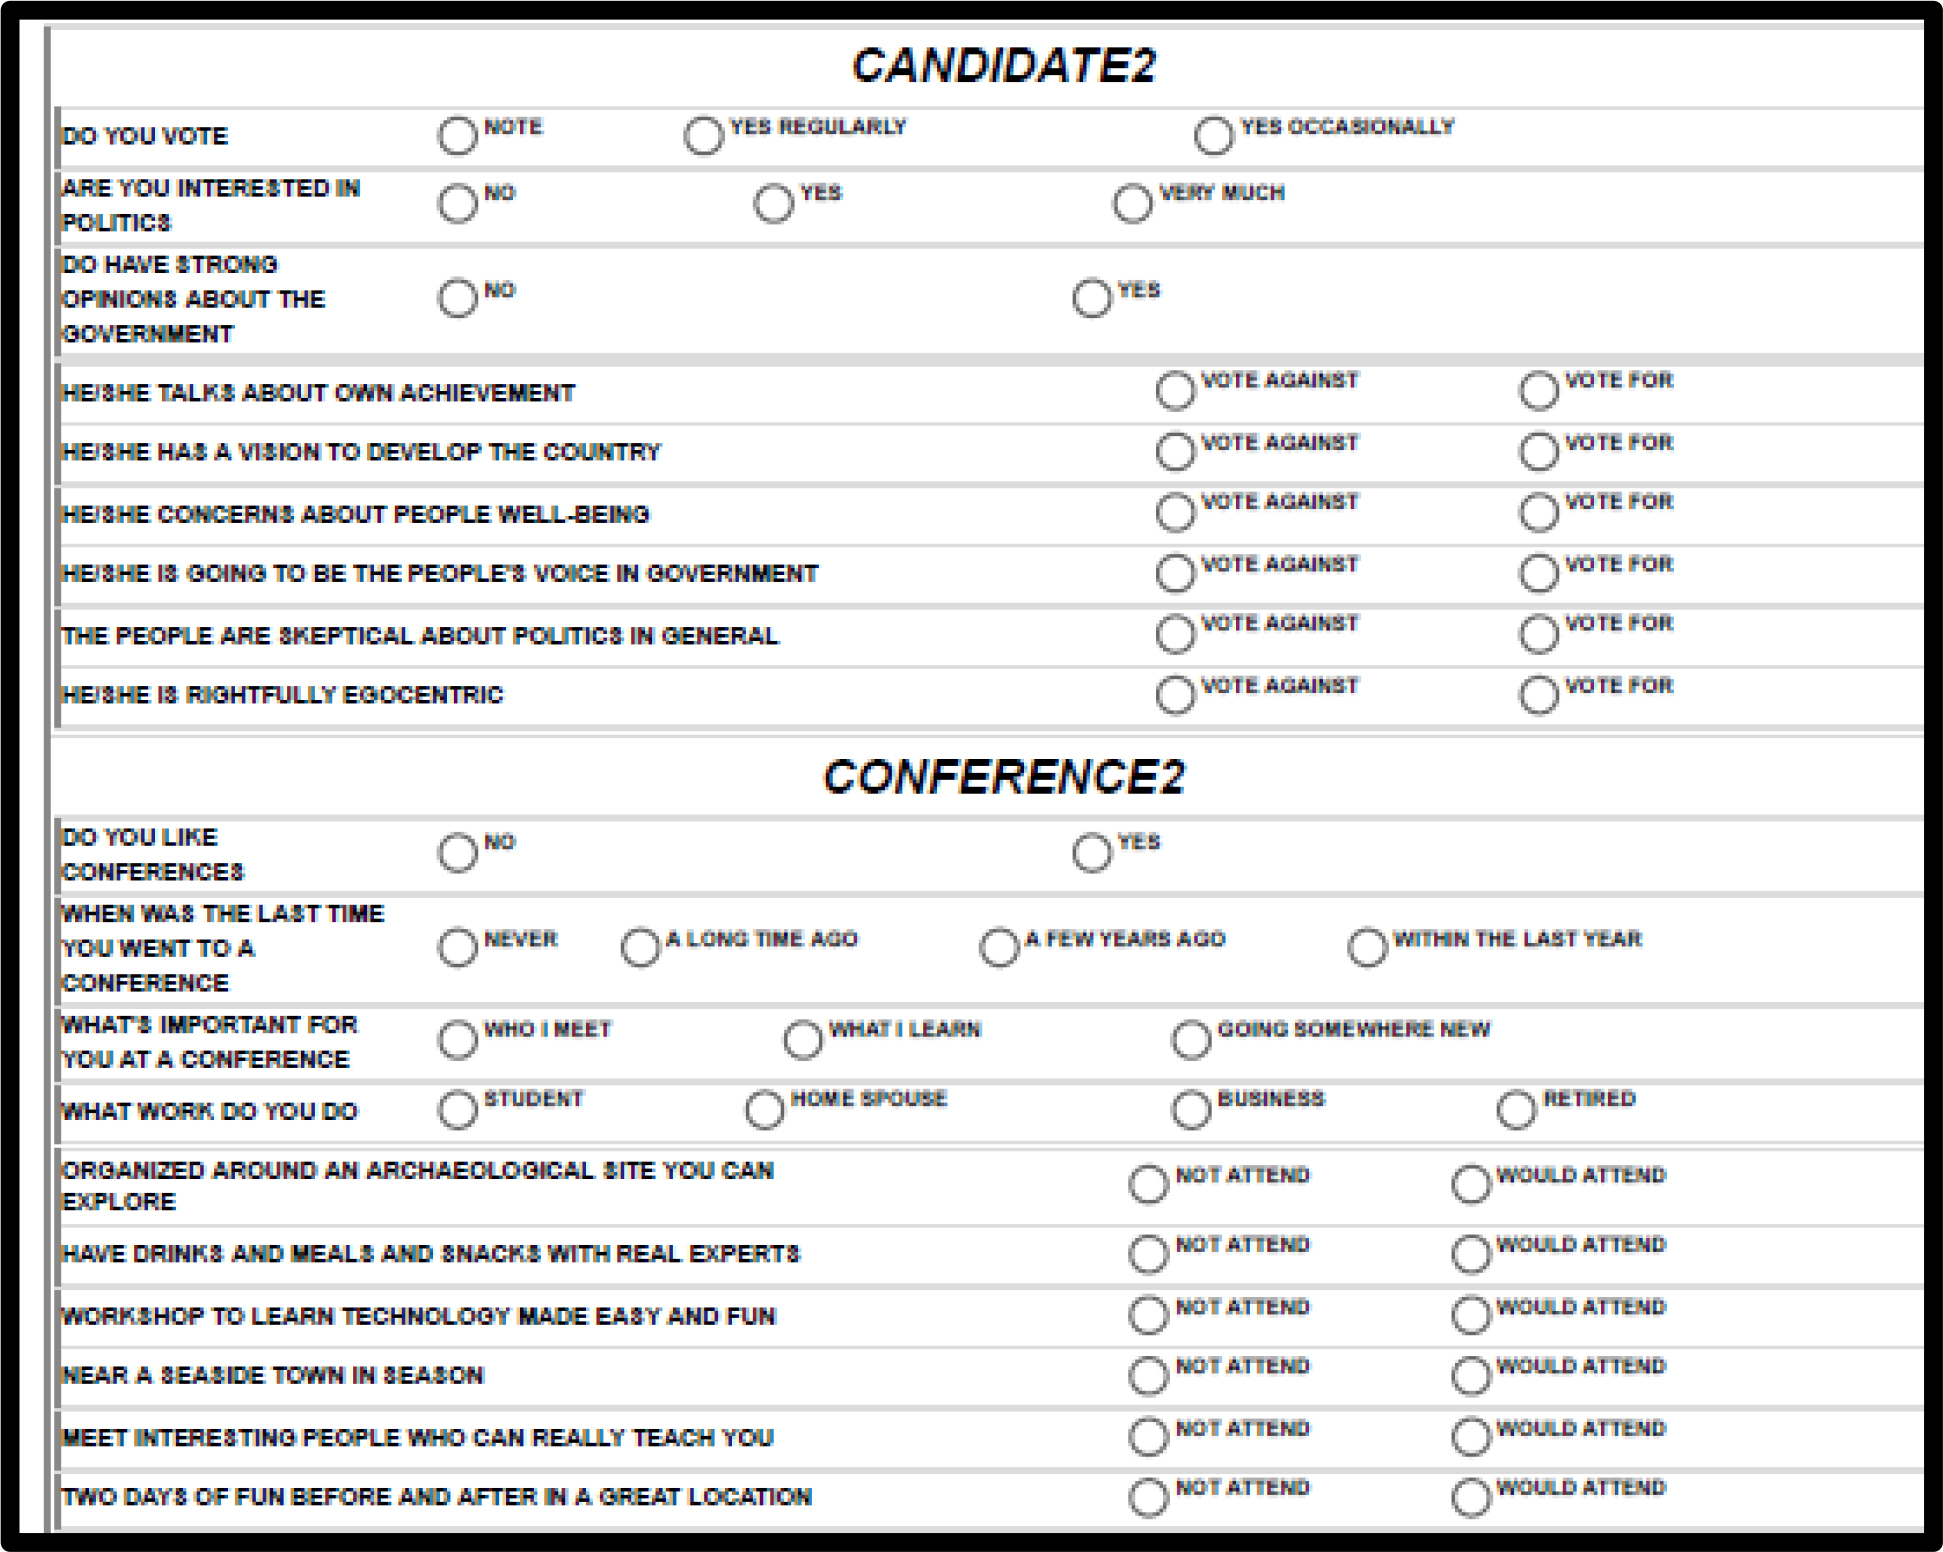
Figure 1. The PVI (personal viewpoint identifier), comprising six questions for each topic. The pattern of answers assigns a respondent to one of the two mind-sets.
Discussion
The typical study of a topic involves a few stimuli, rarely varied systematically, but evaluated by many people, respondents in the world of public opinion polling and consumer research, subjects or observers in the world of psychology. The objective of these studies is typically to confirm a hypothesis. The use of large numbers of respondents has become sacrosanct in many areas of science, for the simple reason that with these large number of respondents the sampling distribution of ratings is more precise, with smaller standard errors. Mind Genomics as presented here provides the researcher with a different strategy. Rather than being developed within the constraints and world-view of the traditional world of the ‘hypothetico-deductive,’ Mind Genomics approaches the topic by exploring a wide, albeit feasible, range of alternative aspects, evaluated by the respondent in formats, vignettes, simulating a more typical way that nature presents information to people, namely in the form of mixtures. The systematic variation of the composition of these mixtures by experimental design allow the researcher to pick out the operative variables to which the respondent attends.
As we review the process of the two studies, we come upon the following key factors which differentiate Mind Genomics studies from other studies of the same topic:
Mind Genomics studies focus on the mind of the respondent, weaving a story, but without having the respondent elaborate and tell the story. Qualitative research focuses on the mind of the respondent as well but requires that the respondent participate in a dialog. The experienced researcher, like an experienced therapist, may pull out underlying motives, thoughts, defenses, and biases, but the researcher should be experienced must shunt aside presuppositions. In contrast, Mind Genomics, attempting the same outcome, works with responses to cognitively rich expressions, the elements, not chosen by the respondent, but by the researcher. Mind Genomics studies can be executed more rapidly, more generally, and more cost-effectively. What Mind Genomics lacks, however, is the skilled interpretation, when such skill exists. Mind Genomics studies can be likened to the MRI of the Mind. Each individual Mind Genomics study creates 24 vignettes for each respondent, with the vignettes differing from respondent to respondent. Thus, in one Mind Genomics study with 30 respondents, we deal with 720 different snapshots of the same problem. One need not know the ‘correct’ or best combinations to test. Mind Genomics studies create, metaphorically, a realistic ‘picture’ of the topic from which one can discover new things or reaffirm hypotheses and conjectures which seem simplistic after the fact, but hard to confirm ahead of time.
We have illustrated two different studies and show slightly different dynamics of each. The speed and ease of a Mind Genomics study makes it possible to execute one or two studies a day and create a rich library of knowledge about any topic involving the decision of a respondent when faced with various pieces of information. A science of such decision rules, appropriate indeed and archives, may constitute a new direction for sciences of the mind, and of society.
Acknowledgement
Attila Gere wishes to acknowledge and thank the Premium Postdoctoral Research Program of the Hungarian Academy of Sciences.
References
- Box GEP, Hunter WP, Hunter JS (1978) Statistics for experimenters, New York, John Wiley.
- Moskowitz HR (2012) ‘Mind genomics’: The experimental, inductive science of the ordinary, & its application to aspects of food & feeding. Physiology & Behavior 107: 606–613. [Crossref]
- Moskowitz HR, Gofman A, Beckley J, Ashman H (2006) Founding a new science: Mind Genomics. Journal of Sensory Studies 21: 266–307.
- Ryan M, Farrar S (2000) Using conjoint analysis to elicit preferences for health care. Bmj 320: 1530–1533. [Crossref]
- Stevens R, Bressler M, Silver L (2016) Challenges in marketing academic conferences: a pilot study. Services Marketing Quarterly 37: 200–207.
- Parker BJ (2007) What makes a professional conference worth attending? Strategic Finance 88: 13.
- Cherrstrom CA (2012) Making connections: Attending professional conferences. Adult Learning 23: 148–152.
- Mair J, Frew E (2018) Academic conferences: a female duo-ethnography. Current issues in Tourism 21: 2152–2172.
- November P (2004) Seven reasons why marketing practitioners should ignore marketing academic research. Australasian Marketing Journal 12: 39–50.
- Nyilasy G, Reid LN (2007) The academician–practitioner gap in advertising. International Journal of Advertising 26: 425–445.
- Anderson L, Anderson T (2010) Online professional development conferences: An effective, economical & eco-friendly option. Canadian Journal of Learning & Technology 11: 35.
- Rogers T, Davidson R (2015) Marketing destinations & venues for conferences, conventions & business events. Routledge.
- Hughes T, Bence D, Grisoni L, O’regan N, Wornham D (2011) Scholarship that matters: Academic–practitioner engagement in business & management. Academy of Management Learning & Education 10: 40–57.
- Gardner SK, Barnes BJ (2007) Graduate student involvement: Socialization for the professional role. Journal of College Student Development 48: 369–387.
- Mata H, Latham TP, Ransome Y (2010) Benefits of professional organization membership & participation in national conferences: Considerations for students & new professionals. Health Promotion practice 11: 450–453.
- Gofman A, Moskowitz H (2010) Isomorphic permuted experimental designs & their application in conjoint analysis. Journal of Sensory Studies 25: 127–145.
- Herring EP (1938) How does the voter make up his mind? Public Opinion Quarterly 2: 24–35.
- Harris P, Lock A (2010) “Mind the gap”: the rise of political marketing & a perspective on its future agenda. European Journal of Marketing 44: 297–307.
- Brants K, Voltmer K (2011) Introduction: Mediatization & de-centralization of political communication. In: Political Communication in Postmodern Democracy, 1–16 Palgrave Macmillan, London.
- O’Cass A (2001) The internal-external marketing orientation of a political party: social implications of political party marketing orientation. Journal of Public Affairs: An International Journal 1: 136–152.
- Reyes A (2011) Strategies of legitimization in political discourse: From words to actions. Discourse & Society 22: 781–807.
- Kim Y (2011) The contribution of social network sites to exposure to political difference: The relationships among SNSs, online political messaging, and exposure to cross-cutting perspectives. Computers in Human Behavior 27: 971–977.
- Stewart CJ (1975) Voter perception of mud-slinging in political communication. Communication Studies 26: 279–286.