Abstract
Stabilisation splints (S.S.) are one of the most commonly used tools in the treatment of temporomandibular disorders (TMD), bruxism or both.
The T Scan III computerised occlusal analysis technique accurately displays the sequence of occlusal contacts in closing and excursion movements and allows for the quantification of occlusion and disclusion times and the distribution of percentages of occlusal forces in the arch.
This study aims to assess the changes that occur in occlusion after the installation of a stabilisation splint.
A sample of 42 patients who attended the UCM Temporomandibular Disorders and Orofacial Pain Specialist Clinic was selected. These were diagnosed with TMD, myofascial pain and or sleep bruxism and treated with stabilisation splints (S.S.).
Records were taken in maximum intercuspation, right and left laterality, and in protrusion before and after installation of the stabilisation splint.
After the installation of the stabilisation splint, there was a decrease in occlusion and disclusion times. This difference was statistically significant in occlusion times at maximum intercuspation and disclusion movements of right and left laterality and protrusion.
As for the percentage of force, the right and left dental arch tend to be balanced after the installation of an S.S. The same is true between the premolar and molar sectors.
In conclusion, stabilisation splints produce significant changes in occlusion when analysing disclusion times in right, left laterality and protrusion movement. Stabilisation splints tend to balance occlusion forces between the premolar and molar sectors and between the two dental arches.
Keywords
T scan III system, Stabilisation splints (SS), Temporomandibular disorder (TMD)/bruxism
Introduction
TMDs are a subgroup of craniofacial pain problems involving the temporomandibular joint (TMJ), masticatory muscles and musculoskeletal structures of the head and neck. Symptoms related to TMDs predominate in young adults and women, with a ratio of females to males of up to 4:1, according to some studies [1].
Bruxism is a common disorder characterized by involuntary squeezing or grinding of the teeth, due to repetitive activity of the chewing muscles. Prevalence ranges from 8 to 31% [2].
Bruxism, as a whole, correlates positively with the presence of TMD pain [3]. Its role, however, in the aetiology of pain in TMDs is relatively unknown. Awake bruxism and sleep bruxism have been observed to have a different association with pain in TMDs [4]. Observational studies by Rossetti 2008 showed that awake bruxism is a greater risk factor for developing myofascial pain in TMDs than sleep bruxism [5] Conversely, Blanco Aguillera et al. and Fernandes et al. found that the pain in TMDs was associated with the sleep bruxism [6].
There are many studies on different aspects of TMDs, bruxism and myofascial pain. Few, however, have objectively evaluated the changes a stabilising splint produces in occlusion to facilitate good orthopaedic stability. In this sense, computerised systems that allow dentists to record these changes dynamically have been available to them for years.
Maness developed the T-Scan system for computer occlusal analysis in 1987, which performs real-time measurements of occlusal force percentages using an intraoral sensor.
Digital occlusal analysis (T-Scan III, Version 8, Tekscan, Inc. S. Boston, MA, USA) provides measurable variations in occlusion time and force percentages, accurately showing the occlusal contact sequence in closing and excursion movements [7]. This T-Scan system detects whether an occlusal force in one tooth, within a set of opposite dental contacts, is greater than, equal to, or less than the occlusal forces that occur in other teeth. It provides, with great precision, the force of occlusal contacts by providing qualitative and quantitative data.
The T-Scan is also a dynamic record, in which mouth closure is recorded in real-time from the initial contact to the maximum intercuspation (MIP) and also the excursion movements initiated from the MIP [7,8].
A complete occlusal analysis with T-Scan can detect abnormalities in the centring and intensity of occlusal forces, showing functional asymmetry that can be related to muscle dysfunction.
Physiological occlusion of maximum orthopaedic stability, which is the desired objective with an occlusal splint, must include several characteristics, such as; 1. There must be simultaneous bilateral contacts during mandibular closure in maximum intercuspation; 2. There must be disclusion of all back teeth during excursion mandibular movements; and 3. There should be no premature contact when the jaw is closed in a stable musculoskeletal position.
Until the development of T-Scan technology, recording of occlusion and disclusion sequence had not been possible, and therefore its times could not be accurately measured. Instead, clinicians had other methods for determining simultaneous contacts, such as observing the distribution and size of joint paper marks along the dental arches with the teeth in contact or listening to the sound of tooth contact and subsequent disclusion. The T-Scan I was the first device capable of measuring occlusal contact time in fractions of 0.01 seconds [9].
This study is designed to answer the following question: To what extent do stabilisation splints optimise occlusal forces and redistribute them in the dentition of patients with any or all of the following conditions; TMD, bruxism, myofascial pain?
Records obtained with the T-Scan III Computer Occlusal Analysis System have been objectively and dynamically analysed and evaluated in patients with TMD or bruxism or both, both in maximum intercuspation, right/left laterality, and protrusive motion, before and after inserting a stabilisation splint.
Material and Method
This study is a cross-sectional analysis of records with and without a splint, in which the medical history and computerised occlusal analysis of an individual patient before and after the installation of a stabilisation splint are evaluated.
A sample of 42 patients who attended our faculty’s Temporomandibular Disorders and Orofacial Pain Specialist Clinic was selected. These were diagnosed with one, various or all of the following; temporomandibular muscle disorders, myofascial pain, sleep bruxism. They, therefore, required treatment with stabilisation splints.
The selection method was by a non-probabilistic sampling of consecutive cases seeking maximum randomness. A previous study was conducted to determine the mean sample size, taking into account epidemiological studies estimating that approximately 5% of the population suffers from TMDs. It was determined that 37.24 records were required to be within acceptable margins of error and confidence level. A 95% confidence level was assumed.
Subjects over the age of 18 of both sexes, suffering from either or; muscular TMD, night bruxism, and ‘grinding’ patients, were included. All were informed about the purpose of the study and signed the informed consent. This study was supported by the Ethical Committee for Clinical Research of the San Carlos Clinical Hospital. ANNEX.
A specific and detailed medical history of TMD was made, following DC/TMD [10] criteria, and a Paesani questionnaire was filled out to detect bruxism [11]. Once the splint had been made and tested, the T-Scan III records were taken, first without the splint and then after placement in the patient’s mouth.
The computerised occlusal analysis technique, T-Scan (T-Scan III for Windows, Tekscan Inc., South Boston, MA), allows the clinician to quantitatively evaluate occlusal contacts and record occlusion during continuous jaw movement [12].
Each patient’s personal data is entered; the graph for each patient’s upper dental arch will thus be customised. The mesiodistal diameter of the central incisive allows us to extrapolate this diameter to all the teeth of the arch. Four records will be taken in maximum intercuspation, right laterality, left laterality and one last recording in protrusion. All these records are taken prior to the installation of the splint and are registered again with the splint installed.
The program processes the data and displays the charts in 3D or 2D (Figure 1).
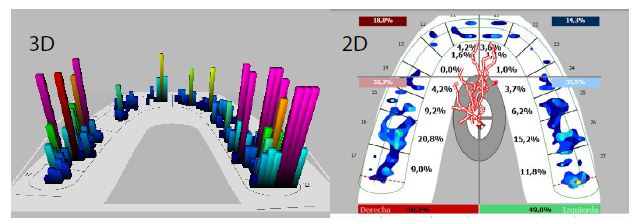
Figure 1: Below is the “Force vs. Time” graph. This graph illustrates the change in occlusal force percentages over time, both in the middle of the left arch (green line) and in the middle of the right arch (red line). The horizontal axis of the Force vs. Time graph indicates the elapsed time, while the vertical axis indicates the change in the percentage of occlusal forces on both sides of the dental arch. The total force of the combined left and right arch halves is shown in the Force vs. Time graph in the black line.
In the 3D graphics, registered contacts are displayed as different colour and height columns that quantify the intensity of the forces generated in the occlusion.
The 2D graphics show the halves of the right and left arch, which are outlined in green for the left side and red for the right, they also show the percentages of force of each dental arch, and by sector (Figure 2).
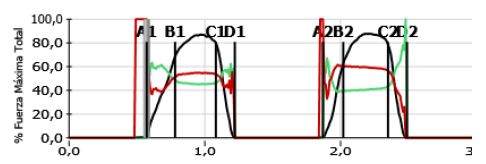
Figure 2: Force vs. Time Graph
A: Represents the start of occlusal contact.
B: Displays when all teeth go into intercuspation during closing.
A.B.: Time elapsed between initial tooth contact and maximum intercuspation. This is represented as occlusion time (O.T.) and should ideally be below 0.2 s;
B.C.: Is the time elapsed when teeth begin intercuspation during closing.
C: Represents the beginning of disclusion.
CD: Represents disclusion time (DT). During the tour, the D.T. should be less than 0.4 s; Longer D.T. indicates more occlusal surface friction contacts during the excursion (180) (181) (182) (183).
Fuerza Máxima Total=Total maximum forcé.
The occlusion time is defined as the duration from the initial contact of the tooth until it reaches the maximum intercuspation, which ideally should be less than 0.2 seconds. Longer times indicate greater interference and premature contacts during closing.
The subsequent disclusion time (D.T.) was first described by Kerstein and Wright as the required elapsed time for all posterior molar and premolar teeth to separate bilaterally from each other during a single excursion movement made in one direction (right, left or protrusive). Excursion recordings using the T-Scan III are used to measure the duration of the subsequent disclusion time and the existence of friction on the posterior occlusal surface during excursion movements [13].
The data were processed with the statistical programme SPSS Statistics 22. 0 (IBM, Armonk, NY, USA). The comparison between the occlusion and disclusion times that occur before and after the installation of a stabilisation splint and the percentages of bite force was performed by the t Student sample test for repeated measurements. The Wilcoxon or Mann-Whitney U tests were used when the assumption of normality was not met (Figures 3 and 4).
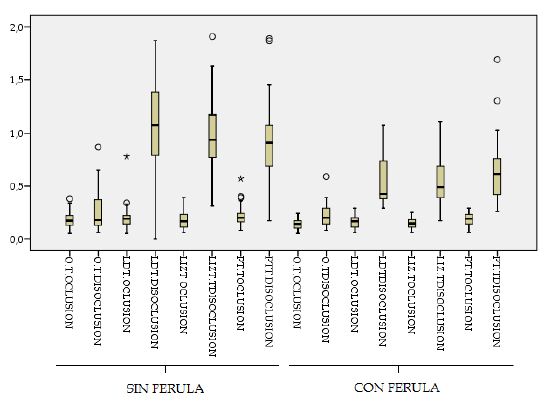
Figure 3: Occlusion and disclusion times that occur after the installation of a stabilisation splint.
Con/sin férula=With/without splint
O.T Oclusión/Disoclusión=T. Occlusion/Disclusion
LDT=RLT (Right Laterality Time).
LIZT=LLT (Left Laterality Time)
PTT=PT (Protrusion Time).
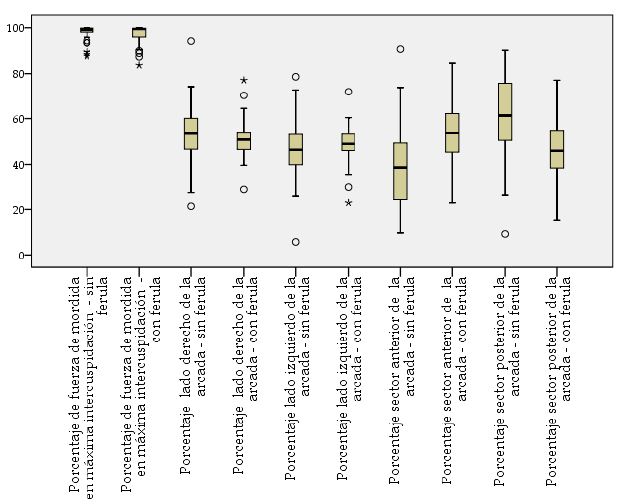
Figure 4: Porcentage de fuerza de mordida en máxima intercuspidación – sin férula/con férula
Percentage of bite forcé in maximum intercuspation – without splint/ with splint.
Porcentage lado derecho/izquierdo de la arcada sin férula/con férula
Percentage right/left side of the dental arch without splint/with splint.
Porcentage sector anterior/posterior de la arcada sin férula/con férula
Percentage anterior/posterior sector of the dental arch without splint/with splint.
Results
The reproducibility of the study was analysed using the interclass correlation coefficient and sensitivity of T-Scan III. Although statistical significance was not found in all records, a pattern was observed in all of them.
The results in terms of the occlusion time at maximum intercuspation, recorded before and after the installation of the stabilisation splint, were an average value of 0.18″ and the occlusion time after the installation of the splint decreased to 0.14″, this difference was statistically significant, p < 0.05.
The Wilcoxon test was used to assess the results of disclusion times at maximum intercuspation. Records without splints have an average value of 0.26″. There are no significant differences between the two records.
Disclusion time analysis in right laterality showed statistical significance. The average of the records without splints was 1.07″, well above the 0.40″ admitted as normal and the splint records showed a decrease in disclusion time to 0.54″.
Upon analysis of the disclusion time in the left laterality movement, a statistically significant difference is observed. We note that the disclusion time decreases from 0.98″ to an average of 0.57″ in records taken with stabilisation splints.
When analysing the moving protrusion records, we observe that the average disclusion times before installing the splint is 0.90″ and that this time decreases with the splint to 0.64″. This data has statistical significance (Table 1).
Table 1: Occlusion and disclusion times that occur after the installation of a stabilisation splint.
|
Variables |
Average | C.I. at 95% | Mdn | SD |
p |
||
| Dependent | Independent |
L.L. |
U.L. |
||||
| Occlusion time at maximum intercuspation | Without splint |
0.18 |
0.16 | 0.21 | 0.17 | 0.07 |
<0.001 (t) |
| With splint |
0.14 |
0.12 | 0.15 | 0.14 |
0.05 |
||
| Disclusion time at maximum intercuspation | Without splint |
0.26 |
0.20 | 0.31 | 0.18 | 0.18 |
0.554 |
| With splint |
0.22 |
0.19 | 0.25 | 0.20 |
0.11 |
||
| Right laterality occlusion time | Without splint |
0.19 |
0.16 | 0.23 | 0.19 | 0.11 |
0.044 |
| With splint |
0.16 |
0.14 | 0.18 | 0.17 |
0.06 |
||
| Right laterality disclusion time | Without splint |
1.07 |
0.93 | 1.20 | 1.08 | 0.43 |
<0.001 |
| With splint |
0.54 |
0.48 | 0.61 | 0.43 |
0.22 |
||
| Left laterality occlusion time | Without splint |
0.17 |
0.15 | 0.20 | 0.17 | 0.08 |
0.043 |
| With splint |
0.15 |
0.13 | 0.16 | 0.15 |
0.05 |
||
| Left laterality disclusion time | Without splint |
0.98 |
0.87 | 1.09 | 0.94 | 0.35 |
<0.001 |
| With splint |
0.57 |
0.49 | 0.64 | 0.49 |
0.24 |
||
| Occlusion time in protrusion | Without splint |
0.21 |
0.18 | 0.24 | 0.20 | 0.10 |
0.067 |
| With splint |
0.18 |
0.16 | 0.20 | 0.19 |
0.06 |
||
| Disclusion time in protrusion | Without splint |
0.90 |
0.79 | 1.01 | 0.91 | 0.36 |
<0.001 (t) |
| With splint |
0.64 |
0.55 | 0.73 | 0.62 |
0.28 |
||
| Wilcoxon signed-rank test; t, Student´s T-Test (paired samples); C.I, Confidence interval; L.L., lower limit; U.L., upper limit; S.D., standard deviation, Mdn, median. Sample Size 42 patients. | |||||||
Record as a percentage of forces that occur in each dental arch, right and left. The Student’s T-Test was used for statistical analysis for repeated samples. It is observed that at maximum intercuspation, the average percentage for the right dental arch recorded without stabilisation splint was 53.25% and for the left, it was 46.76%. With the stabilisation splint, the average values were 51.22% for the right dental arch and 48.80% for the left. It is noted that in stabilisation splint registers, there is a tendency to balance between the two dental arches (Table 2).
Table 2: Percentages of forces that occur in the right and left dental arches before and after the installation of a stabilisation splint.
| Variables |
Average |
C. I. at 95% | Mdn |
SD |
p |
||
| Dependent | Independent |
L.L. |
U.L. |
||||
| Percentage right side of the dental arch | Without splint |
53.25 |
49.22 | 57.27 | 53.60 | 12.91 |
0.067 |
| Percentage left side of the arcade |
46.76 |
42.74 | 50.78 | 46.40 |
12.91 |
||
| Percentage right side of the dental arch | With splint |
51.22 |
48.62 | 53.81 | 50.95 | 8.32 |
0.400 |
| Percentage left side of the dental arch |
48.80 |
46.19 | 51.41 | 49.05 |
8.37 |
||
| Wilcoxon signed-rank test; t, Student´s T-Test (paired samples); C.I., Confidence interval; L.L., lower limit; U.L., upper limit; S.D., standard deviation; Mdn, median. | |||||||
Record as a Percentage of Forces Produced in the Premolar and Molar Sector
For statistical analysis, the Student’s T-test for repeated samples and the Wilcoxon signed-range test were used. The average value of registers taken without stabilisation splints for the premolar sector was 40.27% and for the posterior molar sector of 60.09%. When registers are taken with the splint, the average was 52.26% in the premolar sector and 47.71% in the posterior molar sector. It is noted that records taken with stabilisation splints tend to balance both sectors (Table 3).
Table 3: Comparison of forces produced in the anterior and posterior sector before and after the installation of the stabilisation splint.
| Variables |
Average |
C.I. al 95% | Mdn | SD |
p* |
||
| Dependent | Independent |
L. L. |
U.L. |
||||
| Anterior sector percentage (premolars) | Without splint |
40.27 |
34.27 | 46.27 | 38.65 | 19.26 |
0.002 |
| Posterior sector percentage (molars) |
60.09 |
54.25 | 65.93 | 61.35 |
18.75 |
||
| Anterior sector percentage (premolars) | With splint |
52.26 |
47.97 | 56.55 | 53.70 | 13.75 |
0.149 |
| Posterior sector percentages (molars) |
47.71 |
43.42 | 51.99 | 46.00 |
13.76 |
||
| *Wilcoxon signed-rank test; C.I, Confidence interval; L.L., lower limit; U.L., upper limit; S.D., standard deviation; Mdn, median. | |||||||
Analysis of the results without stabilisation splint reveals there is a higher percentage of force at the molar than at the premolar level. With the splint, however, there is a change in the ratio of the force percentages, so that the loads are advanced, increasing the percentage of force at the premolar level, so much so that the values are inverted.
Discussion
At the start of this study, the reproducibility and sensitivity of the T-Scan system have been considered, using the interclass correlation coefficient. While no statistical significance was found in all records, a pattern is observed.
Several studies have assessed the ability of the T-Scan III system to detect the number and location of occlusal contacts and conclude that its operation is correct, particularly when used in conjunction with traditional methods [14,15].
Throckmorton [14] and Cerna [15] studied the validity and reliability of T-Scan III sensors under laboratory conditions, noting that reliability was high when used in consecutive measurements. Silva (2014) confirmed the high reliability of the sensor in consecutive measurements, as in our study [16].
Kerstein [17] related the size of the marks and the occlusal force with strips of articulating paper, he considered that reliability was only 21% and that to increase it, higher forces were needed [17]. Koos [9] assessed the accuracy and reproducibility of the T-Scan III to calculate the normal distribution of relative force in the dental arch and found that the difference between measurements and actual values were less than 2%. The method can, therefore, be considered sufficiently accurate and reliable [9].
Kerstein et al. have considered that, according to the available evidence, the computerised occlusal analysis system is the only occlusal indicator that displays the ability to quantify the force and time of occlusion in real-time from initial MIP contact to disclusion. The accuracy of displaying occlusal contacts makes this system a better occlusal indicator than other available conventional non-digital materials. Recordings of T-Scan’s occlusal analysis, if successful, can provide an objective view of the occlusion and its discrepancies. Subsequent publications have reported that T-Scan III shows good reproducibility of surface measurements and register of relative forces [18]. It is, therefore, endorsed as a good method of study, and even more so for this study, in which repeated measurements were made, with and without a splint.
The T-Scan III system is useful for calibrating occlusal contacts. Occlusal contact between the teeth is considered to exist when the interocclusal distance between the occlusion areas is less than 50 μm; while contacts close to occlusion occur when the distance is between 50 and 350 μm
For proper function, occlusal contacts must be synchronised with the stomatognathic system [19].
A wide variety of occlusal analysers have been used to record occlusal relationships between dental arches. In dental practice, the role of articulating paper has been the most commonly used diagnostic tool to identify the points of contact between the teeth of both arches. Paper can easily highlight or mark contact, but it cannot accurately quantify its intensity or measure the magnitude of the occlusal forces generated. It is the size of the marked area on the articulating paper that is used as an indicator of the occlusal load intensity [20].
Authors such as Saad, Weiner and Ehrenberg, Millstein, consider the interpretation of paper marks to be subjective and therefore inaccurate since similar occlusal loads correspond to marks of different intensity. The T-SCAN III computerised occlusal analysis system largely avoids subjectivity in the interpretation of the articular role [21,22].
T-Scan III occlusal analysis technology, while not being able to measure absolute bite force, does provide occlusal force times and variability, which can be quantified from the first point of contact to MIP when the subject bites on the occlusal sensor. The sensor thickness is 100 μm (0.1 mm), which is compressed up to 60 μm under the occlusion force. Due to the high compression capacity of the sensor, it provides bilateral contact during jaw movement.
The T Scan system allows accurate assessment of occlusion and disclusion times. The occlusion time, which runs from the first contact during closing to full intercuspation (Koos, 2010), is mostly conditioned by dental morphology. Furthermore, the canines and first premolars play a crucial role in leading teeth to contact [9].
The posterior disclusion time (D.T.) was defined by Kerstein and Wright as the elapsed time for all molar and premolar posterior teeth to separate from each other during a single excursive movement performed in one direction; right, left, or protrusive.
Several studies have shown that with treatments that minimise disclusion time to less than 0.5 s per excursion, it is possible to reduce pain and dysfunctional muscle symptoms quickly, both in frequency and intensity. This improvement was maintained during the observation time of the studies [13].
In this study, it has been confirmed in records taken with stabilisation splints in right/left laterality and protrusion movement that disclusion times decrease, and pain also decreased in most subjects.
In our study, patients showed decreased pain on the VAS scale when evaluated one month after the installation of the stabilisation splint.
Kerstein (2016) also related disclusion time to symptomatology, proving that a reduction of fewer than 0.4 seconds per excursion is effective in reducing symptoms of myofascial pain [23].
Modifying an occlusal scheme by shortening disclusion time can be achieved through the occlusal adjustment process known as Immediate Complete Anterior Guidance Development (ICAGD). In the study that developed this method, significant reductions in myofascial pain muscle symptoms were found, which began even after the first day of treatment. When comparing the right and left excursive disclusion times of 100 pre- and post-treatment patients with ICAGD, several conclusions were reached. First, that time of disclusion in excursive movements, if prolonged can result in symptoms of myofascial pain. Reducing disclusion times in left and right laterality movements below 0.4 seconds per excursion decreases symptoms of myofascial pain. When patients with myofascial pain are treated using the ICAGD technique, which uses T-Scan III computerised occlusal analysis to measure the correctness of the outcome of ICAGD treatment, symptomatology will improve rapidly.
Thus, treatment based on reducing disclusion time by applying the ICAGD method is a new therapeutic possibility for patients with dysfunction and myofascial pain. After the installation of the stabilisation splint, disclusion times are shortened, creating a new occlusal scheme, and establishing new guides for excursive movements [24].
It has been shown that the longer the back teeth are in occlusion during a jaw excursion, the greater the friction that occurs. This leads to temporal and masseter muscle hyperactivity, contributing to the occlusal pain and muscle symptomatology of TMDs. High disclusion times of more than 1.39 seconds significantly increase contractile muscle activity [25]. When these disclusion times are reduced, below 0.5 seconds, (<0.5″) contractility is significantly reduced, reaching values close to those of the resting state. It has been observed that with a coronoplasty, disclusion time can be shortened by 0.5 seconds per excursion.
In our study, coinciding with these observations, disclusion times decreased considerably in the different excursive movements with the splint.
Finally, the T-Scan system provides data relevant to the assessment of the distribution of force percentages in the different sectors of the dental arches. Misirlioglu et al. have suggested that T-Scan is a successful diagnostic device for detecting premature contacts and excessive occlusal forces [26].
T-SCAN III analyses the order of occlusal contacts while simultaneously measuring the percentage changes in the force of those same contacts, from the moment the teeth begin to make occlusal contact to central occlusion intercuspation. It shows abnormal forces that lead to trauma or pain in each tooth in the dental arch. This helps to balance forces on both sides of dentition [27].
Kerstein RB et al. consider the T-SCAN III system to be a highly accurate technique for studying and analysing occlusal relationships.
KERSTEIN et al., by synchronising computerised occlusal system data with electromyography, observed that it was possible to detect muscle dysfunction through the centre of force patterns and timing of disclusion. They also determined that the T-Scan III system can provide an accurate and definitive diagnosis of occlusal force balance and chewing muscle function for the clinician and is a comprehensive educational tool for the patient undergoing occlusal balance procedures [28,29].
Treatment with stabilisation splints is most commonly indicated for any of the following; TMDs, bruxism, and myofascial pain.
Scientific and health organisations in the United States; the National Institutes of Health-National Oral Health Information Clearing House (NIH-NOHIC), the American Academy of Oral Pain (AAOP), the American Association Of Oral and Maxillofacial Surgeons and the American Academy of Craniofacial Pain (AACFP), recommend short-term stabilisation splint therapy without occlusal changes as a treatment for TMD (Clark and Minakuchi, 2006).
Montgomery considers the T-Scan III system an element of routine analysis of occlusal physiology and its relationship to adjacent oral musculature. He concludes that T-Scan III is a precise method that, in a computerised manner, records occlusal contacts, generating a dynamic video that allows identification of the percentage of occlusal force per tooth, dental arch and quadrant. This procedure enables occlusal adjustment to be performed with greater precision, allowing functionally balanced restorative treatments, facilitating muscle activity and balancing periodontal support [30].
Ferrario et al. compare electromyography records in patients with and without stabilisation splints and find a significant decrease in the activity of the masseter and temporal muscles in the records of maximum intercuspation with the splint. They also observe a greater balance between both right and left sides, and an increase in masseter muscle activity compared to the anterior temporal muscles [31].
Thus, the results of this T-scan III study show that the installation of a stabilisation splint promotes balance in the distribution of forces. The splint tends towards symmetry between both sides of the dental arch, which is also confirmed by electromyography. On the other hand, the loads are redistributed, increasing the percentages of occlusal force over the premolar zone, relative to the rear area of molars. These results in an increase in masseter muscle activity compared to the previous temporal one, favouring balance in the joint activity of the muscles.
In conclusion, we can establish that the disclusion times in the excursive movements of left/right and protrusive laterality are reduced after the installation of the stabilisation splint. It is also observed that the distribution of forces between the two dental arches tend to be balanced after the installation of the splint. As for the percentages of forces at the anterior (premolar) and posterior level (molars), it is observed that there is a very clear difference, so the percentages of force between the two sectors tend to be balanced.
Given the results of this study, it can be said that the T-Scan III system provides useful information for the adjustment of the stabilisation splint in each patient, looking for guides with disclusion times of less than 0.4 seconds and a balance in the distribution of force percentages, providing orthopedic stability to the chewing apparatus.
References
- Dworkin SF, Burgess JA (1987) Orofacial pain of psychogenic origin: current concepts and classification. J Am Dent Assoc 115: 565-571. [crossref]
- Manfredini D, Winocur E, Guarda-Nardini L, Paesani D, Lobbezoo F (2013) Epidemiology of bruxism in adults: a systematic review of the literature. J Orofac Pain 27: 99-110. [crossref]
- Manfredini D, Lobbezoo F (2010) Relationship between bruxism and temporomandibular disorders: a systematic review of literature from 1998 to 2008. Oral Surg Oral Med Oral Pathol Oral Radiol Endodontol 109: 26-50. [crossref]
- Svensson P, Jadidi F, Arima T (2008) Relationships between craniofacial pain and bruxism. J Oral Rehabil 35: 524-547. [crossref]
- Rossetti LMN, de Araujo CDRP, Rossetti PHO, Conti PCR (2008) Association between rhythmic masticatory muscle activity during sleep and masticatory myofascial pain: a polysomnographic study. J Orofac Pain 22: 190-200. [crossref]
- Blanco Aguilera A, Gonzalez Lopez L, Blanco Aguilera E, De la Hoz Aizpurua JL, Rodriguez Torronteras A, et al. (2014) Relationship between self-reported sleep bruxism and pain in patients with temporomandibular disorders. J Oral Rehabil 41: 564-572. [crossref]
- Afrashtehfar KI, Qadeer S (2016) Computerized occlusal analysis as an alternative occlusal indicator. Cranio 34: 52-57. [crossref]
- Kerstein, RB (2001) Current applications of computerized occlusal analysis in dental medicine. Gen Dent 49: 521-30. [crossref]
- Koos B, Godt A, Schille C, Goz G (2010) Precision of an instrumentation-based method of analyzing occlusion and its resulting distribution of forces in the dental arch. J Orofac Orthop 71: 403-410. [crossref]
- Guías DC/TMD. Sschiffman, Ohrbach, Truelove, Oook, Anderson, Goulet et al. (2014).
- Paesani D (2010) Bruxism: Theory and practice. Reino Unido: Quintessence Publishing.
- Haralur SB (2013) Digital evaluation of functional occlusion parameters and their association with temporomandibular disorders. J Clin Diagn Res 7: 1772-1775. [crossref]
- Berger AL, Szalewski B, Szkutnik A, Michał Ginszt (2016) Correlation between generalized joint laxity and symptoms of temporomandibular disorders]. 40: 248-251. [crossref]
- Throckmorton GS, Rasmussen J, Caloss R (2009) Calibration of T-Scan sensors for recording bite forces in denture patients. J Oral Rehabil 36: 636-643. [crossref]
- Cerna M, Ferreira R, Zaror C, Navarro P, Sandoval P (2009) Validity and reliability of the T-Scan III for measuring force under laboratory conditions. J Oral Rehabil 42: 544-551. [crossref]
- da Silva M, Caramelo F, Ramalho J, Gomes P (2014) In vitro study on the sensibility and reproducibility of the new T-Scan III HD system. Rev Port Estomatol Cir Maxilofac 55: 14-22.
- Kerstein RB (2008) Articulating paper mark misconceptions and computerized occlusal analysis technology. Dent Implantol Update 19: 41-46. [crossref]
- Cohen-Levy J (2015) Orthodontic T-Scan applications. In: Kerstein RB, editor. Handbook of research: computerized occlusal analysis technology applications in dental medicine. 2: 523-561.
- Owens S, Buschang PH, Throckmorton GS, Palmer L, English J (2002) Masticatory performance and areas of occlusal contact and near contact in subjects with normal occlusion and malocclusion. Am J Orthod Dentofacial Orthop 121: 602-609. [crossref]
- Carey JP, Craig M, Kerstein RB, Radke J (2007) Determining a relationship between applied occlusal load and articulating paper mark area.Open Dent J 1:1-7. [crossref]
- Saad MN, Weiner, Ehrenberg D, et al. (2008) Effects of load and indicator type upon occlusal contact markings. J Biomed Mater Res B Appl Biomater 85: 18-22. [crossref]
- Millstein P, Maya A (2001) An evaluation of occlusal contact marking indicators. A descriptive quantitative method. J Am Dent Assoc 132: 1280-1286. [crossref]
- Kerstein, RB, Radke J (2006) The effect of disclusion time reduction on maximal clench muscle activity levels. Cranio 24: 156-165. [crossref]
- Thumati P, Thumati R.P (2016) The effect of disocclusion time‑reduction therapy to treat chronic myofascial pain: A single-group interventional study with 3 year follow‑up of 100 cases. The Journal of Indian Prosthodontic Society 16: 234-241. [crossref]
- Kerstein, RB (1995) Treatment of myofascial pain dysfunction syndrome with occlusal therapy to reduce lengthy disclusion time – a recall evaluation. Cranio 13: 105-115. [crossref]
- Misirlioglu M, Nalcaci R, Baran I, Adisen MZ, Yilmaz S (2014) A possible association of idiopathic osteosclerosis with excessive occlusal forces. Quintessence Int 45: 251-258. [crossref]
- Afrashtehfar KI, Qadeer S (2016) Computerized occlusal analysis as an alternative occlusal indicator. Cranio 34: 52-57. [crossref]
- Kerstein, RB (2004) Combining technologies: a computerized occlusal analysis system synchronized with a computerized electromyography system. Cranio 22: 96-109. [crossref]
- Kerstein RB, Radke J (2012) Masseter and temporalis excursive hyperactivity decreased by measured anterior guidance development. Cranio 30: 243-254. [crossref]
- Montgomery MW (2011) T-Scan dental force analysis for dental examination. Dent Today 18: 46.6.
- Ferrairo V, Sforza C, Tartaglia M (2002) Immediate effect of stabilization splint on masticatory muscle activity, in temporomandibular disorder patients. J Oral Rahabil 29: 810-815. [crossref]