Abstract
Understanding the long term patterns and trends in climatic variables in relations to their effects on farming operations and community-based adaptation techniques employed by smallholder farmers in minimizing the negative effects of climatic variability, is a perquisite towards achieving food security and key SDGs. Thus this study aimed to examine the long-term trends and patterns of agro-climatic variables in Edo north and efficient of existing climate change adaptation strategies employed by mainly smallholder farmers. Datasets used include minimum temperature (TMin), maximum temperature (TMax), rainfall, soil moisture (SM) and potential evapotranspiration (PET). The dataset were assembled on monthly basis and spanned across 119 years starting from January 1901 to December 2019 and 37 years starting from January 1982 to December 2018 for SM. These dataset were sourced from the University of East Anglia-Climatic Research Unit, the National Aeronautical and Space Administration Goddard Space Flight Center along with the University of Maryland. Primary data was collected from field survey through questionnaire and oral interviews. Results of long-term annual distribution of climatic variables revealed marked variations in TMin, TMax, and PET over time, while rainfall and SM showed no statistical significant changes. Of all the climatic variables investigated, only rainfall exhibited a rising trend. The study found that the three most adaptation strategies deployed by farmers were the use improved crop varieties (WMS = 4.51), application of early maturing plants (WMS = 4.49) and the use of intensive fertilizer and/or manure application for crop production (WMS = 4.48). The fact that other adaptation strategies are not widely employed in the study area, maybe attributed to low level of rural infrastructures, high poverty level and illiteracy etc. There therefore need for the formulation of climate change adaptation workable policy, programme development/implementation that is geared towards massive rural infrastructure transformations and access to extension services.
Keywords
Climate change, Agro-climatic variables adaptation strategies, Stallholder famers, Adaptation efficiency
Introduction
Nigeria has been adversely affected by climate change especially due to the high vulnerability of majority of her population, arising from poverty and low coping capacity. Increased temperature has been reported as one of the major indicator of climate change [1-10]. As temperature rises, crops will loss water rapidly through transpiration thereby increasing crop water need. High potential evapotranspiration (PET) is usually observed during high temperature condition [11]. Thus, higher value of PET, means increased moisture loss, leading to deficit water balance which is unfavourable to crops. When plant water deficit is not met on time, it causes contingent drought. Crops growing under low soil moisture, yield little and poor quality seeds. As reported by Obi [12], while increase in temperature is expected to elongate the growing season in temperate regions, such increase within the tropics is expected to decimate agricultural output by aggravating soil evaporation rate and invariably drought. Ayoade [13] has also noted that excessive heat destroys plant protoplasm and also decreases the reproductive capacities of animals. Increasing temperature weakens plants and their leaves wither easily hence poor photosynthesis [11]. Another study has established that rising temperature will result in reduced crop quantity and quality due to the reduced growth period following high levels of temperature rise; reduced sugar content, bad coloration, and reduced storage stability in fruits; increase of weeds, blights, and harmful insects in agricultural crops; reduced land fertility due to the accelerated decomposition of organic substances [14]. Furthermore, declining agricultural productivity in Nigeria arising from climate change has been implicated in food crisis and the ongoing farmers-herders’ crisis in Nigeria [15-23].
Fortunately, sustainable adaption measures to climate change hold potentials to reducing the negative impacts of climate change [24]. Climate change adaptation is the process of preparing for, and adjusting proactively to climate change-both negative impacts as well as potential opportunities [25]. It involves adjusting policies and actions because of observed or expected changes in climate [26]. Adaptation can be reactive, occurring in response to climate impacts, or anticipatory, occurring before impacts of climate change are observed [27]. In most circumstances, anticipatory adaptations will result in lower long-term costs and be more effective than reactive adaptations [27]. Studies have shown that farming operations and farming technologies in Nigeria have been changing in response to the effects of climate change [28-39]. While most of these authors focused on adaptation practices in other parts of the country, only few studies exist on climate change adaptation practices by farmers in Edo state, particularly Edo North. Oriakhi et al., [40] for example investigate perceived effect of climate change on crop production by farmers in Edo state, Nigeria, while Ufuoku [41] examined that determinants of adaptation to Climate change among arable Crop Farmers in Edo State, Nigeria and its Implications for Extension Service. These studies did not take into account the effectiveness and efficiency of existing adaptation measures in the northern part of the State. In addition, several climate adaptation practices exist; however, academic literature is scarce on the effectiveness, sustainability and contribution to resilience and sustainability of these adaptation practices, especially in Sub-Saharan Africa [42]. This two grounds justifies the need for the present study.
Materials and Methods
The study area is Edo North, and lies within Latitudes 6° 45′ 15.04” and 7° 34′ 31.31.23” North of the Equator while the longitudinal extent expands from Longitudes 5° 43′ 21.347” and 6° 41′ 46.579” East of the Greenwich (Figure 1). Edo North is bounded in the north by Kogi State, in the east by River Niger, in the south by Edo Central and Edo South and in the west by Ondo State. Edo North Agro Ecological Zone occupies an area of approximately 6169.56km2. Edo North is one of the Agro Ecological Zones in Edo State with a rapidly growing population. In 1991, the population of the six (6) local government areas (LGAs) namely: Akoko Edo, Etsako East, Etsako Central, Etsako West, Owan East and Owan West stood at 549,496 people. The population increased to about 955,791 in 2006 and projected to 1,494,815 in 2019 [43]. The people are presently distributed among three major sub-ethnic groups namely: Akoko Edo largely in the north, Etsako in the central and eastern parts and Owan in the western region of Edo North. Each sub-ethnic group is strongly connected by common tradition of origin, and they speak closely related dialects while at the same time exhibiting other numerous similar cultural traits.
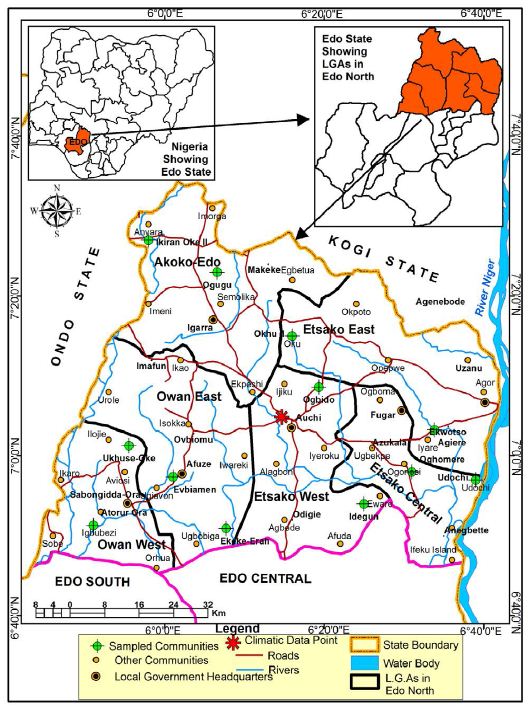
Figure 1: Study area showing Local Government Areas and Sampled Communities. Source: Compiled using Open Street Map Database (2019)
The climatic of Edo north fall within the warm-humid tropical climate region with distinct wet and dry seasons. The rainy season last for about seven months (May to October) and the dry season last for about five months (November to April). Rainfall is moderate between the months of March and May and heaviest between June and September with average rainfall between 1000 mm and 1500 mm and temperature as high as 36.7°C especially within the hottest period of February to April [44].
Dataset and Sources
Primary and secondary data were adopted for this study. The primary data was derived from field survey through the use of questionnaire and oral interviews with sampled crop farmers. The data derived through questionnaire focused on farmers’ adaptation strategies to climate change. The secondary data were the high-resolution time-series (TS) gridded climatic data of month-by-month variation in climate (version 4.04 from January 1980-December 2019) of minimum temperature, maximum temperature, rainfall, potential evapotranspiration (PET) and soil moisture (37 years). These dataset were retrieved from archives of the University of East Anglia-Climatic Research Unit, Harris and Jones (2019), while the time series of soil moisture data was downloaded from the Famine Early Warning Systems Network (FEWS NET) and famine Land Data Assimilation System (FLDAS) website. FLDAS is part of the mission of the United States of America (USA) National Aeronautical and Space Administration (NASA) Earth Science Division and archived and distributed by the Goddard Earth Sciences (GES) Data and Information Services Centre (DISC) (NASA GES DISC, 2019). This climatic dataset was selected based on their significance principally in farming as well as their influence in other socio-economic activities in Edo North. Ayoade [45] reported that these climatic parameters have been identified as the most important for crop growth and yield.
Sample Population and Determination of Sampling Size
The population of the study consists of farmers in the selected communities from the study area. However, to determine the sample size, [46] asserted that, it is not always possible to determine the size of most populations or to be certain that each element in the population has an equal chance of being included in the sample. Sample size is almost invariably controlled by cost and time [47]. Nevertheless, [48] provided a useful framework for determining an appropriate sample size. The required sample size is a function of population size and the desired accuracy (within 5%, 3%, or 1%) at the 95% confidence level. For instance, if a researcher is sampling from a population that consists of 10,000 respondents and wishes to be 95% confident that the outcome will be within 5% of the true percentage in the population, the researcher need to randomly sample 370 respondents” [48]. However, to obtain the study population, the 1991 census figures which was released at the community level was used due to the non-availability of same data in 2006 census. Given that population of any place is not static but dynamic, 1991 population of the area was projected to 2019 using 3.2 % annual Edo State growth rate. This gave a figure of 35,510 which therefore, formed the population for the study. Thus, [48] sampling framework was adopted to obtain the sample size from the sample population of 35,510 at 95% confidence level and 3% error margin. This also equals to 533 farmers which formed the sample size which was shared proportionally according to the population in each communities as shown in Table 1.
Table 1: Selected Settlements and Distribution of Respondents
|
S/No |
Sampled Communities | LGA | Population | Sample Size/No. of Questionnaires | Number Retrieved | |
| 1991 |
2019 |
|||||
| 1. | Makeke | Akoko Edo |
1861 |
4495 | 67 |
65 |
| 2. | Aiyegunle | Akoko Edo |
1271 |
3070 | 46 |
43 |
| 3. | Uzanu | Etsako East |
611 |
1476 | 22 |
22 |
| 4. | Ekwoto | Etsako East |
1331 |
3215 | 48 |
46 |
| 5. | Azukala | Etsako Central |
1803 |
4355 | 65 |
63 |
| 6. | Anegbette | Etsako Central |
2762 |
6672 | 100 |
92 |
| 7. | Odigie | Etsako West |
1995 |
4819 | 72 |
68 |
| 8. | Ogbido | Etsako West |
802 |
1937 | 29 |
27 |
| 9. | Ovbiomu | Owan East |
439 |
1060 | 16 |
15 |
| 10. | Imafun | Owan East |
614 |
1483 | 23 |
23 |
| 11. | Ukhuse-Oke | Owan West |
634 |
1532 | 24 |
24 |
|
12. |
Atoruru-Ora | Owan West |
578 |
1396 | 21 |
21 |
|
Total |
14,701 | 35,510 | 533 |
509 |
||
Sampling Techniques
The study area is made up of six LGAs and purposive sampling was used in selecting two (2) communities each from the six LGAs. A total of 12 communities were purposively selected for this study. The purpose of using purposive sampling is based on their level of farming activities in the communities. Systematic random sampling was adopted in picking farmers in the communities. The working of this method is that, in each street, lane or layout in the community, the first house was picked and thereafter every third residential houses selected. In a case where there is no farmer in a particular house, the next residential house was chosen.
Data Analysis
Data on the of climate change in Edo North and challenges of existing adaptation strategies were evaluated using descriptive statistics, trend analysis as well as change in the time series climatic datasets. The descriptive statistics include mean, standard deviation, range, minimum, maximum, variance and coefficient of variation (CV). Based on Atedhor [49] the trend in the time series climatic datasets were analyzed using simple linear regression (SLR). Udofia [50] mathematically expressed the SLR model as:
Y = a + bx + ε (1)
Where:
Y: the dependent variable. These include each of the climatic datasets (minimum temperature, maximum temperature, rainfall, PET and soil moisture (O-40 cm) at annual bases.
x: the independent variable in this case time (Years, that is, 1980-2019),
a: the y intercept (that is where the regression line touches the y-axis.
b: the regression coefficient or slope.
e: the residual or random error term.
Similarly, IPCC [51] stated that “a change in the state of the climate could be established using statistical tests”. To evaluate the change in the time series climatic datasets, one-way analysis of variance (ANOVA) was used. However, before ANOVA was carried out, all the climatic datasets were partitioned into four climatic periods (1980-1989, 1990-1999, 2000-2009 and 2010-2020) based on [52]. The cardinal goal of partitioning the climatic data into six climatic periods was to facilitate easy decade-to-decade comparison with the view to establishing decadal change. Udofia [50] also expressed the ANOVA model as:
H0 : μ1 = μ2 = μ3 = … = μ½ (2)
Where: μ : group mean and; k: number of groups.
The mean squares are calculated by dividing each sum of squares by its degrees of freedom. The F ratios are the mean squares for each source divided by the within groups mean square. The significance level for the F is from the F distribution with the degree of freedom for the numerator and denominator mean squares. Besides, a post hoc test was further carried out on the ANOVA results to actually ascertain which particular decade changed or differed from another using Tukey’s Honestly Significant Difference Test (TUKEY) ([53,54]. The significance level of 0.01 and 0.05 was adopted. A five-point Likert’s scale was adopted to examine the extent of effects of socio-economic variables on the effectiveness of existing adaptation practices in the study area. The five-point Likert’s scale ranged from: Highly efficient (weight = 5), Efficient (weight = 4), Inefficient (weight = 3), highly efficient (weight = 2), Can’t tell (weight = 1).
Results and Discussion
The descriptive statistics of mean agro-climatic elements (1980-2020) of the study area are presented in Table 2. Mean minimum temperature (TMin) was 21.7°C, maximum temperature (TMax) 31.1°C, rainfall (1666 mm), soil moisture (SM 0-40 cm) 9.01 mm and potential evapo-transpiration (PET) 39.7 mm. Also, the standard deviation (SD) for TMin was 0.34°C, TMax (0.35°C), rainfall (175.3 mm), SM 0-40cm (0.12 mm) and PET (0.76 mm). The range for TMin was 1.6°C, TMax (1.9°C), rainfall (1164.2 mm) as compared to the temperature range of 5.14°C and rainfall range of 1013.08 mm between 1996-2014 in Akure, Ondo State reported by Olubanjo and Alade [55]. Also, the range of SM 0-40 cm was 0.53 mm and PET (4.5 mm). In the period under investigation, minimum value for TMin was 20.9°C, TMax (30.1°C), rainfall (1189.6 mm), SM 0-40cm (8.73 mm) and PET (37.0 mm). On the other hand, maximum for TMin was 22.5°C, TMax (32°C), rainfall (2353.7 mm), SM 0-40 cm (9.25 mm) and PET (41.5 mm). In addition, the highest Coefficient of Variation (CV) of 10.52% was recorded for rainfall, 1.91% for PET, 1.33% for SM, 1.55% for TMin and 1.12% for TMax. The coefficient of variation (CV) is the ratio of the standard deviation to the mean and allows for comparison between distributions of values whose scales of measurement are not comparable [56]. Study has shown that low coefficient of variation associated with total annual, average annual, major and minor rains indicates high reliability and dependability of rainfall particularly for agricultural purpose [57]. Value of C.V for rainfall distribution in the study area show that rainfall was generally more irregular than other climatic elements in the study area and may be reliable for agricultural operations.
Table 2: Descriptive Statistics of Agro-Climatic Elements in Edo North
|
Statistics |
Minimum Temperature | Maximum Temperature | Rainfall | Soil Moisture |
Potential Evapo-transpiration |
| Mean |
21.682 |
31.073 | 1665.982 | 9.0451 |
39.683 |
| Standard Deviation |
0.3360 |
0.3476 | 175.2601 | 0.12068 |
0.7583 |
| Range |
1.6 |
1.9 | 1164.2 | 0.53 |
4.5 |
| Minimum |
20.9 |
30.1 | 1189.6 | 8.73 |
37.0 |
| Maximum |
22.5 |
32.0 | 2353.7 | 9.25 |
41.5 |
| Variance |
0.113 |
0.121 | 30716.12 | 0.015 |
0.575 |
| Coefficient of Variation (CV) |
1.55% |
1.12% | 10.52% | 1.33% |
1.91% |
| N (Years) |
119 |
119 | 119 | 37 |
119 |
Results of patterns, trends and CV of TMin as presented in Figure 2. It can be seen that January and December are months with the lowest TMin of 21.2°C, whereas March the month of March recorded highest TMin, with the value of 23.2°C.
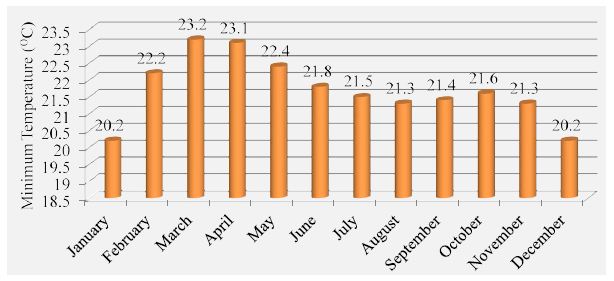
Figure 2: Monthly Pattern of Minimum Temperature in Edo North
In Figure 3, the result of annual pattern and trend in TMin is presented. TMin exhibited a rising trend at 0.002°C per annum and 5.7% probability of persisting into the future in Edo North. In the 119 years. The years 1971 and 1975 emerged as the years with the lowest TMin of 20.9°C, while 2010 was the year with highest TMin of 20.5°C. A noticeable annual TMin decline was observed between 1970 and 1971 with a corresponding with another noticeable rise between 1929 and 1930.
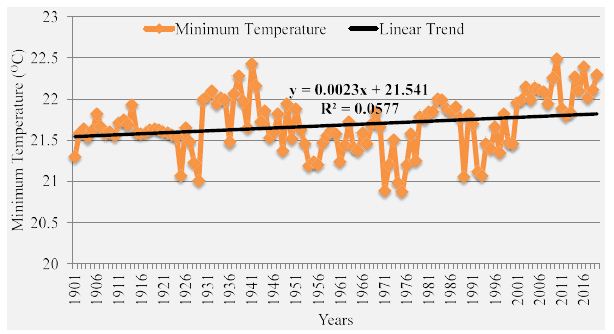
Figure 3: Annual trends and coefficient of variation of minimum temperature in Edo North (1901-2019)
In Figure 4, it can be seen that the month of August is the month with the lowest TMax of 27.8°C whereas February, with the value of 34.4°C recorded the highest TMax. As it could be seen in Figure 5, TMax exhibited an upward trend at 0.003°C per annum and 11.9% probability of the pattern reappearing in the future in Edo North. Similarly, the year 1976 emerged as the year with the lowest TMax of 30.1°C while 2016 was the year with highest TMax of 32°C (Figure 5). A noticeable rise in annual TMax could be observed in 1929/1930 with a corresponding decline between 1973 and 1974. The observed increase in temperature towards late 2000 may be associated to regional and global sea surface temperature (SST) changes. For example Bader, [58] reported that the sea surface temperatures (SSTs) of the tropical Indian Ocean has shown a pronounced warming since the 1950s and has impact of this warming on Sahelian environment. Other observational and model studies have associated the warming condition of the Sahel to warm SSTs in the tropical Atlantic and the Gulf of Guinea [59-63]. Lucas et al [64] on the other hand also attributed this increase to global warming caused by anthropogenic emission of greenhouse gasses and the gradual expansion of the tropics. Values of maximum and minimum temperatures were observed to be generally highest in northwest and southwest part of the basin which may be attributed to nearest to heat influx from the anomalous warming of the sea surface in the Guinea Gulf near the equator and north Atlantic ocean SST.
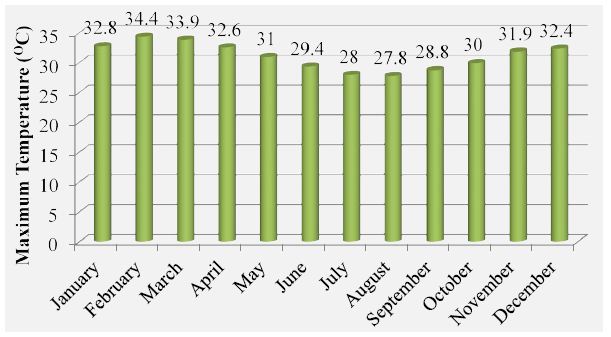
Figure 4: Monthly pattern of maximum temperature in Edo North
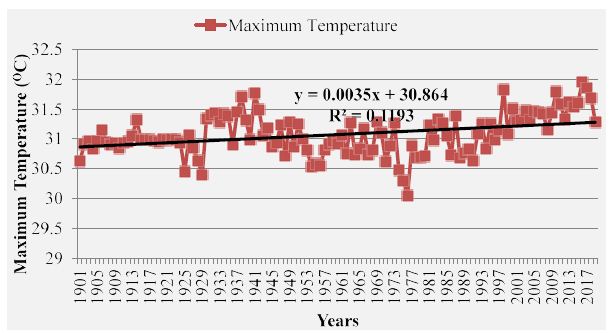
Figure 5: Annual trends and coefficient of variation of maximum temperature in Edo North (1980-2019)
As seen in Figure 6, Edo North receives rainfall throughout the year with two obvious peaks. The first peak is in July with about 254.5mm while the second is September (289.1 mm) which also doubles as the month with highest rainfall. This seasonal rainfall pattern is typical of locations within humid tropical regions of Nigeria which is also known for a short dry season between the two peaks (August break).
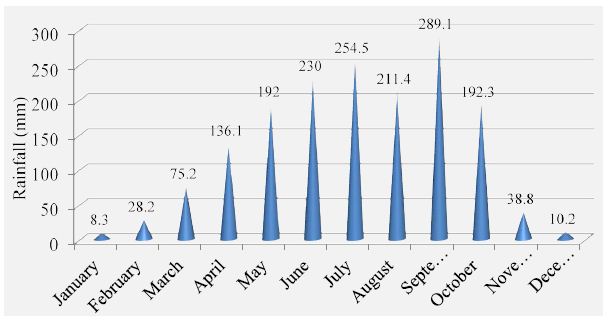
Figure 6: Monthly pattern of rainfall in Edo North
Annual pattern of rainfall distribution over the study area displayed marked variability between 1901 and 2019 and the simple linear regression showed a declining trend at annual rate of 0.1 mm (R2 = 0.000) (Figure 7). The year 1914 is seen to be the driest year in the climatic period with rainfall of 1189.6 mm, while the year 1901, with total rainfall of 2353.7 mm was the wettest year. Noticeable patterns in the distribution of annual rainfall is also easily discernible with a sharp rise of about 467.4 mm took place between 1946 and 1947 and 509.4 mm between 1956 and 1957 (10 years interval). A corresponding decline amounting to 644.8 mm was also observed between 1957 and 1958. This rainfall decline coupled with rising human population, urbanization and industrialization is capable of creating water security issues among individuals, firms and government as reported by Olubanjo [65].
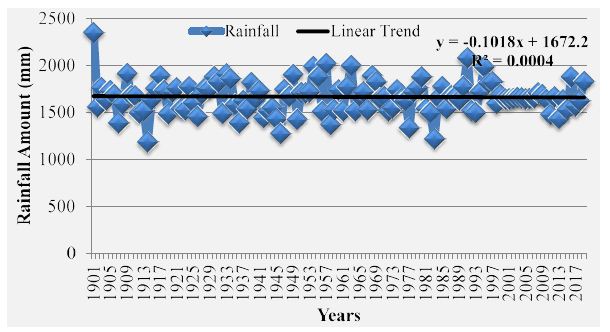
Figure 7: Annual trends and coefficient of Variation of rainfall in Edo North (1980-2019)
The fact that values of rainfall showed evidence of decline in the early 60s is an indication of pronounced rainfall anomaly in the basin which can be linked to global and regional large-scale sea-surface temperature anomaly (SSTA) which has become evident since 1950s. Model studies show that the increased Sahelian rainfall variability which became pronounced since 1970 onward is associated with SST anomaly patterns, including changes in the tropical Atlantic [59,60-63] in the Pacific [64-67], in the Indian Ocean [68,69], and in the Mediterranean [70]. Numerical-modeling studies have also confirmed that Atlantic Ocean sectors exert significant impacts on West African precipitation anomalies [62,66,71-73]. Based on simulations by NSIPP1 (version 1 of the AGCM developed at NASA’s Goddard Space Flight Center) with the observed history of the twentieth century global SSTs, [74,75] proposed that the interdecadal and interannual variability of the Sahel rainfall is forced by warm waters surrounding the African continent, especially the Indian Ocean SST. A warm sea surface was observed to promote convection over the sea thereby reducing the penetration of the convergence band over the Sahel [76].
In Figure 8, monthly soil moisture pattern at the depth of 0-40cm for the study period (1982-2018) is presented. The figure revealed that the highest value of 0.85 m3/m3 was recorded in September and October while January and February were the months with the lowest value of 0.59 m3/m3. Similarly, annual pattern of soil moisture is presented in Figure 9. As it could be seen, the highest content was recorded in 1991 with the value of 9.3 m3/m3 whereas the lowest soil moisture content was recorded in 1983 with the value of 8.7 m3/m3.
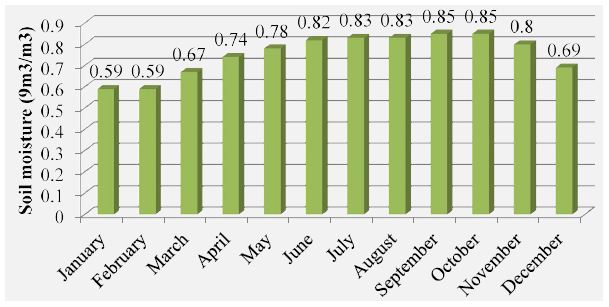
Figure 8: Monthly pattern of soil moisture (0 – 40 cm) in Edo North
Besides, an obvious increase in SM content observed in 1990/91 with the value of 0.3 m3/m3 while 1991/1992 experienced sharp decline in SM amounting to 0.4 m3/m3 in Edo North. In addition, soil moisture exhibited a rising trend in the climatic period with an increment of 0.003 m3/m3 per annum and 7.5% likelihood of the pattern and trend of SM observed to repeat itself in the future (Figure 9).
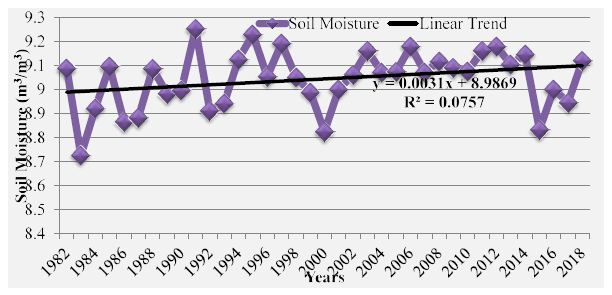
Figure 9: Annual trends and coefficient of variation of soil moisture (0 – 40 cm) in Edo North (1982-2018)
Another ACE in Edo North that was investigated was potential evapotranspiration (PET). Findings from the 119 years climatic period (1901-2019) revealed various levels of variability and change in the trends and patterns of PET in the study area (Figure 10). As seen in Figure 9, there is no month in the year Edo North does not lose water in the form of moisture to the atmosphere. The lowest PET value of 2.5 mm each was observed in July and August while the highest PET value of 4.3 mm was noticed in February. Annual pattern of PET (Figure 11) displayed marked fluctuations in the 119 years’ climatic period with an outstanding peak of 41.5 mm) in 2015. Also, 1976 emerged as the year with lowest PET value of 37 mm. Appealing patterns in the oscillation of PET also displayed a sharp rise of about 2.9 mm between 1976 and 1977 and 2.9 mm and a corresponding decline amounting to 1.6 mm between 1998 and 1999. On the whole, PET showed a rising trend at annual rate of 0.001 mm (R2 = 0.006).
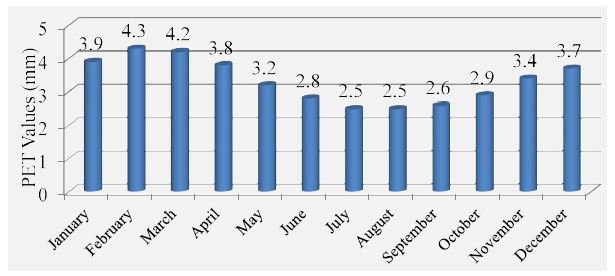
Figure 10: Monthly pattern of potential evapotranspiration in Edo North
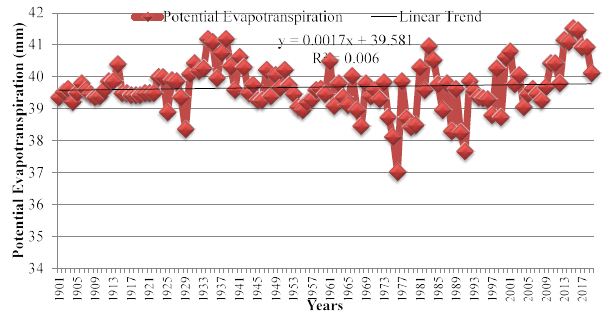
Figure 11: Annual trends and coefficient of variation of potential evapotranspiration in Edo North (1901-2019)
In order to investigate the long term change of TMin, TMax, rainfall and PET from 1901 to 2019 and short term change in SM from 1982 to 2018 in Edo North, the 119 years and 37 years climatic periods (CP) were segmented into four distinct sub-periods. The long term change in TMin, TMax, rainfall and PET spanned 30 years each with the last sub-CP being 29 years (1901-1930, 1931-1960, 1961-1990 and 1991-2019). On the other hand, the short term change in SM each spanned10years with the last sub-CP being 7 years (1982-1991, 1992-2001, 2002-2011 and 2012-2018) as found in previous studies. Analysis of variance (ANOVA) was used to evaluate the differences in their means and the result is presented in Table 3. TMin recorded F-value of 6.900 Between Groups with p-value of 0.00 whereas TMax recorded F-value of 17.778 Between Groups with p-value of 0.00. Rainfall recorded F-value of 0.160 Between Groups with p-value of 0.923 whereas soil moisture (0-40 cm) recorded F-value of 1.684 Between Groups with p-value of 0.189. In addition, PET recorded F-value of 5.788, Between Groups with p-value of 0.001. To further identify the decades where the variation in ACE actually resided, TUKEY test was deployed. The result is presented in Table 4.
Table 3: ANOVA Results of Agro-Climatic Elements in the Edo North
|
Agro-Climatic Elements |
Sum of Squares | df | Mean Square | F |
Sig. |
|
| Minimum Temperature | Between Groups |
2.032 |
3 | 0.677 | 6.900 |
0.000 |
| Within Groups |
11.291 |
115 |
0.098 |
|||
| Total |
13.324 |
118 |
||||
| Maximum Temperature | Between Groups |
4.517 |
3 | 1.506 | 17.778 |
0.000 |
| Within Groups |
9.739 |
115 |
.085 |
|||
| Total |
14.256 |
118 |
||||
| Rainfall | Between Groups |
15031.300 |
3 | 5010.43 | 0.160 |
0.923 |
| Within Groups |
3609469.284 |
115 |
31386.69 |
|||
| Total |
3624500.584 |
118 |
||||
| Soil Moisture (0-40cm) | Between Groups |
0.070 |
3 | 0.023 | 1.684 |
0.189 |
| Within Groups |
0.455 |
33 |
0.014 |
|||
| Total |
0.524 |
36 |
||||
| PET | Between Groups |
8.900 |
3 | 2.967 | 5.788 |
0.001 |
| Within Groups |
58.944 |
115 |
0.513 |
|||
| Total |
67.843 |
118 |
||||
Table 4: Tukey HSD Post Hoc Tests for Multiple Comparisons
|
Dependent Variable |
Climatic Period (I) | Climatic Period (J) | Mean Difference (I-J) | Standard Error | Sig. | 95% Confidence Interval | |
| Lower Bound |
Upper Bound |
||||||
| Minimum Temperature | 1901-1930 | 1931-1960 |
-.1656 |
.0809 | .177 | -.376 |
.045 |
| 1961-1990 |
.0307 |
.0809 | .981 | -.180 |
.242 |
||
| 1991-2019 |
-.2943* |
.0816 | .003 | -.507 |
-.082 |
||
| 1931-1960 | 1901-1930 |
.1656 |
.0809 | .177 | -.045 |
.376 |
|
| 1961-1990 |
.1963 |
.0809 | .078 | -.015 |
.407 |
||
| 1991-2019 |
-.1287 |
.0816 | .396 | -.341 |
.084 |
||
| 1961-1990 | 1901-1930 |
-.0307 |
.0809 | .981 | -.242 |
.180 |
|
| 1931-1960 |
-.1963 |
.0809 | .078 | -.407 |
.015 |
||
| 1991-2019 |
-.3250* |
.0816 | .001 | -.538 |
-.112 |
||
| 1991-2019 | 1901-1930 |
.2943* |
.0816 | .003 | .082 |
.507 |
|
| 1931-1960 |
.1287 |
.0816 | .396 | -.084 |
.341 |
||
| 1961-1990 |
.3250* |
.0816 | .001 | .112 |
.538 |
||
| Maximum Temperature | 1901-1930 | 1931-1960 |
-.1710 |
.0751 | .110 | -.367 |
.025 |
| 1961-1990 |
.0429 |
.0751 | .941 | -.153 |
.239 |
||
| 1991-2019 |
-.4561* |
.0758 | .000 | -.654 |
-.259 |
||
| 1931-1960 | 1901-1930 |
.1710 |
.0751 | .110 | -.025 |
.367 |
|
| 1961-1990 |
.2139* |
.0751 | .026 | .018 |
.410 |
||
| 1991-2019 |
-.2851* |
.0758 | .002 | -.483 |
-.088 |
||
| 1961-1990 | 1901-1930 |
-.0429 |
.0751 | .941 | -.239 |
.153 |
|
| 1931-1960 |
-.2139* |
.0751 | .026 | -.410 |
-.018 |
||
| 1991-2019 |
-.4990* |
.0758 | .000 | -.697 |
-.301 |
||
| 1991-2019 | 1901-1930 |
.4561* |
.0758 | .000 | .259 |
.654 |
|
| 1931-1960 |
.2851* |
.0758 | .002 | .088 |
.483 |
||
| 1961-1990 |
.4990* |
.0758 | .000 | .301 |
.697 |
||
| Rainfall | 1901-1930 | 1931-1960 |
19.9001 |
45.74 | .972 | -99.352 |
139.153 |
| 1961-1990 |
21.6809 |
45.74 | .965 | -97.572 |
140.933 |
||
| 1991-2019 |
-3.1400 |
46.14 | 1.000 | -123.416 |
117.136 |
||
| 1931-1960 | 1901-1930 |
-19.9001 |
45.74 | .972 | -139.153 |
99.352 |
|
| 1961-1990 |
1.7807 |
45.74 | 1.000 | -117.472 |
121.033 |
||
| 1991-2019 |
-23.0402 |
46.13 | .959 | -143.316 |
97.236 |
||
| 1961-1990 | 1901-1930 |
-21.6809 |
45.74 | .965 | -140.933 |
97.572 |
|
| 1931-1960 |
-1.7807 |
45.74 | 1.000 | -121.033 |
117.472 |
||
| 1991-2019 |
-24.8209 |
46.14 | .950 | -145.097 |
95.455 |
||
| 1991-2019 | 1901-1930 |
3.1400 |
46.14 | 1.000 | -117.136 |
123.416 |
|
| 1931-1960 |
23.0402 |
46.14 | .959 | -97.236 |
143.316 |
||
| 1961-1990 |
24.8209 |
46.14 | .950 | -95.455 |
145.097 |
||
| Soil Moisture (0-40cm) | 1982-1991 | 1992-2001 |
-.04278 |
0.053 | .847 | -.1848 |
.0992 |
| 2002-2011 |
-.11655 |
0.053 | .139 | -.2585 |
.0254 |
||
| 2012-2018 |
-.05734 |
.0579 | .755 | -.2138 |
.0991 |
||
| 1992-2001 | 1982-1991 |
.04278 |
.053 | .847 | -.0992 |
.1848 |
|
| 2002-2011 |
-.07377 |
.053 | .505 | -.2158 |
.0682 |
||
| 2012-2018 |
-.01455 |
.058 | .994 | -.1710 |
.1419 |
||
| 2002-2011 | 1982-1991 |
.11655 |
.053 | .139 | -.0254 |
.2585 |
|
| 1992-2001 |
.07377 |
.053 | .505 | -.0682 |
.2158 |
||
| 2012-2018 |
.05921 |
.058 | .737 | -.0973 |
.2157 |
||
| 2012-2018 | 1982-1991 |
.05734 |
.058 | .755 | -.0991 |
.2138 |
|
| 1992-2001 |
.01455 |
.058 | .994 | -.1419 |
.1710 |
||
| 2002-2011 |
-.05921 |
.058 | .737 | -.2157 |
.0973 |
||
| PET | 1901-1930 | 1931-1960 |
-.3638 |
.1849 | .206 | -.846 |
.118 |
| 1961-1990 |
.2699 |
.1849 | .465 | -.212 |
.752 |
||
| 1991-2019 |
-.3907 |
.1864 | .161 | -.877 |
.095 |
||
| 1931-1960 | 1901-1930 |
.3638 |
.1849 | .206 | -.118 |
.846 |
|
| 1961-1990 |
.6337* |
.1849 | .005 | .152 |
1.116 |
||
| 1991-2019 |
-.0269 |
.1864 | .999 | -.513 |
.459 |
||
| 1961-1990 | 1901-1930 |
-.2699 |
.1849 | .465 | -.752 |
.212 |
|
| 1931-1960 |
-.6337* |
.1849 | .005 | -1.116 |
-.152 |
||
| 1991-2019 |
-.6606* |
.1864 | .003 | -1.147 |
-.175 |
||
| 1991-2019 | 1901-1930 |
.3907 |
.1864 | .161 | -.095 |
.877 |
|
| 1931-1960 |
.0269 |
.1864 | .999 | -.459 |
.513 |
||
| 1961-1990 |
.6606* |
.1864 | .003 | .175 |
1.147 |
||
| *The mean difference is significant at the 0.05 level. | |||||||
As it could be seen, the actual change in the long term mean of TMin resided between 1901-1930 and 1991-2019 with Mean Difference (I-J) of -0.2943 and standard error (SE) of 0.0816 and p-value of 0.003. Change in TMin also occurred between 1961-1990 and 1991-2019 with I-J of -0.3250, SE of 0.0816 and p-value of 0.001. Also, the actual change in the long term mean of TMax dwelled between 1901-1930 and 1991-2019 with I-J of -0.4561, SE of 0.0758 and p-value of 0.000. Change in TMax also occurred between 1931-1960 and 1961-1990 with I-J of 0.2139, SE of .0751 and p-value of 0.026 as well as between 1991-2019 with I-J of -0.2851, SE of 0.0758 and p-value of 0.002.
Similarly, the actual change in the long term mean of PET dwelled between 1931-1960 and 1961-1990 with I-J of 0.6337, SE of 0.1849 and p-value of 0.005. Change in PEt also occurred between 1931-1960 and 1961-1990 with I-J of -0.6337, SE of 0.1849 and p-value of 0.005 as well as between 1991-2019 with I-J of -0.6606, SE of 0.1864 and p-value of 0.003. In contrast, rainfall and soil moisture (0-40 cm) showed no statistically significant change since the p-values were greater than 0.05 significant level set for the analysis. Thus, at 95% level of confidence there was marked long term change in TMin, TMax, and PET with time in Edo North while rainfall and SM showed no statistical significant change. Farmers can explore the opportunities offered by the near normal pattern of rainfall and SM in Edo North in their planning farming operations to boost crop yield.
When households are negatively impacted by climate change, it is very common practice to deploy adaptation measures to boost resilience. In many instances, the extent of efficiency or workability of each adaptation strategies are unknown, hence this study also sought to unravel the climate change adaptation measure based on the farmers’ experience in the study area (Table 5). It can be seen from the table that using improved crop varieties as climate change adaptation strategy was highly efficient (HE) to 291 (57.2%), Efficient to 201 (39.4%) SCF, Inefficient to 4 (0.8%) SCF and highly inefficient (HIE) to 13 (2.5%). Fadina and Barjolle [77] showed that majority (38.3%) of the respondents in the Zou Department of South Benin Republic had attested to the efficiency of using improved crop varieties as climate change adaptation strategies (CCAS). Availability/access to improved crop varieties may have been the rationale for other respondents to state that it was Inefficient/HIE. Incidentally, this CCAS was ranked 1st in the continuum based on the weighted mean score (WMS) of 4.51. The 2nd most deployed and efficient CCAS based on the WMS of 4.49 was using early maturing plants. This is based on the fact that 295 (57.9%) of the respondents considered it highly efficient while and 191 (37.5%) considered the measure to be efficient. This finding agree with earlier study by [78] who asserted that maize species with shorter growth period boosted overall yield in South-eastern USA. In contrast, [79] reported that the use of late-maturing hybrid species of maize was one of the HE CCAS in the Republic of Moldova.
Table 5: Climate Change Adaptation Strategies and Extent of Efficiency
|
Constraints |
Extent of Efficiency | WMS/Rank | ||||||
| Highly efficient |
Efficient | Inefficient | Highly Inefficient | Can’t tell |
Total |
|||
| Using improved crop varieties | Count (%)/ |
291 (57.2) |
201 (39.4) | 4 (0.8) | 13 (2.5) | 0 (0.0) | 509 (100) |
4.51 |
| Weighted |
1455 |
804 | 12 | 26 | 0 | 2297 |
1st |
|
| Using early maturing plants | Count (%)/ |
295 (57.9) |
191 (37.5) | 2 (0.4) | 20 (4.0) | 1 (0.2) | 509 (100) |
4.49 |
| Weighted |
1475 |
764 | 6 | 40 | 1 | 2286 |
2nd |
|
| Using intensive fertilizer and/or manure application for crop production | Count (%)/ |
291 (57.2) |
195 (38.3) | 2 (0.3) | 17 (3.4) | 4 (0.8) | 509 (100) |
4.48 |
| Weighted |
1455 |
780 | 6 | 34 | 4 | 2279 |
3rd |
|
| Mixed cropping | Count (%)/ |
305 (60.0) |
164 (32.2) | 15 (3.0) | 21 (4.2) | 4 (0.6) | 509 (100) |
4.46 |
| Weighted |
1525 |
656 | 45 | 42 | 4 | 2272 |
4th |
|
| Practicing land and/or crop rotation | Count (%)/ |
278 (54.5) |
203 (39.8) | 2 (0.4) | 22 (4.4) | 4 (0.8) | 509 (100) |
4.43 |
| Weighted |
1390 |
812 | 6 | 44 | 4 | 2256 |
5th |
|
| Change in planting/stocking time | Count (%)/ |
271 (53.2) |
197 (38.7) | 14 (2.8) | 27 (5.3) | 0 (0.0) | 509 (100) |
4.4 |
| Weighted |
1355 |
788 | 42 | 54 | 0 | 2239 |
6th |
|
| Changing from production of agriculture to marketing | Count (%)/ |
216 (42.5) |
184 (36.1) | 27 (5.4) | 42 (8.2) | 40 (7.8) | 509 (100) |
4.33 |
| Weighted |
1080 |
920 | 81 | 84 | 40 | 2205 |
7th |
|
| Planting deeper than the usual planting depth to prevent scorching | Count (%)/ |
255 (50.2) |
210 (41.3) | 2 (0.4) | 39 (7.6) | 3 (0.5) | 509 (100) |
4.32 |
| Weighted |
1275 |
840 | 6 | 78 | 3 | 2202 |
8th |
|
| Using nursery for transplantable crops | Count (%)/ |
254 (50.0) |
190 (37.4) | 28 (5.4) | 27 (5.3) | 10 (1.9) | 509 (100) |
4.28 |
| Weighted |
1270 |
760 | 84 | 54 | 10 | 2178 |
9th |
|
| Use of mulching materials for crops | Count (%)/ |
255 (50.1) |
192 (37.7) | 9 (1.7) | 49 (9.7) | 4 (0.8) | 509 (100) |
4.27 |
| Weighted |
1275 |
768 | 27 | 98 | 4 | 2172 |
10th |
|
| Skipping storage but processing and marketing immediately after harvest | Count (%)/ |
241 (47.3) |
195 (38.4) | 23 (4.5) | 41 (8.1) | 9 (1.7) | 509 (100) |
4.21 |
| Weighted |
1205 |
780 | 69 | 82 | 9 | 2145 |
11th |
|
| Change of harvesting date | Count (%)/ |
237 (46.5) |
204 (40.0) | 17 (3.4) | 30 (5.6) | 21 (4.1) | 509 (100) |
4.19 |
| Weighted |
1185 |
816 | 51 | 60 | 21 | 2133 |
12th |
|
| Collection of runoff water in ditches for drought periods | Count (%)/ |
225 (44.2) |
179 (35.1) | 50 (9.8) | 43 (8.5) | 12 (2.4) | 509 (100) |
4.1 |
| Weighted |
1125 |
716 | 150 | 86 | 12 | 2089 |
13th |
|
| Expansion of farming land | Count (%)/ |
241 (47.3) |
164 (32.3) | 19 (3.8) | 79 (15.5) | 6 (1.1) | 509 (100) |
4.09 |
| Weighted |
1205 |
656 | 57 | 158 | 6 | 2082 |
14th |
|
| Raising walls with sand bags and/or blocks to divert flood water | Count (%)/ |
234 (45.9) |
182 (35.7) | 17 (3.4) | 50 (9.8) | 26 (5.2) | 509 (100) |
4.08 |
| Weighted |
1170 |
728 | 51 | 100 | 26 | 2075 |
15th |
|
| Construction of drainage system or dam within farm/household | Count (%)/ |
236 (46.4) |
195(38.3) | 16 (3.2) | 57 (11.2) | 5 (0.9) | 509 (100) |
4 |
| Weighted |
1088 |
780 | 48 | 114 | 5 | 2035 |
16th |
|
| Subsidizing of agricultural inputs by relevant authorities | Count (%)/ |
206 (40.4) |
190 (37.4) | 41 (8.1) | 39 (7.7) | 33 (6.4) | 509 (100) |
3.98 |
| Weighted |
1030 |
760 | 123 | 78 | 33 | 2024 |
17th |
|
| Construction of foot bridges with wood, stones and sand bags | Count (%)/ |
231 (45.3) |
187 (36.8) | 37 (7.3) | 54 (10.6) | 0 (0.0) | 509 (100) |
3.97 |
| Weighted |
1056 |
748 | 111 | 108 | 0 | 2023 |
18th |
|
| Sand filling water logged area to reclaim lost land | Count (%)/ |
215 (42.4) |
182 (35.7) | 35 (6.9) | 37 (7.2) | 40 (7.8) | 509 (100) |
3.97 |
| Weighted |
1075 |
728 | 105 | 74 | 40 | 2022 |
18th |
|
| Giving the affected farmers financial support | Count (%)/ |
227 (44.6) |
161 (31.6) | 29 (5.6) | 61 (12.0) | 31 (6.2) | 509 (100) |
3.96 |
| Weighted |
1135 |
644 | 87 | 122 | 31 | 2019 |
19th |
|
| Sinking of boreholes in farm to ensure water availability/artificial irrigation | Count (%)/ |
195 (38.3) |
171 (33.5) | 54 (10.6) | 63 (12.4) | 26 (5.2) | 509 (100) |
3.88 |
| Weighted |
975 |
684 | 162 | 126 | 26 | 1973 |
20th |
|
| Resettlement of communities from hazard zones | Count (%)/ |
176 (34.5) |
159 (31.2) | 28 (5.6) | 67 (13.1) | 79 (15.6) | 509 (100) |
3.56 |
| Weighted |
880 |
636 | 84 | 134 | 79 | 1813 |
21st |
|
| Setting up of housing programmes for displaced farmers | Count (%)/ |
108 (21.2) |
174 (34.3) | 94 (18.4) | 73 (14.3) | 60 (11.8) | 509 (100) |
3.39 |
| Weighted |
540 |
696 | 282 | 146 | 60 | 1724 |
22nd |
|
On the application of intensive fertilizer and/or manure application for crop production as CCAS, 291 (57.2%) of the respondents deem it highly efficient, while 195 (38.3%) considered it efficient. Despite the fact that 2 (0.3%) regard it as being inefficient, 17 (3.4%) believe it to be highly inefficient. Another 4 (0.8%) of the respondents can’t tell the extent of efficiency. The use of fertilizer and manure was considered 3rd most deployed measure based on the WMS of 4.48. The insignificant percentage of respondents that considers the application intensive fertilizer and/or manure application for crop production inefficient or highly inefficient may have missed the timing of deployment of the adaptation measure, had little/no access to it or the fertilizer washed away by rainfall immediately after application. Amali and Namo [80] in a study of growth and yield of maize in Jos, Plateau State and Kartika et al. [81] on rice at Pemulutan District, South Sumatra, Indonesia reported that incorrect fertilizer application can lead to loss of valuable nutrients, fertilizer wastage as well as injuries to the crop subsequent reduction in the final yield.
About 60% of the respondents considered mixed cropping to be highly efficient, while 164 (32.2%) adjudged it efficient. This CCAS was however, the 4th most deployed measure based on the WMS of 4.46 notwithstanding the fact that 15 (3%) regard it as being inefficient and 21 (4.2%) highly inefficient. Mix cropping has been found to be very useful in boosting farmers’ resilience to CC impact owing to the discriminatory effects of CC on most arable, staple and perennial crops. Thornton et al., [82] reported that mixed cropping is the fulcrum of farming in sub-Saharan Africa based on its ability to guarantee secured and sustainable supply of foodstuff and employment opportunities to greater proportion of the population particularly in rural areas. The 5th most perceived and deployed CCAS based on the WMS of 4.43 was the practice of land and/or crop rotation. This stemmed from the responses of 278 (54.5%) of the respondents who adjudge it as highly efficient and 203 (39.8%) who regarded it as being effective. Only 2 (0.4%) and 22 (4.4%) of the sampled respondents believed that crop rotation was ineffective and highly efficient measure for climate change adaptation. When cultivated lands and left fallow for a period, soil regains its fertility status and during crop rotation, unutilized nutrients are made available to new the new cop thereby increasing yield. This finding agrees with that of Fadina and Barjolle [77] who reported land and/or crop rotation as the 2nd most efficient CCAS adopted by farmers (based on the response of 37% of the respondents) in Southern Benin Republic.
Change in planting/stocking time was considered highly efficient (53.2%), efficient (n = 197; 38.7%), inefficient (n = 14; 2.8%) and highly inefficient (n = 27; 5.3%). With WMS of 4.4 this adaptation strategy is ranked 6th in the continuum of CCAS in the study area. The change in planting/stocking time may not be unconnected the changeability in climatic element particularly rainfall. Crop farmers want to ensure that after cultivation, their seedling does not end up dying on soil or experience stunting due to unavailability of sufficient soil moisture. This finding consistent with previous study by Akinnagbe and Irohibe [83] who reported alteration of cultivation model and farming schedule as dependable antidotes to adverse effects of unreliable precipitation regime on agriculture. About 42.5% of the respondents rated changing from production of agriculture to marketing highly efficient, 184 (36.1%) ranked it as efficient, 27 (5.4%) adjudged it as inefficient, 42 (8.2%) regarded the strategy as being highly inefficient, while 40 (7.8%) can’t tell the extent of efficiency. Equally, changing from production of agriculture to marketing was ranked 7th based on the WMS of 4.33.
On the efficiency of planting deeper than the usual planting depth to prevent scorching, the sampled respondents rated it highly efficient by 255 (50.2%), efficient (n = 210; 41.3%), inefficient (n = 2; 0.4%), highly inefficient (n = 39; 7.6%) and can’t tell (n = 3; 0.5%). The WMS of 4.32 placed this CCAS 8th in the order of efficiency and most utilized by the farmers. Using nursery for transplantable crops as CCAS was perceived highly efficient by 254 (50%), efficient (n = 190; 37.4%), inefficient (n = 28; 5.4%), HIE (n = 27; 5.3%) and can’t tell (n = 10; 1.9%). The WMS of 4.28 placed this CCAS 9th in the order of efficiency and most utilized by the farmers. Application of mulching materials for crops as CCAS was considered highly efficient by 255 (50.1%), efficient (n = 192; 37.7%), inefficient (n = 9; 1.7%), HIE (n = 49; 9.7%) and can’t tell (n = 4; 0.8%). The WMS of 4.27 placed this CCAS 10th in the order of efficiency and most utilized by the farmers.
The 11th most adopted and efficient CCAS based on the WMS of 4.21 was skipping storage but processing and marketing immediately after harvest. A total of 241 (47.3%) of the respondents considered this measure to be highly efficient, 195 (38.4%) considering it as efficient, 23 (4.5%) regarding it as being inefficient, 41 (8.1%) deeming it HIE and 9 (1.7%) can’t tell the extent of efficiency.
Similarly, the 12th most deployed and efficient CCAS based on the WMS of 4.19 was change of harvesting date. This is based on the assertion of 237 (46.5%) of the respondents who considered the strategy to be highly efficient and 204 (40%) as efficient, whereas 17 (3.4%) and 30 (5.6%) adjudged it to be inefficient and highly inefficient strategy respectively. The collection of runoff water in ditches for drought periods as CCAS, was considered highly efficient at 225 (44.2%) and 179 (35.1%) as efficient adaptation strategy for changing climate. On the expansion of farming land as CCAS, 241 (47.3%) of the respondents considered this measure to be highly efficient, while 164 (32.3%) adjudged it efficient. This CCAS was nevertheless, the 14th most deployed measure based on the WMS of 4.09 notwithstanding the fact that 19 (3.8%) regard it as being inefficient and 79 (15.5%) highly inefficient even as 6 (1.1%) SCF can’t tell the extent of efficiency. The inefficiency of this CCAS can be linked to the challenges on the existing land tenure and ownership system in the area. A situation where majority (55.9%) of the farmers owned about 1-5 hectares, expansion of learning, practicing farming land as a measure to boost resilience to climate change effect becomes practically unfeasible. The 15th most perceived, deployed and efficient CCAS based on the WMS of 4.08 was raising walls with sand bags and/or blocks to divert flood water. This originated from the responses of 234 (45.9%) of the respondents who adjudge it as highly efficient and 182 (35.7%) who regarded it as being effective. Nevertheless, about 17 (3.4%) and 50 (9.8%) of the sampled respondents believed it to be ineffective and highly inefficient respectively while 26 (5.2%) can’t tell the extent of efficiency. With respect to construction of drainage system or dam within farm/household as CCAS, 236 (46.4%) respondents reported highly efficient, efficient (n = 195; 38.3%), inefficient (n = 16; 3.2%) and HIE (n = 57; 11.2%) while 5 (0.9%) can’t tell the extent of efficiency. The WMS of 4.0 placed the CCAS 16th in the continuum. Similarly, 206 (40.4%) of the respondents rated subsidizing of agricultural inputs by relevant authorities as CCAS highly efficient, 190 (37.4%) ranked it as efficient, 41 (8.1%) adjudged it as inefficient, 39 (7.7%) regard it as being HIE while 33 (6.4%) can’t tell the extent of efficiency. The CCAS was ranked 17th based on the WMS of 3.98.
The extent of efficiency of construction of foot bridges with wood, stones and sand bags as CCAS was rated highly efficient by 231 (45.3%), efficient (n = 187; 36.8%), inefficient (n = 37; 7.3%) and highly inefficient (n = 54; 10.6%). Also, sand filling water logged area to reclaim lost land as CCAS was rated highly efficient by 215 (42.4%), efficient (n = 182; 35.7%), inefficient (n = 35; 6.9%), highly inefficient (n = 37; 7.2%) and can’t tell (n = 40; 7.8%). Interestingly, construction of foot bridges with wood, stones and sand bags and sand filling water logged area to reclaim lost land had the same WMS of 3.97 hence, ranked as the 18th most deployed and efficient CCAS in the study area. Furthermore, the extent of efficiency of giving the affected farmers financial support as CCAS was perceived as highly efficient by 227 (44.6%), efficient (n = 161; 31.6%), inefficient (n = 29; 5.6%), highly inefficient (n = 61; 12%) and can’t tell (n = 31; 6.2%). The WMS of 3.96 placed this CCAS 19th on the table in the order of efficiency and most utilized by the farmers. Moreover, sinking of boreholes in farm to ensure water availability/artificial irrigation (WMS = 3.88) was ranked 20th, resettlement of communities from hazard zones (WMS = 3.56) ranked 21st even as setting up of housing programmes for displaced farmers (WMS = 3.39) became the 22nd most deployed CCAS in the study area.
Conclusion and Recommendations
This research was undertaken with the aim to changing partners of agro-climatic variables in relation to their effects on farming operations and efficiency of adaptation options in Edo North, Edo State. Archival data for the 119years climatic period (1901-2019) and 37 years (1982-2018) depicted various degrees of variability with marked statistical significant change in minimum and maximum temperature as well as potential evapotranspiration. The upward trends in minimum and maximum temperature as well as potential evapotranspiration are indication that the study area is gradually getting warmer and drier than before in recent history as buttressed by sampled respondents. Out of the 24 adaptation strategies already in use in the study area, the use improved crop varieties (WMS = 4.51), application of early maturing plants (WMS = 4.49) and the use of intensive fertilizer and/or manure application for crop production (WMS = 4.48) were top three most adaptation strategies deployed by farmers. The fact that other adaptation strategies are not widely employed in the study area, maybe attributed to low level of rural infrastructures, high poverty level and illiteracy etc. There therefore need for the formulation of climate change adaptation workable policy, programme development/implementation that are geared towards massive rural infrastructure transformations and access to extension services. Furthermore, governments, NGOs and other stakeholders should make available climate change adaptation strategies at reduced or no cost to the farmers to boost their resilience.
References
- Omotosho DO (2007) Farmer’s perception of the impact of climate change on agricultural development in Edo State. Ph.D Project of the Department of Agriculture Economics, Michael Opkara University of Agriculture, Umudike
- Odjugo PA (2010) General Overview of Climate Change Impacts in Nigeria. Journal of Human Ecology 29: 47-55.
- Udenyi OG (2010) Impacts of Climate Change. Nigeria Social Network.
- Ebele NE, Emodi NV (2016) Climate change and its impact in Nigerian economy. Journal of Scientific Research & Reports 10: 1-13.
- Elisha I (2017) Evidence of climate change and adaptation strategies among grain farmers in Sokoto State, Nigeria. IOSR Journal of Environmental Science, Toxicology and Food Technology (IOSR-JESTFT) 11: 1-7.
- Adepoju AA (2019) Climate Change and Health in Nigeria. Nigerian Tribune.
- Ilevbare FM (2019) Investigating effects of climate change on health Risks in Nigeria. IntechOpen
- Haider H (2019) Climate change in Nigeria: Impacts and responses. K4D Helpdesk Report 675. Brighton, UK: Institute of Development Studies
- Butu AW, Emeribe CN (2019) Spatial patterns of climatic variability and water budget over Sudan Savannah Region of Nigeria. African Journal of Environmental Science and Technology 13: 464-480.
- Emeribe CN, Ezeh CU, Butu AW (2020a) Climatic Water Balance Over Two Climatic Periods and Effect on Consumptive Water Need of Selected Crops in the Chad Basin, Nigeria. Agric Res 10: 131-147.
- Audu EB, Audu HO, Binbol NL, Gana JN (2013) Climate Change and Its Implication on Agriculture in Nigeria. Abuja Journal of Geography and Development 3: 8-19.
- Obi CO (2010) Climate Change and Management of Degraded Soils for Sustainable Crop of Production. Tropical Built Environment Journal 1.
- Ayoade JO (2002) Introduction to agroclimatology. Vintage, Publisher, Ibadan.
- Kim C (2009) Strategies for Implementing Green Growth in Agricultural Sector.” in Proceedings in Green Korea 2009 – Green Growth and Cooperation. National Research Council for Economics, Humanities and Social Science.
- Abubakar AZ (2012) Effects of urbanization on land use/ land cover changes in Birnin Kebbi, Kebbi State, Nigeria. M.Sc Dissertation submitted to School of Post Graduate Studies, Ahmadu Bello University, Zaria, For The Award of Master of Science Degree in Remote Sensing and Geographic Information System, Department of Geography.
- Abugu SO, Onuba CO (2015) Climate change and pastoral conflicts in the middle belt and south-east Nigeria: Implication on human resource of the regions. Global Journal of Human Resource Management 3: 44-51.
- Fasona M, Omojola A (2005) Climate Change, Human Security and Communal Clashes in Nigeria (paper, International Workshop on Human Security and Climate Change, Asker, Oslo, June 21–23, 2005)
- Fabiyi M, Otunuga A (2016) Why The Fulani Herdsmen and Farmers Fight: How Climate Change and The Boko Haram Crisis Created The Crisis and Six (6) Evidence-Based Policy Recommendations For Its Resolution.
- Adeoye NO (2017) Land Use Conflict between Farmers and Herdsmen in parts of Kano, Yobe and Borno States of Nigeria: Nomads Viewpoint. Ghana Journal of Geography 9: 127-151.
- Odigbo JO (2019) Grazing Conundrum: Herdsmen–Farmers Conflict and Internal Security in Nigeria, in Internal Security Management in Nigeria: Perspectives, Challenges and Lessons, eds. Oshita O Oshita, Ikenna Mike Alumona and Freedom Chukwudi Onuoha (Berlin: Springer Nature, 2019), 99-12
- Adeniran AI (2020) Climatic Factors in Nigeria’s Farmer–Herder Conflict. Policy Briefing Climate Change and Migration May 202
- Abugu NA, Odele M, Ogah TA, Yero AB (2020) Analysis of Climate Variables and Resource Conflict in Benue State, Nigeria. WJIR 9.
- Abugu NA, Yero AB, Odele MO, Irene AM (2021) Reviewing the Links between Climate Change and Resource Conflict. Global Journal OF pure and Applied Sciences 27: 243-152.
- Mendelsohn R (2006) Climate change impacts on agriculture. In Evenson R & Pingali P (eds), Volume III: Handbook of Agricultural Economics: Agricultural Development Chapter 19.
- World Bank (2011) Guide to Climate Change Adaptation in Cities, The World Bank Group, Washington.
- Smith K, Barrett CB, Box PW (2000) Participatory risk mapping for targeting research and assistance: with an example from East African pastoralists. World Development 28: 1945-1959.
- Bryant CR, Smit B, Brklacich M, Johnston T, Smithers J, et al. (2000) Adaptation in Canadian agriculture to climatic variability and change. Clim Change 45: 181-201.
- Oyekale AS, Bolaji MB, Olowa OW (2009) The Effects of Climate Change on Cocoa Production and Vulnerability Assessment in Nigeria. Agricultural Journal 4: 77-80.
- Awotoye OO, Mathew OJ (2010) Effects of temporal changes in climate variables on crop production in tropical sub-humid South-western, Nigeria. African Journal of Environmental Science and Technology 4: 500-505.
- Oladipo E (2010) Towards Enhancing the Adaptive capacity of Nigeria: A Review of the Country’s Preparedness for Climate Change Adaptation, A Report Submitted to Heinrich Böll Foundation, Nigeria.
- Sayne A (2011) Climate change adaptation and conflict in Nigeria. Washington, DC: USIP.
- Adesina FA, Odekunle TO (2011) Climate change and adaptation in Nigeria: some background to Nigeria’s response – III. In: International conference on environmental and agriculture engineering IPCBEE, vol 15. IACSIT Press, Singapore
- Ozor N, Nnaji C (2011) The role of extension in agricultural adaptation to climate change in Enugu State, Nigeria. Journal of Agricultural Extension and Rural Development 3: 42-50.
- Adebayo K, Dauda TO, Rikko LS, George FOA, Fashola OS, et al. (2011) Emerging and indigenous technology for climate change adaptation in southwest Nigeria (ATPS Research Paper No. 10). Nairobi: African Technology Policy Studies Network
- Farauta BK, Idrisa YL, Egbule CL, Agu VC (2011) Farmers’ perceptions of climate change and adaptation strategies in Northern Nigeria: An empirical assessment’ African Technology Policy Studies Network Research Paper | No. 15
- Adebanjo OM (2013) The effects of climate change adaptation strategies on food crop production efficiency in Southwestern Nigeria. PhD thesis. Department of Agricultural Economics, University Of Nigeria.
- Atedhor GO (2015) Agricultural Adaptation Strategies to Climate Change in Sokoto State, Semi-Arid Region of Nigeria. Journal of the Environment 9: 25-41.
- Onyeneke RU, Mmagu CJ, Aligbe JO (2017) Crop farmers’ understanding of climate change and adaptation practices in Southeast Nigeria. World Rev Sci Technol Sustain Dev 13: 299-318.
- Adeagbo OA, Adeagbo TO, Ojo AA, Adetoro (2021) Understanding the determinants of climate change adaptation strategies among smallholder maize farmers in South-west, Nigeria. Heliyon 7: 06231.
- Oriakhi LO, Ekunwe PA, Erie GO, Ososogie DI (2017) Socio-economic Determinants of Farmers’ Adoption of Climate Change Adaptation Strategies in Edo State, Nigeria. Nigerian Journal of Agriculture, Food and Environment 13: 115-121.
- Ofuoku Albert (2011) Rural Farmers’ Perception of Climate Change in Central Agricultural Zone of Delta State, Nigeria. Indonesian Journal of Agricultural Science 12: 63.
- Remling E, Veitayaki J (2016) Community-based action in Fiji’s Gau Island: a model for the Pacific?. International Journal of Climate Change Strategies and Management 8: 375-398.
- National Population Commission (2010) National Population Commission. Report on the 2006 Census Result. Federal Republic of Nigeria Official Gazette, Abuja, B24.
- Banmeke TOA, Fakoya EO, Ayanda IF (2012) Agricultural Researchers’ Awareness of the Causes and Effects of Climate Change in Edo State, Nigeria. Journal of Agricultural Science 4: 233-238.
- Ayoade JO (2003) Tropical Hydrology and Water Resources. Ibadan Agbo Areo Publishers.
- Emaikwu, S.O. (2008). Fundamentals of educational research methods and statistics Kadunna: Deray Punts Ltd
- Ogundele OJK (2004) Wealth Creation through the Development of indigenous Technology, 12 national Conference Environments and Behavior of Association of Nigeria, University of Agriculture, Abeokuta, 24-26 November
- Mitchell ML, Jolley JM (2012) Research design explained (8th ed.). Belmon: Wadsworth Cengage Learning
- Atedhor GO (2016) Growing Season Rainfall Trends, Alterations and Drought Intensities in the Guinea Savanna Belt of Nigeria: Implications on Agriculture. Journal of Environment and Earth Science 6.
- Udofia EP (2011) Applied Statistic with Multivariate Methods. Enugu, IPL, 287 & 414.
- IPCC (2007) Annex B. Glossary of terms. Intergovernmental Panel on Climate Change.
- Ekpenyong RE (2015) An Sssessment of the Perceived Signs of Climate Change in Uyo Capital City-Akwa Ibom State, Nigeria. Asian Academic Research Journal of Social Sciences & Humanities 1: 166-181.
- Tukey JW (1977) Exploratory Data Analysis. Reading, MA: Addison-Wesley.
- Hoaglin DC, Mosteller F, Tukey JW (1983) Understanding Robust and Exploratory Data Analysis. New York: John Wiley and Sons.
- Olubanjo OO (2016) Evaluation of Quality of Rainwater Harvested from Different Roof
Catchments Systems. Journal of Sustainable Technology 7: 14-20. - Nyatuame M, Owusu-Gyimah V, Ampiaw F (2014) Statistical analysis of rainfall trend for Volta region in Ghana. J. Atmos. Sci. 2014: 1–11.
- Asare-Nuamah P, Botchway (2019) Understanding climate variability and change: analysis of temperature and rainfall across agroecological zones in Ghana. Heliyon 5: 02654.
- Bader (2003) The impact of decadal-scale Indian Ocean Sea surface temperature anomalies on Sahelian rainfall and the North Atlantic Oscillation. Geophysical Research Letters 30: 2169.
- Lamb PJ (1978a) Case studies of tropical Atlantic surface circulation patterns during recent sub-Saharan weather anomalies: 1967 and 1968. Wea. Rev 106: 482-491.
- Lamb PJ (1978b) Large-scale tropical Atlantic surface circulation patterns associated with sub-Saharan weather anomalies. Tellus 30: 240-251.
- Hastenrath S (1990) Decadal-scale changes of the circulation in the tropical Atlantic sector associated with Sahel drought. Int J Climatol 10: 459-472.
- Vizy EK, Cook KH (2001) Mechanisms by which Gulf of Guinea and eastern North Atlantic Sea surface temperature anomalies can influence African rainfall. J Clim 14: 795-821.
- Vizy EK, Cook KH (2002) Development and application of a mesoscale climate model for the tropics: influence of sea surface temperature anomalies on the West African monsoon. J Geophys Res 107: 4023.
- Lucas C, Timbal B, Nguyen H (2014) The expanding tropics: A critical assessment of the observational and modeling studies. Wiley Interdiscip. Rev. Clim. Chang 5: 89-112.
- Olubanjo OO, Alade AE (2018) Effect of Climate Variability on the Yield of Crops in Ondo State, Nigeria. International Journal of Water Resources and Environmental Engineering 10: 54-63.
- Janicot S, Moron V, Fontaine B (1996) Sahel drought and ENSO dynamics. Geophys Res Lett 23: 515-518.
- Rowell DP (2001) Teleconnection between the tropical Pacific and the Sahel. QJR Meteorol Soc 127: 1683-1706.
- Palmer TN (1986) Influence of the Atlantic, Pacific and Indian Oceans on Sahel rainfall. Nature 320: 251-253.
- Shinoda M, Kawamura R (1994) Tropical rainbelt, circulation, and sea surface temperatures associated with the Sahelian rainfall trend. J Metab Soc Jpn 72: 341-357.
- Rowell DP (2003) The impact of Mediterranean SSTs on the Sahelian rainfall season. J Clim 16: 849-862.
- Kucharski F, Bracco A, Yoo JH, Tompkins A, Feudale L, et al. (2009) A Gill-Matsun-type mechanism explains the Tropical Atlantic influence on African and Indian Monsoon Rainfall. J. R. Met. Soc 135: 569-579.
- Losada T, Rodriguez-Fonseca B, Janicot S, Gervois S, Chauvin F, et al. (2010a) A multimodel approach to the Atlantic equatorial mode. Impact on the West African monsoon. Dyn 35: 29-43.
- Losada T, Rodriguez-Fonseca B, Polo I, Janicot S, Gervois S, et al. (2010b) Tropical response to the Atlantic Equatorial mode: AGCM multimodel approach. Clim Dyn 35: 29-43.
- Giannini A, Saravanan R, Change P (2003) Ocean forcing of Sahel Rainfall on inter-annual to inter-decadal timescales. Science 302: 1027-1030.
- Giannini A, Biasutti M, Held IM, Sobel AH (2008) A global perspective on African climate. Climatic Change 90: 359-383.
- Giannini A, Saravanan R, Chang P (2005) Dynamics of the boreal summer African monsoon in the NSIPP1 atmospheric model. Clim Dyn 25: 517-535.
- Fadina AMR, Barjolle D (2018) Farmers’ Adaptation Strategies to Climate Change and Their Implications in the Zou Department of South Benin. Environments 5: 15.
- Alexandrov A, Hoogenboom G (2000) The impact of climate variability and change on crop yield in Bulgaria. Agricultural and Forest Meteorology 104: 315-327.
- Corobov R (2002) Estimations of climate change impacts on crop production in the Republic of Moldova. Geo Journal57: 195-202.
- Amali PE, Namo OAT (2015) Effect of time of Fertilizer Application on Growth and yield of Maize (Zea Mays L.) in Jos – Plateau Environment. Global Journal of Agricultural Sciences 14: 1-9.
- Kartika K, Lakitan B, Sanjaya N, Wijaya A, Kadir S, et al. (2018) Internal-edge row comparison in jajar legowo 4:1rice planting pattern at different frequency of fertilizer applications. Agrivita 40: xx-xx.
- Thornton PK, Jones PG, Owiyo T, Kruska RL, Herrero M, Kristjanson P, Notenbaert A, Bekele N, Omolo A with contributions from V. Orindi, B. Otiende,A. Ochieng, S. Bhadwal, K. Anantram, S. Nair, V. Kumar and U. Kulkar (2006) Mapping climate vulnerability and poverty in Africa. Report to the Department forInternational Development, ILRI, Nairobi, Kenya 171.
- Akinnagbe O, Irohibe I (2014) Agricultural Adaptation Strategies to Climate Change Impacts in Africa: A Review. Bangladesh Journal of Agricultural Research 39: 407-418.