DOI: 10.31038/CST.2021632
Abstract
Data from a Mind Genomics cartography for Stand Up to Cancer, executed in 2008, were analyzed 13 years later to demonstrate the power of systematized and data based studies of communication. The Mind Genomics effort, executed in a 72-hour period, retained the value for creating a base of insights for donation behavior, as well as a searchable database for suggestions 13 years later. The value of systematic exploration was confirmed by a published report in 2010, suggesting that the 2008 study led to the most successful of the Standard Up To Cancer Simulcasts. Moving beyond the analysis of 2008, the paper demonstrates new ways to extract value from Mind Genomics data, through databasing, and through deeper, more up-to-date analyses of the study results.
Introduction
The files of corporations and individual researcher are filled with studies, many of which will never see the light of day. All too often the effort expended to answer a question is so focused that without the question and the contemporaneity of the problem to be solved, the research is simply a set of numbers, interesting when the study was run, but then quickly losing its relevance. In the words of a colleague at Tropicana (Division of Pepsi) in 1996: “I have warehouses of data, but it’s all irrelevant now, after the issue has been tackled.”
To a great extent, industrial-based research about consumers comprises the concerted effort to answer a minor question, such as ‘this idea, concept’ crate enough interest in the prospective buyer to get the customer to buy? Most of these efforts, whether dealing with products or communication, end up answering the question, but providing little additional value. The data, the report, the actual effort is all treated respectfully, with corporate guidelines issued about how to ‘close out a project,’ the appropriate paperwork to complete, and how to document what the study was about, in case someone from the corporation will need to consult the data at a later date. The process, for example, at the General Foods Corporation (Now Mondelez), was so detailed that a person had to be hired specifically to monitor the close-out process.
At the same time, however, many of the studies in industry have retained their value, far beyond the early years. Conversations with Michael Supran at the Campbell Soup Company in the 1990’s revealed that data studying the systematic variations of Prego Pasta Sauce, developed in 1982, was still being used 16 years later in 1998 to guide product development (Supran, personal communication, 1998). The same was true for other efforts as well in the food industry, up to at least 2006 (Judy Zauenbrecher, Welches’s, personal communication, 2006).
What seemed to emerge from these and other conversations was the fact that research done in a systematic manner to uncover rules about behavior often maintained value of years, even decades. What was of little value was the study so tightly focused that it yielded only a factoid rather than these rules. The realization led to the recognition that industrial, or better applied research, would do well to incorporate the effort to find rules. Indeed, in their 2007 book, Selling Blue Elephants authors [1] entitled the effort ‘Rule Development Experimentation.’ It was clear by 2007 that these studies, some twenty and thirty years old, would still yield value information to guide thinking, communication efforts, and product developments, decades later. In some respects, these rule-developing experiments were creating a sort of ‘scientific literature’ of a topic, albeit from the point of view of a corporation, and a specific application.
The reason for this introduction is to lay the groundwork for the additional information which can emerge from these studies, information that may be presented in a cursory manner to managers tasked with the job of creating the event. Yet, Mind Genomics provides an opportunity to develop a database of deeper knowledge and insight, both to create better telethons in the future, but also to understand the topic in far greater depth, an understanding which can become systemic. It is the further exploration of data, now about 13 years old, an exploration into the principles and patterns, which Mind Genomics provides as the foundation for the future.
The Stand Up To Cancer (SU2C) Project of 2008
In 2008, Stand Up To Cancer (SU2C) was just in its infancy. The vision was to fund scientists, accepting support from the ordinary citizen and business, as well as the entertainment community. The goal was to drive the solution to cancer by funding novel cancer research and promising cancer researchers [2].
The 2008 plan, the first, was to host a ‘Simulcast,’ broadcast simultaneously on the main networks. The objective was to raise awareness and to solicit donations to the charity [3]. At the time, the management of SU2C approached author Onufrey, with a request that he consider donating his time and efforts to helping SU2C discover the most impactful language. The request was made because of a family relationship of the author Onufrey with one of the key people of SU2C, and the opportunity for SU2C to avail itself of known expertise for optimizing their messages [4].
Figure 1 shows the introductory page to the report. The actual project itself was done; start to finish, in a period of 72 hours. The speed of the project was made possible by the underlying discipline and formatted output of the technology, Mind Genomics (at that time, and for that project having a different name ‘Addressable Minds’) As a consequence of the accelerated timetable, the project results were communicated in depth, and the television simulcast went on as planned. This was the positive outcome of the project, which raised the planned amount of money. At the same time, however, it was becoming increasingly clear that the project itself created a wealth of new, useful and indeed valuable information on the ‘mind of the donor.’ As happens so often, the project was filed away in summer 2008, to be resuscitated in 2021, at the time of this writing. The new objective was to extract the learning, not so much about the particular target (Stand Up To Cancer), but a base of knowledge for giving to a cancer-related cause. The disciplined experiment, the nature of the design, and the analyses provide a wealth of information about how people respond to these requests for donations.
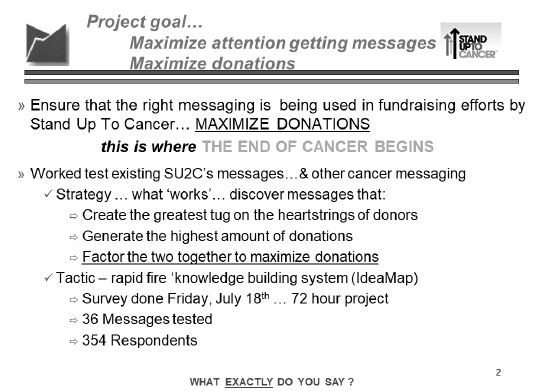
Figure 1: The introductory page to the project summary, showing the goals of the project, the timetable, and the tactics.
The process as described here followed the specifications of the Mind Genomics process [5-7]
The study proceeded very quickly. Author Onufrey worked with the SU2C team to create a set of 36 different messages. These messages are shown in Table 1. The rapid pace of the project (front to back in three days maximum) forced the creation of messages, followed by some polishing and then insertion into a matrix. Usually the groups comprise coherent questions and the series of such questions ‘tell a simple story.’ The virtually breakneck speed of message creation allowed for some polishing of the elements, improving the quality of the messages before the actual research. The messages required about four hours to develop, and two hours to polish. The field portion, with respondents, lasted a day and a half, and the report was finished the last night.
Table 1: The 36 elements for the study.
| Group 1 | |
| A1 | Because someone close to you has cancer |
| A2 | Invest for life-changing results |
| A3 | Every day, 1,500 people in America die from cancer |
| A4 | Support research into ALL forms of cancer |
| A5 | Every sixty seconds someone in America dies of cancer |
| A6 | Your help provides support and programs for caregivers of cancer patients |
| Group 2 | |
| B1 | Track and report progress… all who donate can see how their participation creates real change |
| B2 | One in three women will get cancer in her lifetime |
| B3 | Donating time, money and effort makes a difference |
| B4 | You can make a difference |
| B5 | Ensure the quality of life for those suffering from cancer |
| B6 | Collecting the top experts in cancer research to work collaboratively |
| Group 3 | |
| C1 | Volunteer! |
| C2 | Accelerate the development of life saving cancer prevention, detection and treatment |
| C3 | Just when science is on the verge of the breakthroughs that can end cancer, the will and the funding are disappearing from the national agenda |
| C4 | Put together the best and the brightest minds in cancer research — those on the edge of accomplishment |
| C5 | Every year, 2,300 children in America die of cancer |
| C6 | We are close to scientific breakthroughs in the prevention, detection, treatment and reversal of cancer |
| Group 4 | |
| D1 | A new movement to stop cancer once and for all |
| D2 | There are 10.8 million cancer survivors in America |
| D3 | Because everyone knows good health is important |
| D4 | We can now target the genes and pathways that turn normal cells into cancerous ones |
| D5 | Other organizations have made good progress in cancer research and programs… this program brings all the strengths together to reach the ultimate goal |
| D6 | To provide support for finding a cure |
| Group 5 | |
| E1 | Because… cancer is a major health issue that affects everyone |
| E2 | Support the organization by purchasing items it sells or needs |
| E3 | We conquered Polio and Smallpox… we CAN conquer Cancer |
| E4 | Government funding for cancer research is declining… this fills the void |
| E5 | We have the science, the technology, the tools… all we need is YOU |
| E6 | One in two men will get cancer in his lifetime |
| Group 6 | |
| F1 | Make sure that a strong interest in Fighting Cancer remains a priority |
| F2 | Because you want to honor a loved one |
| F3 | Push scientific breakthroughs to the finish |
| F4 | We now understand the biology that drives cancer… we are on the brink of scientific breakthroughs |
| F5 | Cancer is a war we can actually win |
| F6 | Act before cancer takes another life away |
The conventional research approach would have been either to test these elements one-at-a-time (so-called promise testing), or to test a limited number of combinations created by the researcher or by a marketing specialist with a ‘sensibility of what the listener needs to hear to drive donation.’ These methods are hallowed in the research community because they introduce the ‘voice of the consumer.’
The reality of most research is that no one knows which elements will perform very well. It is fairly easy to spot losing elements, especially after the promise testing study is completed. These ‘losing’ elements may be adequate in and of themselves, but they don’t do well because they may be trite, or ‘off strategy.’ After the performance of each element, or the entire concept, is published for everyone to see, the opinions will emerge as to why the elements failed, alongside new and better elements.
The messages were combined by an underlying experimental design, creating 48 unique vignettes (combinations of messages), 36 comprising four elements (two questions not contributing), and the remaining 12 comprising 3 elements (three questions not contributing). The Mind Genomics experiment was set up so that the respondent was shown a vignette and had to assign two ratings, one for Question 1 dealing with probability of donating, and the second for Question 2, dealing with the amount to be donated.
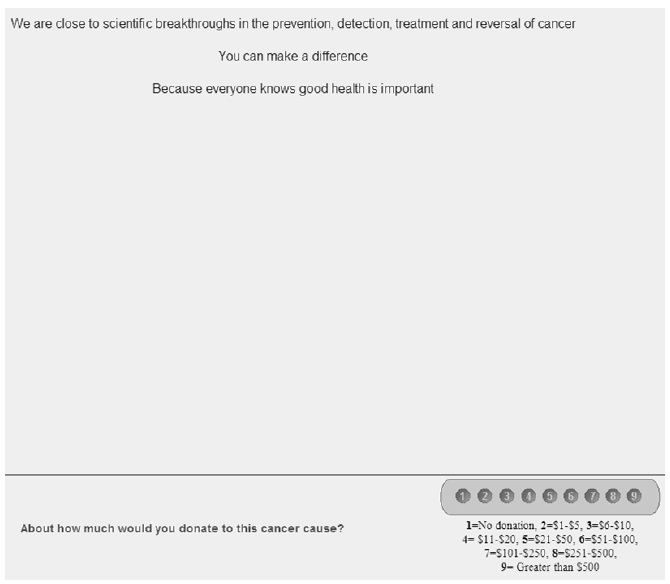
Figure 2: Example of a 3-element vignette, and rating question #2 (amount that would be donated, based upon reading the vignette).
To the untrained eye, and in fact even to someone who knows how the vignettes were developed, the combinations seem to be combined in a way that one might call constrainedly haphazard [8] All vignettes had a limited number of elements, and each element ended up appearing an equal number of times. The vignettes were created by a specially constructed experimental design, which was rotated to create hundreds of isomorphic permutations—combinations which were identical in a mathematical sense, but whose combinations were different.
These custom created experimental designs are the workhorses of Mind Genomics. They ensure that the respondent is exposed to each element the same number of times (five) in 48 vignettes, absent the same number of times (43), and that the 36 elements are statistically independent of other. The underlying experimental design ensured that each respondent evaluated a unique combination of 48 vignettes [9], and that each set of 48 vignettes suffices to estimate the contribution of each of the 36 elements both to propensity to donate (question #1) and amount expected to donate (question #2)
- Probability of Donating – The first scale shows an anchored 1-9 scale, with the rating 1 anchored at ‘would not donate’ and the rating 9 anchored at ‘definitely would donate’. This is a Likert scale. It’s meaning is simple intuitively, but the scale must be anchored at both ends.
- Amount donated – The second scale comprises nine numbers, each number corresponding to an amount of money. This second scale is easy to use.
To make the analysis easier, we converted the first scale (probability) of donating to nine values, ranging from a probability of 0% (original rating of 1, definitely not donate) to a probability of 100% (original rating of 9, definitely will donate). The nine points were considered to be equally spaced, so that a rating of 5, for example, was considered to be a probability of 50%, a rating of 6 a probability of 62.5% etc.
The first analysis looks at the distribution of ratings. Even before we look at the linkage between the different messages and donations (probability, amount, respectively), we can ask a simpler question, namely what is the relation between the probability of donating and the amount donated?
Table 2 shows a two-way cross tabulation. The numbers in the body of the table are the percent of times that the specific pair appears in the data (specific probability of donating, and amount donated).
Table 2: Distribution of probability of donating and amount donated. The numbers in the body of the table are percentages of all the responses.
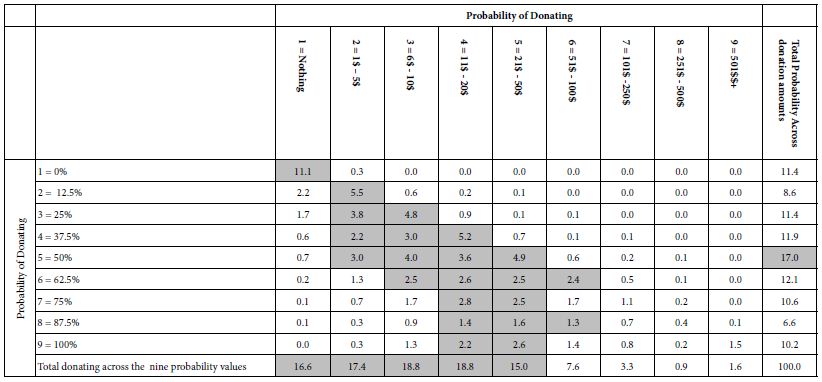
The far-right column in Table 2, labelled Total Probability, shows the distribution or probabilities of donating. Thus, 11.4% of the responses are ‘not donate,’ whether due to the respondents or to the messages. The source of the probability value is not clear. The most frequent response is ‘5’ (50% probability of donating), but that is only 17% of the responses. We can see that the percents not donating or donating (ratings 1-4) sum to 43% and the percents probably or definitely donating (ratings 6-9) total a bit over 40%,
The bottom row in Table 2, labelled Total Donating suggests, in contrast, that most donations are either 0 or less than 50$.
Is There a Discernible Relation between the Likelihood of Donating and Amount Donated?
Table 2 suggests that the relation between probability of donation and amount of donation exists, albeit in very rough and noisy form. Not surprisingly, there are more darkened cells towards the left side of the table, where the amount donated is lower, but there is not a correspondingly clearly shaded area when it comes to probability of donating.
We can create a less noisy data set by estimating the average donations and probability of donations for each of the 354 respondents. Figure 3 shows a plot of the averages, and suggests that with increasingly average likelihood of donating, there is a slight increase in the amount to be donated. The relation is noisy, however. It is clear, however, that when, on average the respondent is not interested in donating (low value of the abscissa), the respondent does not choose moderate to high amount of money to ‘not donate.’ This congruence of low donation probability and low/no donation amount, provides one indication of validity, in this case face validity. The pattern seems intuitively understandable.
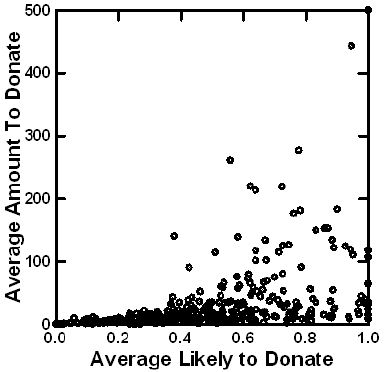
Figure 3: Relation between average rating of likely to donate and average amount to be donated. Each point is an average from 48 observations. There are 354 averages, one for each respondent.
Do Respondents Change Their Ratings as They Continue Rating Vignettes?
In the research community, and especially among applied research in a business setting, there is the ongoing dispute about the change in the criteria of judgment a respondent uses when judging a concept (vignette) or a product several times. Of course the concept or the product should be changed, but one can measure the effect of putting the concept or the product in the first position, the middle positions, or the last position. There is no end to the disputes about biases proposed by the purists who feel that every applied test of this type should be evaluated purely by itself, so-called pure monadic. There are others who feel that only with repeated experience does the respondent become able to validly rate the product. If the researcher relies only on the pure monadic, there is a great deal of extraneous variability, due to the proclivities and biases of the individual respondents.
The Mind Genomics approach attracts interest because the typical respondent evaluates as many as 24-48 vignettes, in short period of time, and without much consideration. The point of view espoused by a number of researcher is one of questioning the consistency of the data with repeated evaluations [10-14].
One of the analyses presented here looks at the change of the rating assigned by a respondent as the evaluations proceed from the first to the 48th. Independent of the specific elements in a vignette, can we demonstrate a systematic bias, viz. that the average rating of the probability of donating will increase with repeated rating, or the amount given will increase with repeat rating?
Figure 4 shows an order ‘effect, both in terms of probability (likelihood) of donating (left panel), and amount of money to be donated (right panel). The two plots were created simply by averaging the rated likelihood to donate by ‘test order,’ and amount to be donated, also by ‘test order.’ For both likelihood and probability to donate, and for amount to donate, we see the upward pattern, suggesting that as the evaluations move on, respondents feel more generous. Respondents may not realize that they are being more generous, and the degree of generosity is not marked, but there is a noticeable increase.
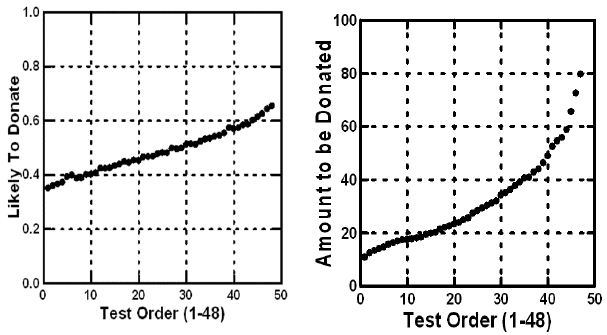
Figure 4: Average probability of donating (question #1) and average amount to be donated (question #2) versus the test order. Later vignettes are uprated on both ratings.
The foregoing analysis shown in Figure 3 suggests that on average, individuals become increasingly generous in terms of both likelihood and probability of donating, and amount to be donated. Does this pattern hold for the average individual? The slopes of the curves in Figure 3 provide us the answer. What does this slope look like on an individual basis? The answer appears in Figure 4. Each point corresponds to a respondent. The slopes were computed separately for the data of each respondent. Figure 5 shows the two slopes on a scatterplot. Slopes near zero mean no change. High positive slopes mean a strong positive increase in the rating with repeated evaluation. Negative slopes mean a decrease in the rating with repeated evaluation.
We conclude from Figure 4 that repeating the evaluation 48 times with new combinations ends up increasing the stated likelihood to donate, and the amount to be donated. The strength of the effect (slope) varies by respondent to respondent. There is only one respondent who strongly decreases the amount donated and the probability of donation, as the respondent progresses. Most respondents fall into the right half, and the top half, suggesting either a modest increase in probability of donating (to the right on the abscissa), or a modest increase in the amount to be donated (upwards on the ordinate). There is no clear pattern, however. As the person moves through the 48 vignettes, evaluating each, the person might increase the rated probability of donating, increase the rated amount to be donated, increase both, or increase neither.
Relating the Elements to the Ratings
Most research works with numbers to identify patterns. The preliminary, viz., surface analysis of the data, shown in Table 2 and Figures 3-5 tell us a lot about the respondent, in terms of likelihood to donate, response to repeated messages, etc. Yet, the deepest information is yet to be obtained, information which can only emerge when the stimuli are ‘cognitively rich.’
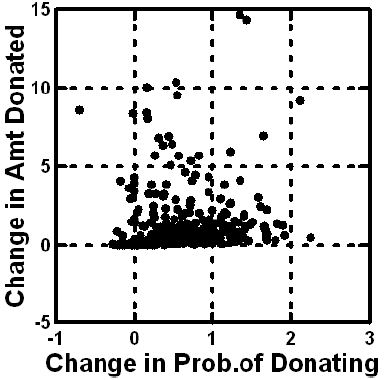
Figure 5: Distribution of changes in likelihood of donating (abscissa) and amount to be donated (ordinate), as shown by the slopes (versus test order). Numbers above 0 mean an increase in the likelihood or donating or the amount to be donated. Each point corresponds to one of the respondents.
Table 1 shows the 36 elements, with the underlying experimental design combining these elements into vignettes which communicate information about the efforts of SU2C. Table 2 shows us that respondents differentiate among these different vignettes. Beyond the effects of order, the underlying experimental design allows us to uncover the linkage between the specific element and the rating, either of probability to donate or amount to be donated.
The tool to be used is OLS (ordinary least-squares) regression analysis. OLS works regression with the underlying experimental design, deconstructing the rating assigned to the combination into the part-worth contributions of the elements. The experimental design was applied separately create the set of 48 vignettes for each respondent, allowing OLS regression to estimate, at either the level of the respondent or the level of the group, the part-worth contribution of each element.
We express the relation between the dependent variable and the independent variable by the simple equation: Dependent Variable = k0 +k1(A1) + k2(A2) … k36(F6)
The foregoing equation is easy to interpret. The equation for the dependent variables begins with an additive constant, k0, which is the estimated value of the dependent variable when there are no elements in the vignettes. This situation is purely hypothetical because the underlying experiment ensured that EACH vignette created would have a precise set of either three elements or four elements, respectively. The additive constant, k0, can thus be considered to be a baseline, the estimated value of the dependent variable without any other information.
- Probability of donating – the baseline likelihood to donate to SU2C in the absence of any elements.
- Estimated amount donate – the baseline amount that would be donated to SU2C, in the absence of any elements.
- Expected value – the ‘adjusted’ amount that would be donated, defined as the amount to be donated, multiplied by the probability of the donation, again in the absence of any elements.
The OLS regression requires preparation of the data so that all of the data are in the proper format. The 36 independent variables, on for each elements, are coded as ‘1’ when the element is present in the vignette, and coded ‘0’ when the element is absent from the vignette. For statistical validity, the OLS regression approach requires more observations (viz., vignettes) than there are independent variables. Each respondent was presented with 36 independent variables, viz. our 36 elements, taking on the value 0 (absent) or 1 (present), and contributed 48 such cases or observations to the data set. Even at the level of the individual respondent, therefore, the OLS regression will run, delivering the coefficients.
As a side note, the study used three dependent variables. Each value was ‘adjusted’ by the additional of a very small random number (<10-5), ensuring that there would be some slight variation in the dependent variable, and thus prevent a crash if the respondent assigned the same rating to each of the 48 vignette. This done not happen very often, but it is always better to add a bit of random variation to the dependent variable and prevent crashes.
We now move to the actual data itself, with the equations estimated using the data from the entire panel. Despite the apparent blooming buzzing confusion, a phrase that one might use to describe the person’s reaction to the vignettes, the results emerge quite clearly, or if not clearly, at least tell a story.
Table 3 shows two sets of three models—parameters for the equations. The first set is computed using all 36 elements, and estimating the additive constant, and the value of the individual coefficients. We can liken this first set of equations (columns A, B, and C) to a statue comprising two parts, a base, and then the statue part. The additive constant is the base, and the 36 elements are the parts of the statue. The height of the statue is estimated by adding together the magnitude of the additive constant and the coefficients of the particular, limited number of elements to be incorporated into a new vignette.
Table 3: The part-worth contribution of each of the elements to donations. The table shows the contributions when the model is estimated with an additive constant (baseline), and when the model is estimated without an additive constant (no baseline).
|
Additive Constant |
No Additive Constant | ||||||
| A | B | C | D | E |
F |
||
|
Probability Donate |
Amount Donated | Expected Value | Probability Donate | Amount Donated |
Expected Value |
||
| Additive constant (all elements absent) |
41 |
$23 | $17 | NA | NA |
NA |
|
| B2 | One in three women will get cancer in her lifetime |
3 |
$6 | $6 | 14 | $12 |
$10 |
| A3 | Every day, 1,500 people in America die from cancer |
5 |
$7 | $5 | 16 | $13 |
$10 |
| B4 | You can make a difference |
4 |
$6 | $5 | 15 | $12 |
$10 |
| B5 | Ensure the quality of life for those suffering from cancer |
4 |
$6 | $5 | 15 | $12 |
$9 |
| A6 | Your help provides support and programs for caregivers of cancer patients |
5 |
$5 | $4 | 17 | $11 |
$8 |
| B3 | Donating time, money and effort makes a difference |
3 |
$4 | $4 | 14 | $10 |
$8 |
| D5 | Other organizations have made good progress in cancer research and programs… this program brings all the strengths together to reach the ultimate goal |
2 |
$4 | $4 | 13 | $10 |
$8 |
| A1 | Because someone close to you has cancer |
3 |
$4 | $3 | 14 | $10 |
$7 |
| A5 | Every sixty seconds someone in America dies of cancer |
3 |
$4 | $3 | 14 | $10 |
$8 |
| B6 | Collecting the top experts in cancer research to work collaboratively |
3 |
$4 | $3 | 14 | $10 |
$8 |
| C1 | Volunteer! |
2 |
$3 | $3 | 13 | $9 |
$7 |
| C2 | Accelerate the development of life saving cancer prevention, detection and treatment |
3 |
$3 | $3 | 13 | $9 |
$7 |
| C3 | Just when science is on the verge of the breakthroughs that can end cancer, the will and the funding are disappearing from the national agenda |
3 |
$3 | $3 | 14 | $9 |
$7 |
| D3 | Because everyone knows good health is important |
2 |
$4 | $3 | 13 | $10 |
$8 |
| F2 | Because you want to honor a loved one |
3 |
$3 | $3 | 14 | $10 |
$7 |
| A2 | Invest for life-changing results |
4 |
$3 | $2 | 15 | $9 |
$7 |
| B1 | Track and report progress… all who donate can see how their participation creates real change |
1 |
$2 | $2 | 12 | $8 |
$6 |
| C4 | Put together the best and the brightest minds in cancer research — those on the edge of accomplishment |
2 |
$2 | $2 | 13 | $8 |
$6 |
| C5 | Every year, 2,300 children in America die of cancer |
2 |
$2 | $2 | 13 | $8 |
$6 |
| C6 | We are close to scientific breakthroughs in the prevention, detection, treatment and reversal of cancer |
1 |
$2 | $2 | 12 | $8 |
$6 |
| D1 | A new movement to stop cancer once and for all |
2 |
$2 | $2 | 12 | $8 |
$6 |
| D2 | There are 10.8 million cancer survivors in America |
2 |
$2 | $2 | 12 | $8 |
$7 |
| D4 | We can now target the genes and pathways that turn normal cells into cancerous ones |
1 |
$3 | $2 | 12 | $9 |
$7 |
| E1 | Because… cancer is a major health issue that affects everyone |
1 |
$3 | $2 | 12 | $8 |
$6 |
| E6 | One in two men will get cancer in his lifetime |
2 |
$2 | $2 | 12 | $8 |
$6 |
| F1 | Make sure that a strong interest in Fighting Cancer remains a priority |
1 |
$2 | $2 | 12 | $8 |
$6 |
| A4 | Support research into ALL forms of cancer |
2 |
$2 | $1 | 13 | $8 |
$6 |
| D6 | To provide support for finding a cure |
2 |
$1 | $1 | 13 | $8 |
$5 |
| E2 | Support the organization by purchasing items it sells or needs |
1 |
$0 | $1 | 11 | $6 |
$5 |
| E4 | Government funding for cancer research is declining… this fills the void |
1 |
$2 | $1 | 11 | $8 |
$6 |
| E5 | We have the science, the technology, the tools… all we need is YOU |
1 |
$2 | $1 | 11 | $7 |
$6 |
| F3 | Push scientific breakthroughs to the finish |
2 |
$2 | $1 | 14 | $8 |
$6 |
| F4 | We now understand the biology that drives cancer… we are on the brink of scientific breakthroughs |
-1 |
$1 | $1 | 10 | $7 |
$5 |
| F6 | Act before cancer takes another life away |
0 |
$1 | $1 | 11 | $7 |
$5 |
| E3 | We conquered Polio and Smallpox… we CAN conquer Cancer |
0 |
$1 | $0 | 10 | $7 |
$5 |
| F5 | Cancer is a war we can actually win |
-1 |
-$2 | -$1 | 10 | $5 |
$3 |
In contrast to the estimates of the coefficients in a model with an additive constant, we can choose to leave out the additive constant. Columns D, E, and F show the corresponding (and much larger) coefficients. Figure 6 shows, however, that there is little loss of relative information. The corresponding pairs of coefficients (viz., A & D, for probability of donating) are very highly related to each other, as are the other two corresponding pairs. Figure 6 shows the strong correlation.

Figure 6: Scatterplots for each of the three dependent variables, showing the strong correlation between the 36 coefficients estimated with an additive constant (abscissa), and the 36 coefficients estimated but without an additive constant (ordinate).
Equations with the additive constant are estimated for those cases when there is a sense of a baseline ‘feeling,’ in the absence of elements. The judgments made based on the coefficients will be the same, because they line up so strongly in the same way.
Table 4 makes it easy for managers to understand what is working. We need only sort the table to find those elements which generate high probabilities of donating, and/or high amounts of donated money, and/or high expected value.
Table 4 shows us that the additive constant for probability of donating is a base of 41%. The two elements which drive donation most strongly, here operationally defined as an addition 5%, are A3 and A6. In turn the additive constant for amount to be donated ins 23$ in the absence of elements. One can get an addition 6-7 dollars, however by the correct choice of elements. Finally, when we look at the expected value, combining probability and amount, we end up with an additive constant of 17$. Looking across Table 4, the manager of the campaign would be advised to choose combination of A3 and B2.
Table 4: Strong performing elements for the three dependent variables, and the recommended combination.

The Allure of Mind-Sets
A continuing theme in Mind Genomics is the discovery of underlying groups of respondents, distinguished not so much by WHO they are, but by how they think. Marketers call these psychographic segments. The segments are typically created on the basis of variables such as age, gender, geography. These geo-demographic variables are relative blunt measures, because people who resemble each other in their geo-demographics often think in radically different ways. One need only visit a neighborhood food store to see the array of different flavors of the same food, sold to people of similar geo-demographic profiles.
A better way is to discover how people think about a topic. There are various approaches for identifying groups of people, who are demonstrated to think differently on a set of related topics such as lifestyle. The problem with these methods of dividing the population is that the methods come from the top down, showing differences in the way people think about large topics. How does one translate membership in a big lifestyle segment to the exact words one needs to use for a targeted campaign, with limited focus, and even more limited budget?
Mind Genomics works from the bottom-up, creating mind-sets or groups of people, based exclusively on the patterns of their reactions to the important stimuli, namely the messages. The key benefit provided by Mind Genomics is the ability to create an equation or model for each respondent, based upon the responses to the 48 vignettes. One can then cluster the 354 respondents based upon the pattern of the coefficients. The actual clustering method is left to the researcher.
Mind Genomics follows a simple process to discover mind-sets.
- Run three parallel analyses, one for each dependent variable; probability of donating, amount donated, expected value. The clustering analysis was thus done three times, once for each dependent variable.
- Choose the dependent variable (e.g., Probability of Donating). For the chosen dependent variable create the 354 individual level models, using OLS regression. For this specific study on messaging, the models were estimated without an additive constant. As Figure 6 shows, the same pattern of coefficients appears whether the researcher incorporates or does not incorporate the additive constant.
- Cluster the 354 respondents based upon the respondents’ patterns of coefficients, created using k-means clustering (Likas et. al., 2003). Individuals with similar patterns of 36 coefficients were put into the same cluster. The cluster will become the ‘mind-set’.
- Extract three clusters of mind-sets and assign each of the 354 respondent to the appropriate mind-set.
- Note that when we do the foregoing exercise three times, once for each dependent variable, the composition of the three mind-sets will change. That is, the composition of the three mind-sets or clusters, differs by the dependent variable.
- The foregoing steps have now created three new groupings for every dependent variable. These groups are the mind-sets. For every dependent variable, every one of the 354 respondents is assigned to exactly one of the three mind-sets.
Now, consider one dependent variable, e.g., probability of donating. Each respondent fits into only one of the three mind-sets. We analyze the data on a mind-set basis.
- Compute the average rating (or expected value) for each mind-set across all the respondents in the mind-set and all the 48 vignettes for each respondent. This average gives a sense of how the mine-set feels about the topic.
- Once again, run the equation for the dependent variable selected (viz., Probability of Donating, dependent variable 1). This time, estimate the equation using the additive model. Run the OLS regression analysis three times, once incorporating all the data from the respondents assigned to the mind-set for that dependent variable.
- Lay out the result and select only the strong-performing elements for each mind-set. The definition of ‘strong performing’ is a coefficient above a certain cutoff. The cutoff is operationally specified by the researcher.
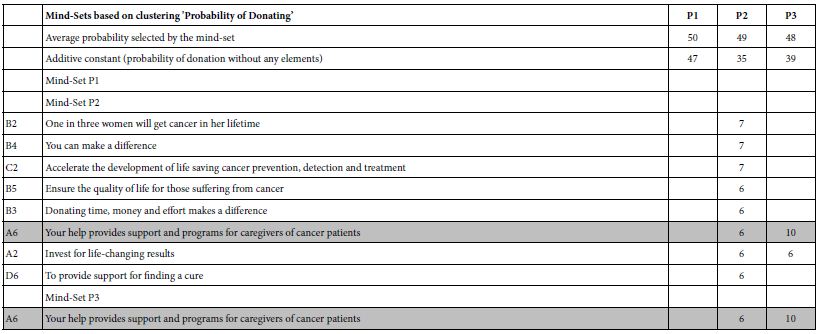
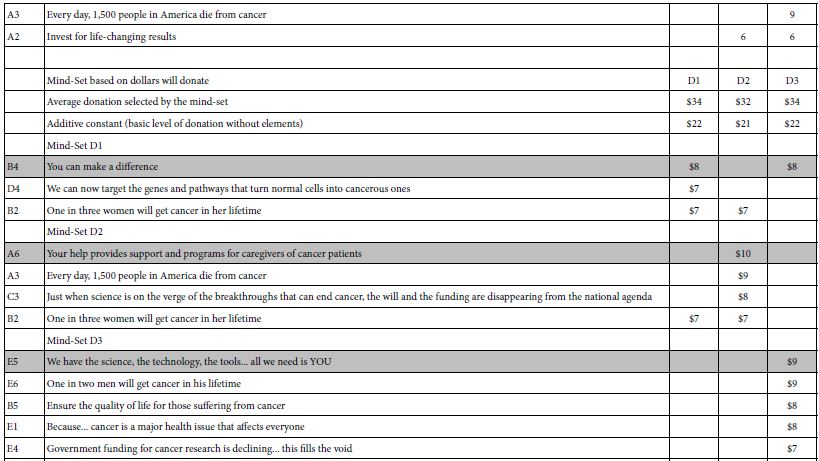
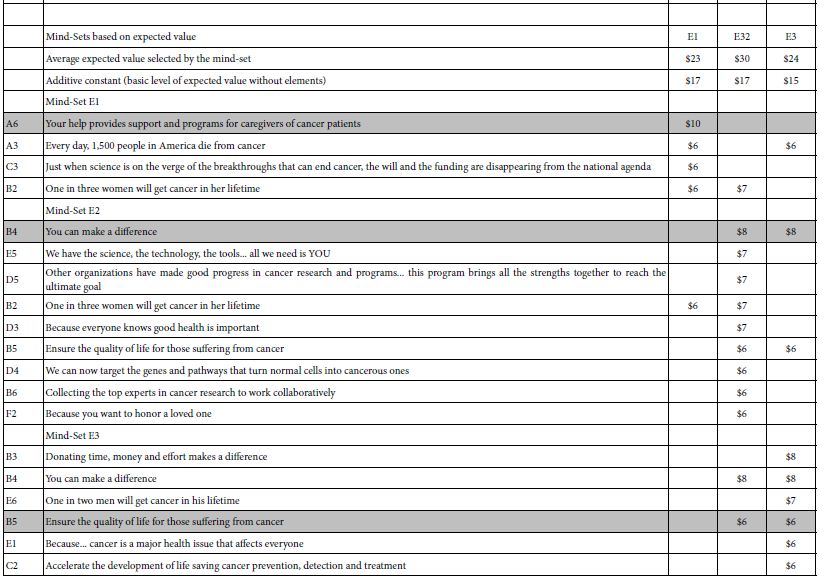
- If an element fails to perform strongly for all three mind-sets, then eliminate the element. This action will eliminate most of the elements, allowing only the most promising elements. These are elements which do well for at least one mind-set. Tables 5shows the strong performing elements for each of the three mind-sets for a dependent variable.
- For purposes of selecting the correct messages for the proposed SU2C, Table 5 presents the relevant information from which to craft messages.
- For systematized understanding and data-basing in a ‘wiki of the mind,’ the original motivation for this reanalysis of the data 13 years later, Table 5 present the necessary information to better understand the mind of the donor, and to create a Mind Genomics of donation.
Table 5: Summary results for three mind-sets emerging for each dependent variable, and the strong performing elements for each mind-set. The recommended messages to use are shown in shaded cells.
Discussion and Conclusions
At the time of writing Selling Blue Elephants (2006 for the 2007 publication deadline), the realization emerged that one could do studies for companies and other groups, studies which would answer the question, but studies which would have great residual value. It was in this spirit that many studies were run, studies which created these so-called rules. The question then was asked: Can these studies be reopened a significant time later, when the issue had been long answered, and in turn, can these studies ‘teach.’ If so, the opportunity was emerging to create studies whose value would be immediate AND long term. It is to that issue that we addressed this paper, with a case history about what was done, and what was learned 13 years later of a general nature.
By their very nature, Mind Genomics study provides valuable information years, even decades after they have been executed. The reason for the retained value is two-fold. First, the raw material, the elements, is cognitively rich. A database of the type shown in Tables 4 and 5 but comprising all 36 elements rather than just ‘strong performers’, becomes a valuable. The database can be searched, and new facts and insights can be discovered. One can imagine a world where there are millions or even hundreds of millions of these databases created each year, and available for search to broaden our understanding. The result is a Wikipedia of the Mind, produced at the level of local issues, at the level of granularity.
There is a second use, as well. That is as a database from which one can extract meta-patterns, such as average ratings of subgroups, or change in response patterns over time. This second use pales, of course, when compared to the first application above, the Wikipedia of the Mind at the level of granular, everyday experience. Yet, when we emerge from the euphoria of what could be, we realize that it is this less-exciting second use which corresponds to today’s archival sciences. Information, but without the systematized, cognitive richness so readily available from Mind Genomics.
The final question is very simple. Was the study effective? Here is a direct quote from 2010. Although one might not attribute the massive success of SU2C, the fact that those running the simulcast in 2008 knew ‘what to say’ should be taken into account as a factor in the success of SU2C, in its effort to change the perception of cancer, and to highlight the efforts being made to treat it, control it, and cure it.
Stand Up to Cancer
LOS ANGELES—A look at some of the statistics culled from the Stand Up to Cancer (SU2C) Sept. 10 broadcast may seem to indicate that the fundraising and cancer awareness effort fell somewhat short of its original milestones two years before: The 2010 show announced that $80 million had been pledged, whereas in 2008 the number was approximately $100 million. ….
The first show was seen on only ABC, CBS, and NBC, which for this year’s show were joined by many more collaborative network and cable partners including Fox, Bio, Current TV, Discovery Health, E!, G4, HBO, HBO Latino, MLB Network, mun2, Showtime, Smithsonian Channel, the Style Network, TV One, and VH1…..(Source… [11]).
References
- Moskowitz HR, Gofman A (2007) Selling Blue Elephants: How to Make Great Products That People Want Before They Even Know They Want Them. Pearson Education.
- Christen SP, Levine AJ (2019) Facilitating cross-disciplinary interactions to stimulate innovation: Stand Up To Cancer’s matchmaking convergence ideas lab. In Strategies for Team Science Success. Springer.
- Charlesworth D (2016) Stand Up to Cancer 2012 and 2014: The medical telethon as UK public service broadcasting in a neo-liberal age. Critical Studies in Television 11: 217-229.
- Gabay G, Moskowitz H, Gere A (2019) Understanding the donating mind and optimizing messaging – public hospitals. In: 12th Annual Conference of the EuroMed Academy of Business.
- Gere A, Radvanyi D, Moskowitz H (2017) The Mind Genomics metaphor – from measuring the every-day to sequencing the mind. International Journal of Genomic Mining.
- Mehta-Shah N, Mehta S, Zemel R (2021) Mind Genomics (BimiLeap) to create new ideas. In Consumer-based New Product Development for the Food Industry. Royal Society of Chemistry 119-131.
- Moskowitz HR, Gofman A, Beckley J, Ashman H (2006) Founding a new science: Mind Genomics. Journal of Sensory Studies 21: 266-307.
- Ryan TP, Morgan JP (2007) Modern experimental design. Journal of Statistical Theory and Practice 1: 501-506.
- Gofman A, Moskowitz H (2010) Isomorphic permuted experimental designs and their application in conjoint analysis. Journal of sensory studies 25: 127-145.
- Schwarz N, Hippler HJ, Noelle-Neumann E (1992) A cognitive model of response-order effects in survey measurement.” In Context Effects in Social and Psychological Research. Springer 187-201.
- Rosenthal ET (2010) Stand Up to Cancer 2010: Qualitative Success Transcends Quantitative Numbers Oncology Times 32: 20-23.
- Fortunato J (2013) Sponsorship activation and social responsibility: How MasterCard and major league baseball partner to stand up to cancer. Journal of Brand Strategy 2: 300-311.
- Likas A, Vlassis N, Verbeek J (2003) The global k-means clustering algorithm. Pattern Recognition, Elsevier 36: 451-461.
- Milutinovic V, Salom J (2016) Mind Genomics: A Guide to Data-Driven Marketing Strategy. Springer.