Abstract
Guaifenesin is used as an expectorant. One of its available over-the-counter tablets is immediate- and extended-release bilayer in design. The purposes of this project were [1] to compare the in vitro release profiles between one-stage dissolution (using water as medium) and two-stage dissolution (using 0.1 N HCl and phosphate buffer pH 6.8), and [2] to explore the polymeric release mechanism from the tablet. We also proposed a less acidic liquid chromatographic mobile phase, 50% methanol (which stability indication method was validated), to compare with the mobile phase described in the Guaifenesin Tablets monograph (methanol/water/glacial acetic acid, 40:60:1.5 v/v/v). With the dissolution duration, temperature, paddle stir rate, and sampling schedule being kept the same, the release profiles using Monograph mobile phase to quantify the samples collected from both dissolution methods were found similar (n = 4). When the same set of two-stage dissolution samples were subject to two different mobile phases, the profiles in the acid stage were similarly. But 50% methanol quantified the Buffer Stage samples less than Monograph mobile phase since hour 3, when 250 mL of 0.2 N tribasic sodium phosphate was added and the medium adjusted with 2 N NaOH to pH 6.8. The differences were 12.7% ± 1.4% at hour 4, and 20.9% ± 1.6% at hour 12 (n = 4, p < 0.001). As to the polymeric control, the computed exponent (n value) in the Peppas power law approximation was in the range of 0.7, which suggested release mechanism is anomalous transport. The cross-section of the retrieved tablets at end of the dissolution studies supported the inference.
Keywords
Extended-Release Bilayer Tablets, Liquid Chromatography, One-Stage Vs. Two-Stage In Vitro Dissolution, Peppas Power Law Approximation, Polymeric Control.
Introduction
Guaifenesin, an expectorant, is available over-the-counter in two strengths, 600 mg and 1200 mg [1, 2]. One brand is ER bilayer tablets containing white Immediate Release (IR) and blue ER layers (Figure 1). The Guaifenesin Tablets monograph in USP-NF 2018 (3) describes its dissolution procedure as medium: water; 900 mL; apparatus 2: 50 rpm; time: 45 min and procedure: determine the amount dissolved using UV absorbance at 274 nm, the tolerance was not less than 75% (Q) of the labeled amount dissolved in 45 min [3]. Judging from the dissolution time of 45 min, it is for IR. There are no guidelines specifically written for Guaifenesin ER Tablets in the monograph.
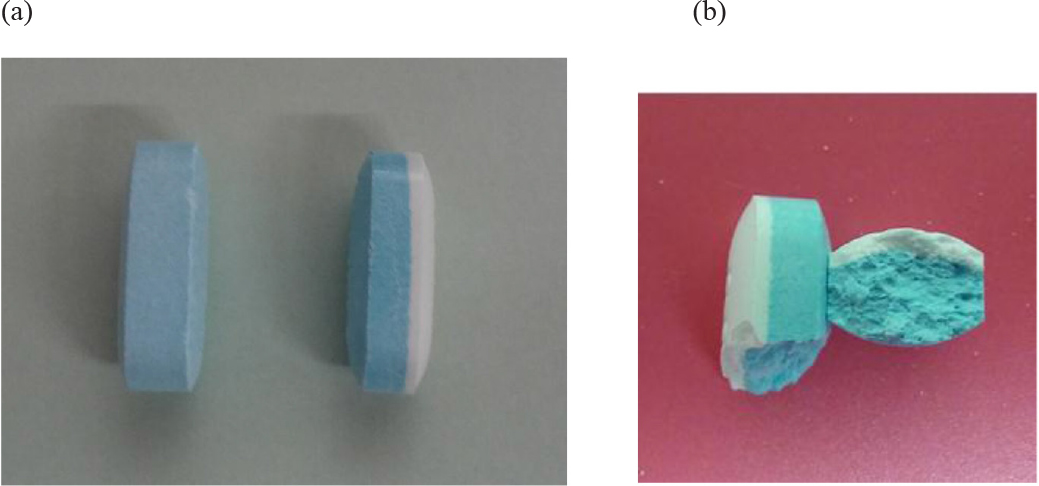
Figure 1. Guaifenesin 1200-mg bilayer ER tablets. (a) Dissecting an intact tablet illustrated no coating was applied to the core tablet, (b) a tablet retrieved from a dissolution vessel at the end of the 12-h study.
Nicholas Peppas introduced a power law approximation to describe drug release from a dosage form. Both the exponent n and the prefactor k of the equation depend on the dosage form geometry, the relative importance of relaxation and diffusion in the pure polymer swelling controlled drug delivery system [4, 5]. Therefore, the first objective of this project was to search within the General Chapters of USP-NF [3] for an in vitro dissolution method, which might be used to study Guaifenesin ER Tablets. Second, a less acidic Liquid Chromatographic (LC) mobile phase (50% methanol, apparent pH 7.0). Both the Monograph mobile phase (methanol/water/glacial acetic acid, 40:60:1.5, apparent pH 3.08) and the proposed mobile phase (50% methanol) were used to establish standard curves of guaifenesin dissolved in the media used for dissolution study, and quantify the dissolution samples to determine the cumulative drug release from the tablet. Third, it aimed at the comparison of the in vitro release profiles between a one-stage dissolution method × 12 h (using water as medium) and two-stage method (composed of Acid Stage × 3 h, and then Buffer Stage × 9 h). Furthermore, the in vitro release data were plotted according to power law approximation to differentiate the drug release mechanism among Fickian diffusion, anomalous transport and polymer chain relaxation (polymer swelling).
Materilas and Methods
Materials
Over-the-counter 1200 mg Guaifenesin ER Bi-layer Tablets containing a white IR layer, and a blue ER layer for 12 h release (Lot BY646, distributed by Reckitt Benckiser, NJ) were purchased from a local pharmacy. Guaifenesin (Spectrum Chemical, Lot 2EC0288), methanol, glacial acetic acid, 10 mL syringes, 0.22 micron 25 mm Nylon syringe filters were obtained from VWR International (Bridgeport, NJ).
Methods
Examination of Tablet Formulation Development
Four tablets randomly taken from the original container were weighed. The tablets were cut vertically to inspect any coat being applied to the tablet core. The inactive ingredients and their pharmaceutical functions were conducted through literature search [3, 6].
Standard Preparations
Guaifenesin powder was dissolved in three different matrices to address the aims of this study. They were deionized water, 0.1 N HCl and phosphate buffer pH 6.8. In deionized water it was made into 2 mg/mL as the stock solution. It was further diluted with a diluent (made of one part of water and four parts of 45% methanol) into different concentrations of standard preparations, 0.0002, 0.002, 0.08, 0.2, 0.4, 1, 1.2, 2 and 10 mg/mL. For constructing the standard curves with 0.1 N HCl and phosphate buffer 6.8, the standard stock solution was prepared into 10 mg/mL. It was further diluted with a diluent: water – 45% methanol (1:4, v/v) to ensure the work ranges were covered.
UV Spectroscopy
The Scan mode of a Cary 50 UV-Vis Spectrophotometer from Agilent Technologies determined the optimal wavelength of guaifenesin, and Sample Read mode recorded the absorbance of standard solutions.
Liquid Chromatographic Conditions
Agilent Series 1100 (Hewlett Packard) contained Vacuum Degasser, Binary Pump, Auto Sampler, Column Thermostated Compartment, and Variable Wavelength Detector. Two different mobile phases quantifying the standard solutions and in vitro dissolution samples were the mobile phases which may be found in Guaifenesin Tablet Monograph (methanol/water/glacial acetic acid, 40:60:1.5, v/v/v [3], apparent pH was 3.08), and our proposed mobile phase (50% methanol, apparent pH was 7.0). The flow rate was set at 1.0 mL/min and run time 7 min/cycle. The selected column was Luna C18 (USP L1, 4.6 × 150 mm, 5 µm) and the injection volume was 20 microliters.
Potency tests determine the drug content in a sample using HPLC, titration or microbial assay. Stability test, shelf-life and beyond-use date are interchangeable.
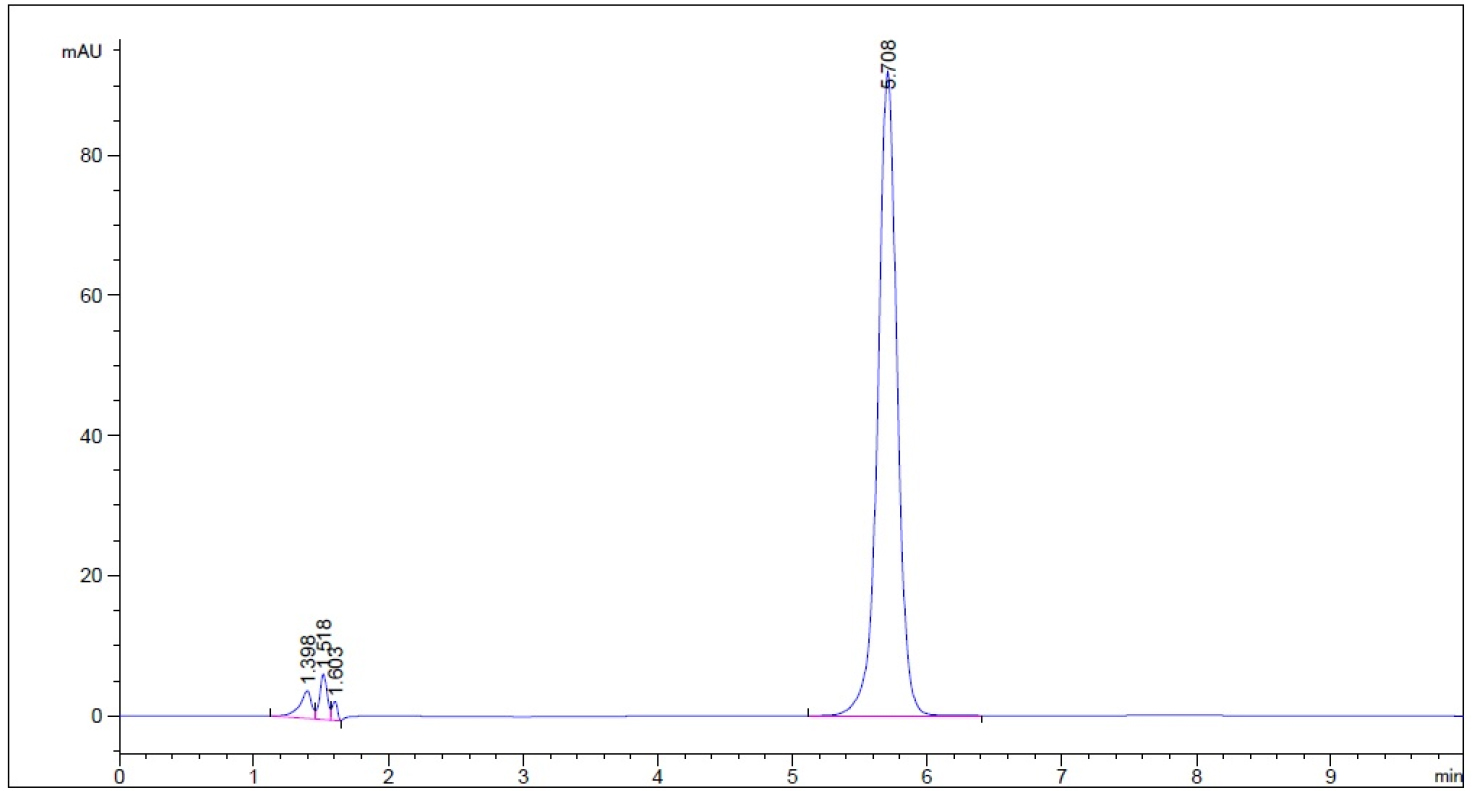
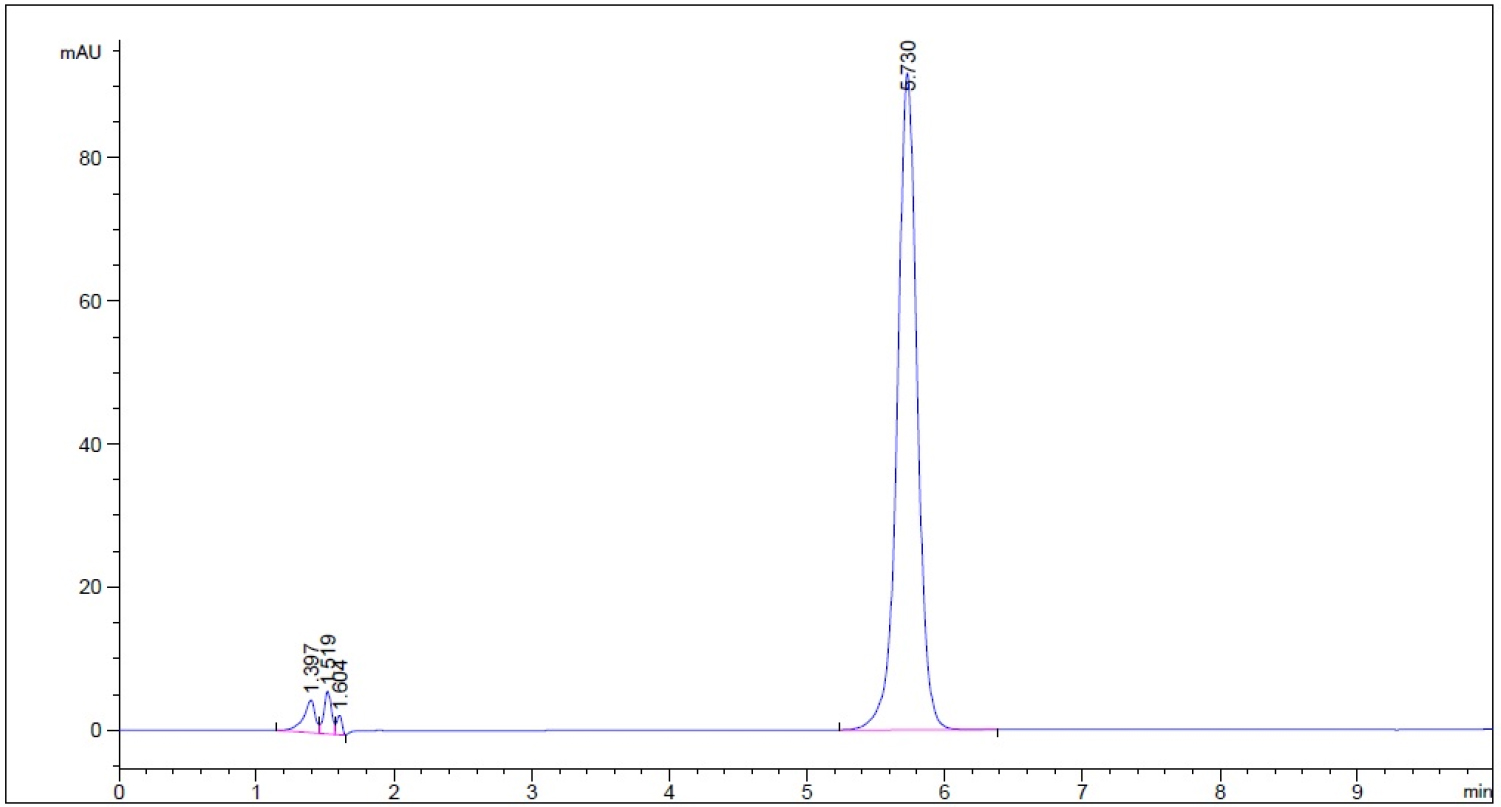
Methods of determining potency may or may not be stability indicating, but a stability-indication method can determine both potency and stability [7]. Because we proposed using 50% methanol as the mobile phase, which was considered as a new LC method, the stability-indication method must be validated. A know amount of guaifenesin was dissolved in water (one-stage dissolution medium) and in two-stage dissolution media (0.1 N HCl, and phosphate buffer at pH 6.8 respectively). The samples were subject to the following conditions: (a) 50 oC Heat for 1 h, then cooled to room temperature quickly, (b) 0.1 N HCl (acid) for 1 h prior to neutralized by 0.1 N NaOH, (c) 0.1 N NaOH (base) for 1 h and neutralized with 0.1 N HCl, and (d) 3% hydrogen peroxide solution for 5 min (8). The samples were then quantified using our proposed mobile phase (50% methanol) to ensure the degradant peaks generated by the experimental conditions were separated from analyte (guaifenesin) peak by the resolution (Rs) ≥ 2 [8].
In Vitro Dissolution Methods
Within the USP-NF 2018 two different dissolution methods are stated. One method is in the section of Extended-release Dosage Forms of General Chapters: <711> Dissolution. It describes as “Procedures and medium are as directed for Immediate-Release Dosage Forms in the monographs. But the test-time points generally are three and are expressed in hours.” The dissolution procedures and medium were searched within Guaifenesin Tablets monographs as directed in General Chapters: <711>. The description was medium: 900 mL water; Apparatus 2: 50 rpm; and time: 45 min. This method will refer as one-stage method in the remaining text. The second method is a two-stage acid-buffer method. It is present in General Chapters: <711> Dissolution, but in the section of Delayed-release Dosage Forms, Method A and Method B. This project followed Method a procedure to avoid contamination, loss of tablets, or breakage of a dissolution vessel. The dissolutions and assays are briefly described in the below.
One-stage Dissolution
The one-stage 12-h dissolution study followed the guidelines in Guaifenesin Tablets monograph (medium: 900 mL water; apparatus 2: 50 rpm), except the time was extended to 12 h to study the drug release mechanism. The sampling schedule was at 0.25, 0.75, 1, 3, 4, 6, 8, 10 and 12 h. One part of each dissolution sample was diluted with four parts of 45% methanol prior to subject to LC assay using mobile phases, 50% methanol as well as methanol/water/glacial acetic acid, 40:60:1.5, respectively. The LC AUC of each time point was converted into the cumulated amount of drug release using the established standard curve which medium in the one-stage dissolution was water (n = 3).
Two-stage Dissolution
For the two-stage 12-h dissolution study, an ER bilayer tablet (Figure 1a) was placed in a vessel of USP Dissolution Apparatus 2 containing 750 mL of 0.1 N HCl at 37.0 ± 0.5 oC and stirred at 50 rpm for 3 h. Then 250 mL of 0.2 M tribasic sodium phosphate was added, pH was adjusted to 6.8 with 2 N NaOH. The study continued for another 9 h at 50 rpm while the vessel medium maintained at 37.0 ± 0.5°C. Sampling schedule was selected the same for both one-stage and two-stage dissolution groups, 0.25, 0.75, 1, 3 h (Acid Stage), and 4, 6, 8, 10, and 12 h (Buffer Stage). One part of a dissolution sample was diluted with four parts of 45% methanol (diluent) prior to LC assay. Both mobile phases stated in Section 2.2.4 were applied in the LC system, respectively. The LC AUC of each time-point dissolution sample was converted into the cumulated amount and cumulative percent of drug release using the established standard curves which media were 0.1 N HCl and phosphate buffer pH 6.8.
Data Management for Peppas Power Approximation
After the amount of drug release at a sampling time was known (Mt), it was divided by the infinite amount of release (M∞), which equaled the tablet label strength (1200 mg). This ratio was then plotted against time (in h) to form a power equation (Equation 1) using the power trend line option in the scatter chart of an Excel worksheet. The power exponent (n) and prefactor (k) in the Peppas equation [6] were thus known from the trend line. The obtained values of release exponent from power trend line was further matched the n value in Table 1 [4, 5] to determine the drug release mechanism.
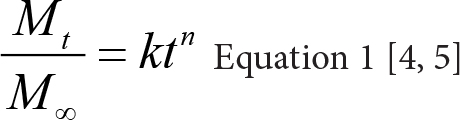
Table 1. The release exponent n of the Peppas power equation and drug release mechanism from polymer-controlled delivery systems in cylinder geometry (4, 5)
|
Exponent (n) |
Drug Release Mechanism |
|
0.45 |
Fickian diffusion |
|
0.45 < n < 0.89 |
Anomalous transport |
|
0.89 |
Polymer swelling |
Results
Examination of Tablet Rational Development Approach
The ER bilayer tablets taken from its original container were weighed as 1.454 ± 0.011 g (n = 4, relative standard deviation of the tablet weight was 0.76%). Judging from the dissection the tablet cores were not coated (Figure 1a). The inactive ingredients are FD&C blue #1 aluminum lake (coloring agent), hypromellose (controlled-release agent), magnesium stearate (lubricant), microcrystalline cellulose (tablet diluent and disintegrant), and sodium starch glycolate (tablet disintegrant).
Ultraviolet Spectrophotometric and HPLC Linearity
Guaifenesin dissolved in water to prepared into two different concentrations, 0.008 and 0.2 m/mL, then they were scanned from 190 to 790 nm using Cary 50 spectrophotometer (Agilent). In addition to 274 and 276 nm described in the Guaifenesin and Guaifenesin Tablets monographs [3], 270 nm can also be used as the wavelength to quantify guaifenesin. Thererfore, 270 nm was used in the remaining project including assaying dissolution samples. The standard linearity built using water as solvent and quantified using UV spectrophotometer was 0.001 mg/mL to 0.2 mg/mL (100 fold), while that quantified using LC was 0.001 mg/mL to 1.2 mg/mL (1200 fold). The R2 (coefficiency of determination) when LC AUC (y-axis) in correlation with UV absorbance (x-axis) ranged from 0.001 to 0.2 mg/mL was 0.9999.
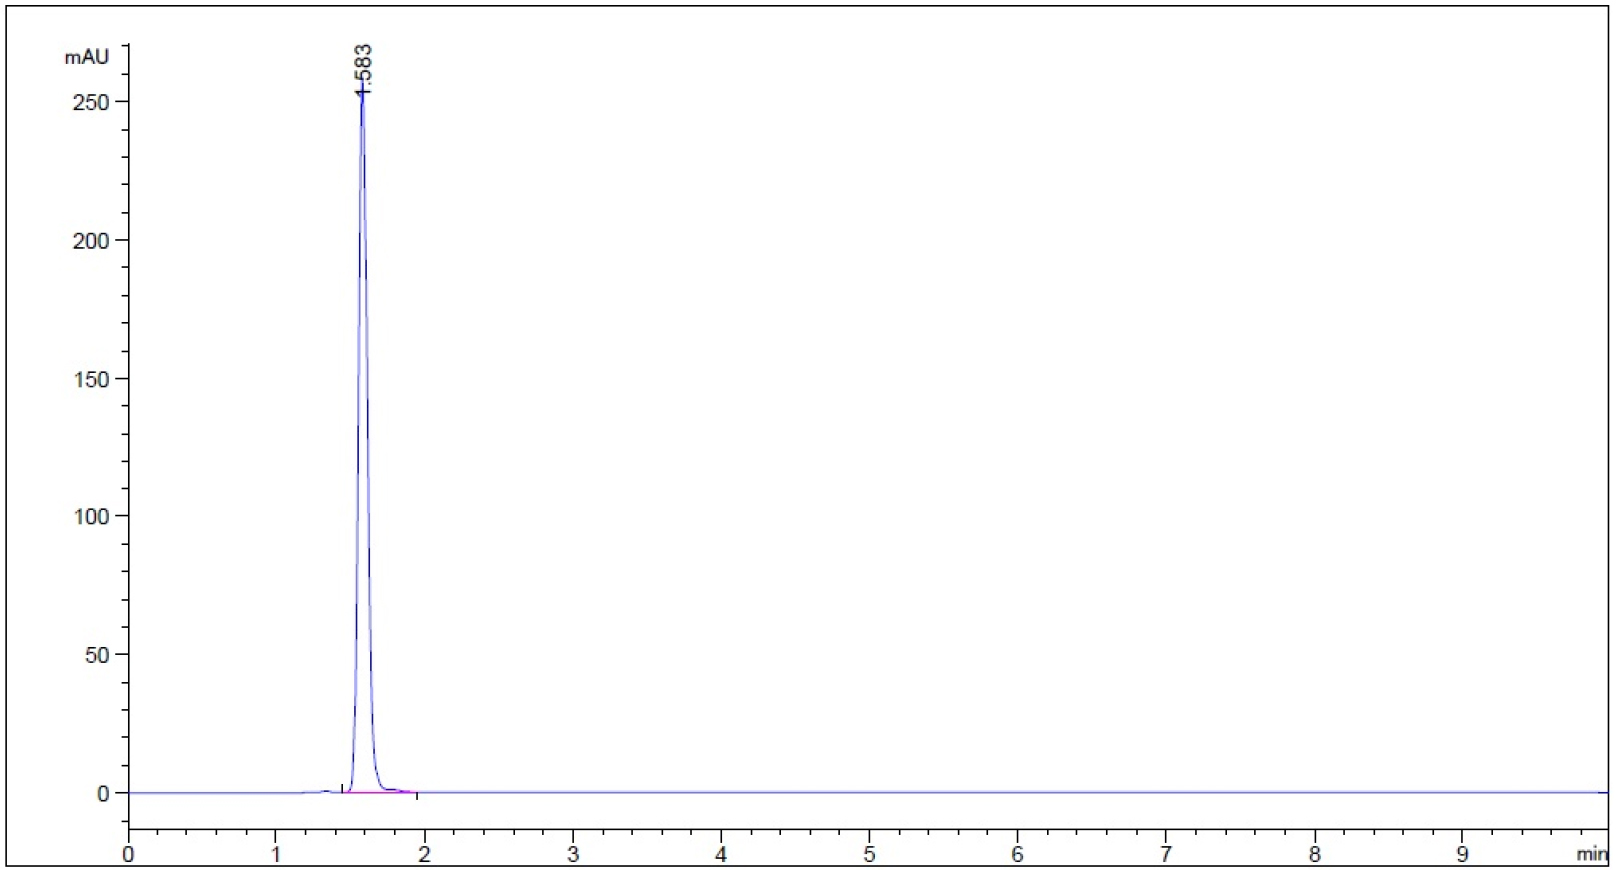
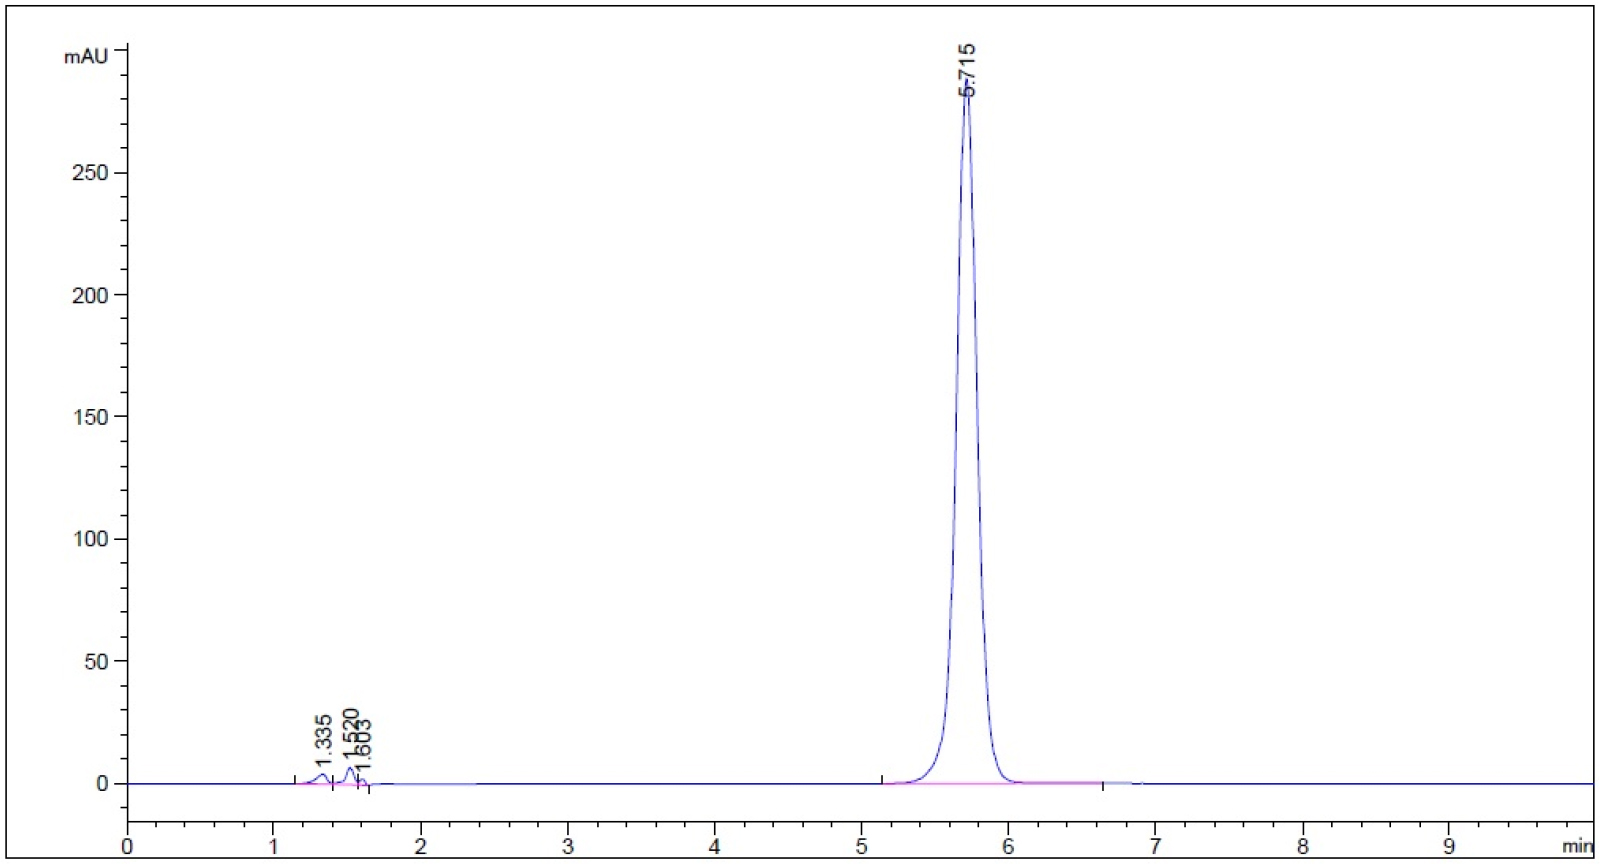
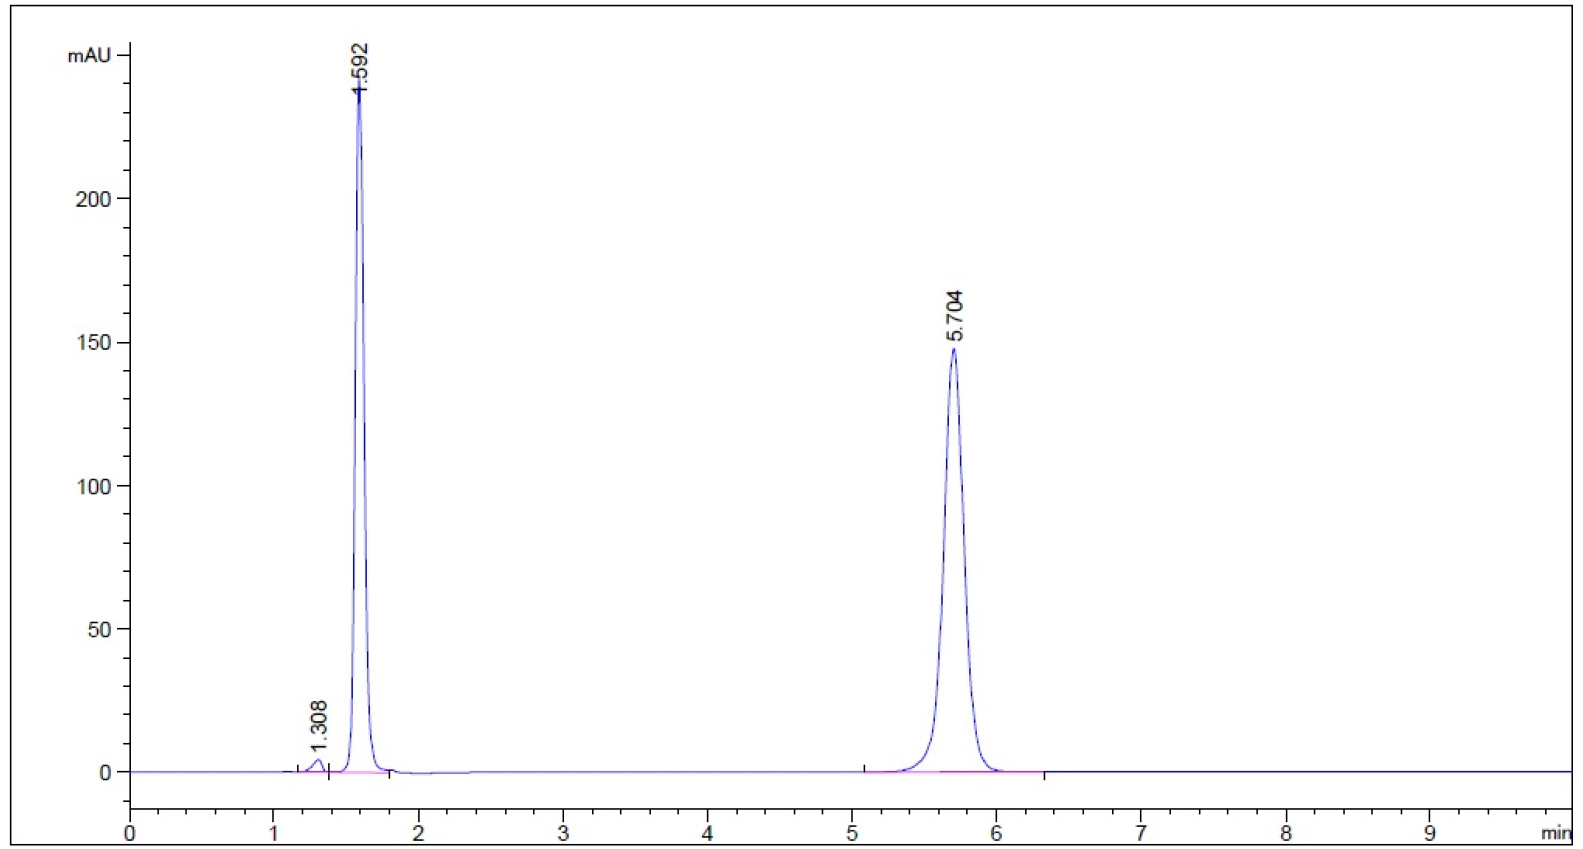
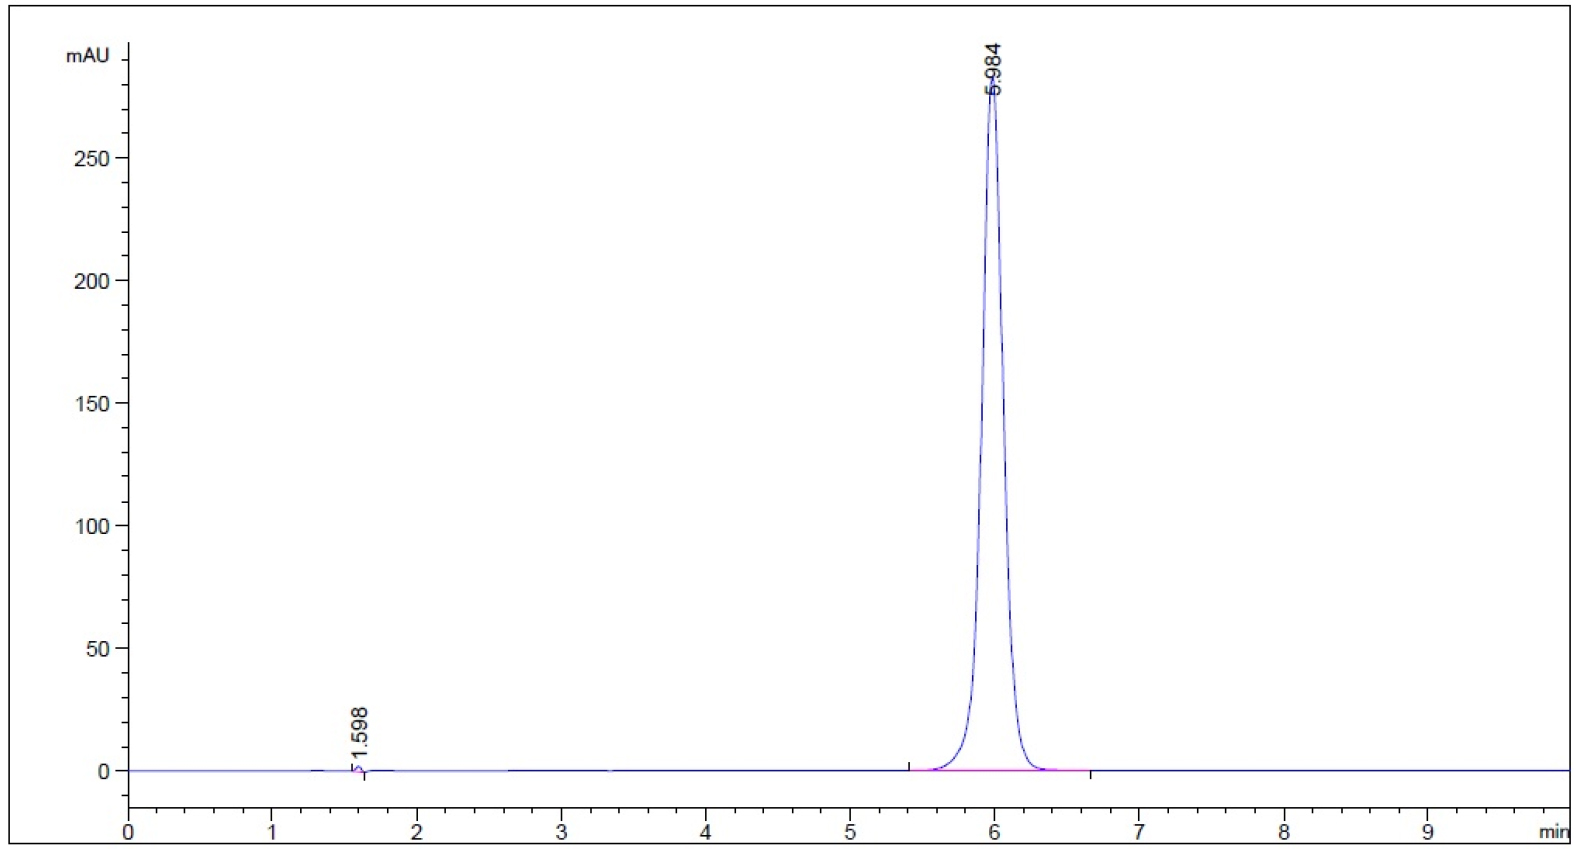
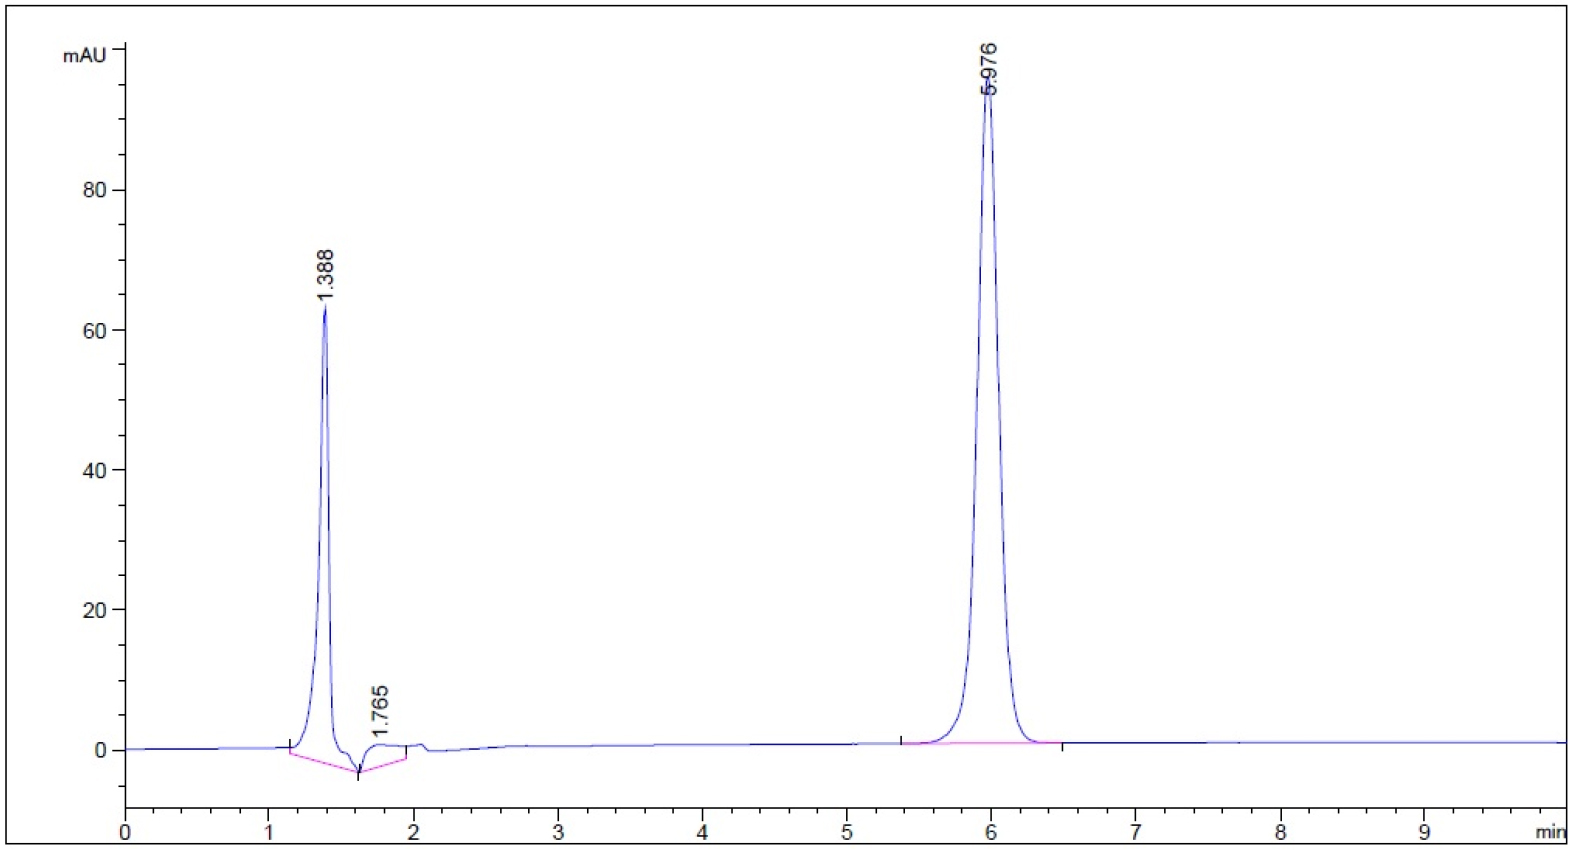
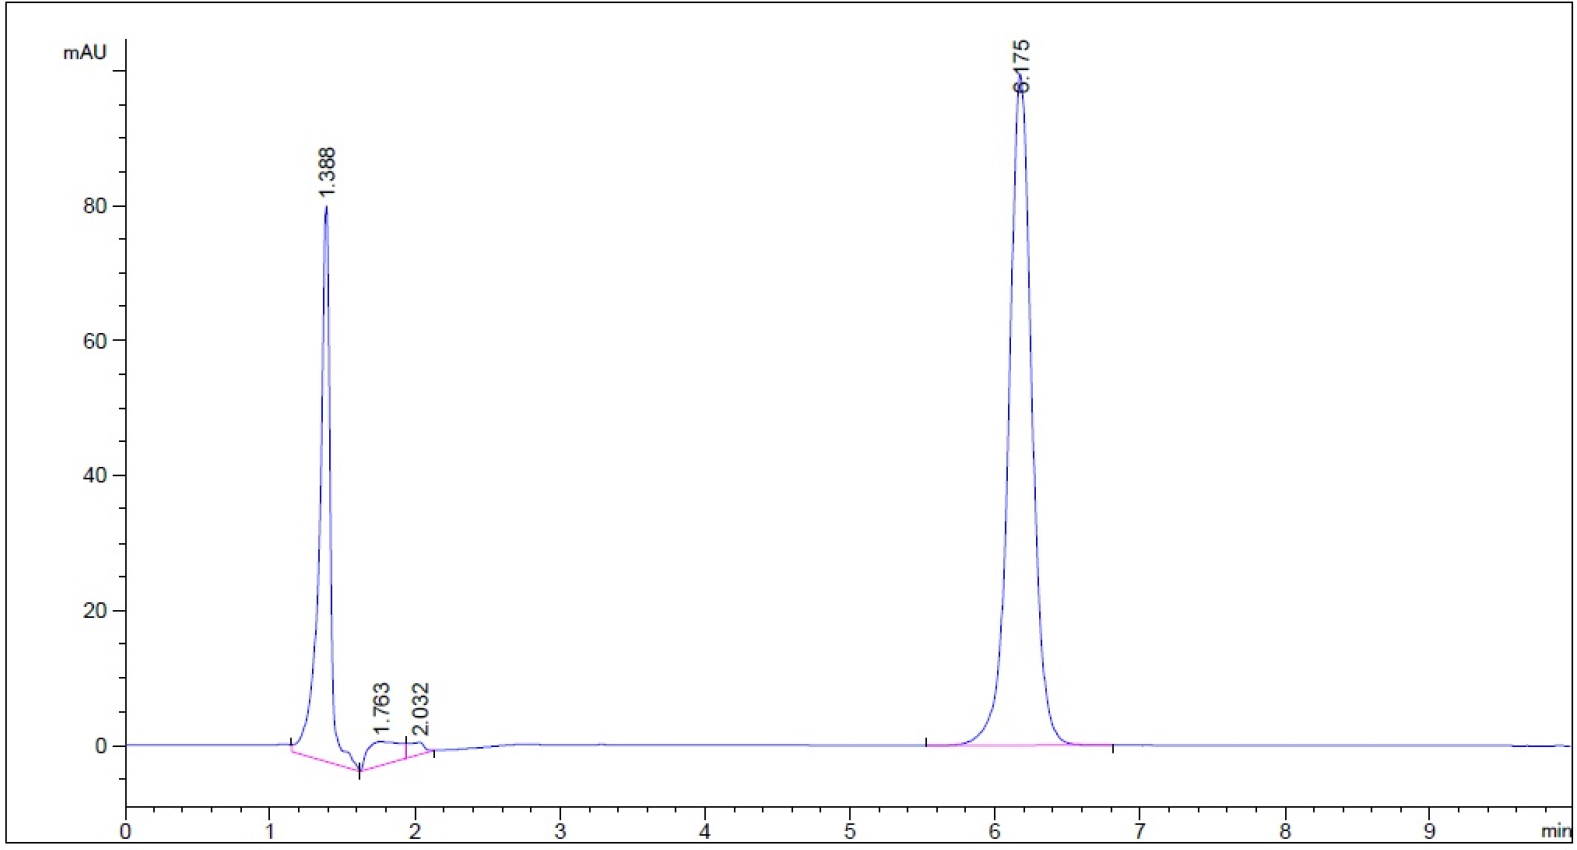
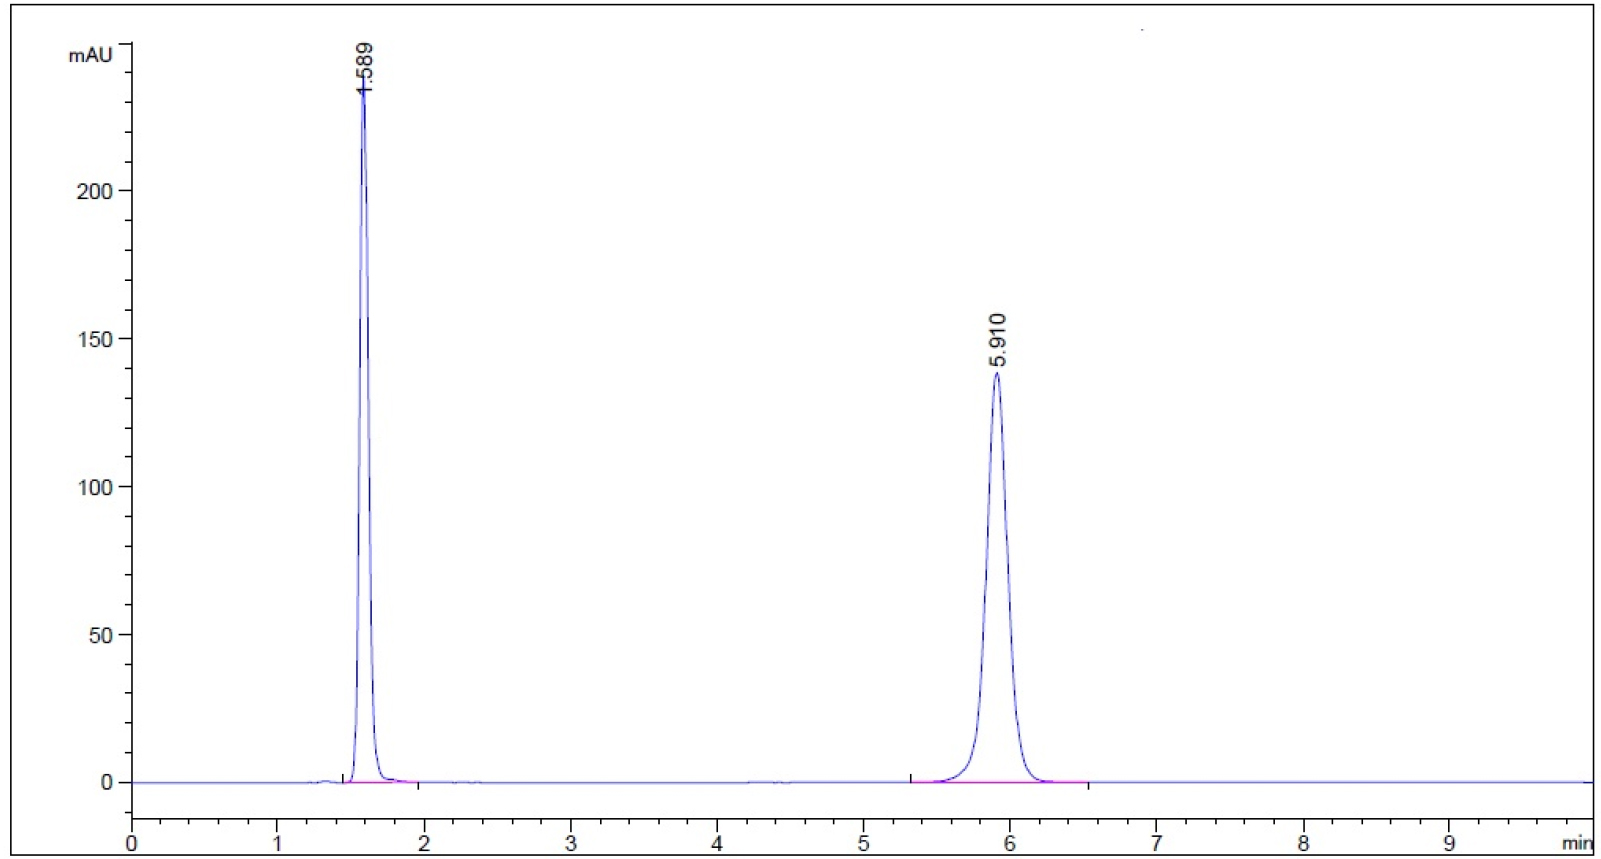
The chromatograms of stability indication method showed the degradant peaks generated by subjecting to 0.1 N HCl (acid), 0.1 N NaOH (base), 50 oC (heat) and 3% hydrogen peroxide solution under the exposure time periods described in Section 2.24 either did not produce degradant peak or separated well from analyte (guaifenesin) peak. All the resolution (Rs) were greater than 2 (Please refer to supplemental file).
One-stage In Vitro Dissolution Study Using Water as Medium
The dissolution duration and temperature, paddle stir rate, and sampling schedule were chosen as 12 h, 37.0 ± 0.5 oC, 50 rpm and 0.25, 0.75, 1, 3, 4, 6, 8, 01 and 12 h. When the dissolution samples were quantified using Monograph mobile phase, the bilayer ER tablets released 28.0 ± 1.4 % guaifenesin into water at 45 min, 30.4 ± 1.7 % at 1 h, 44.1 ± 6.0 % at 3 h, and 72.1 ± 4.4 % at 12 h (n = 4, Table 2a). When the same samples were assayed using 50% methanol as the mobile phase, the drug releases were: 29.5 ± 1.5 % at 45 min, 32.2 ± 1.6 % at 1 h, 44.7 ± 3.0 % at 3 h, and 75.7 ± 4.3 % at 12 h (n = 4, Table 2a). The dissolution profiles were almost identical and displayed as bi-phasic release when either mobile phase was used to quantify the same set of dissolution samples (n = 4, Figure 2).
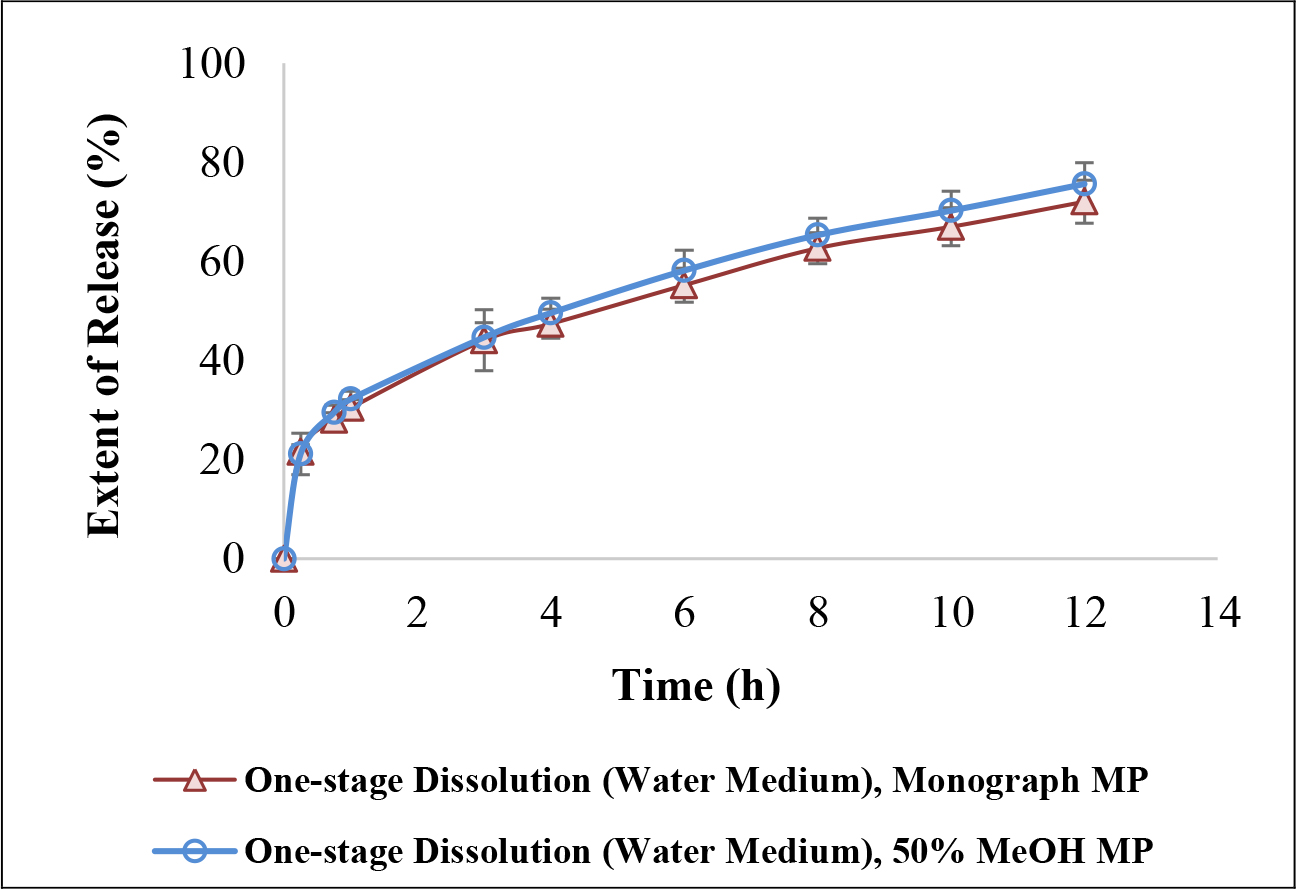
Figure 2. Similarity of one-stage 12-h in vitro dissolution profiles between the Monograph mobile phase (methanol/water/glacial acetic acid, 40:60:1.5, v/v/v) and the proposed mobile phase (50% MeOH) when water was the chosen dissolution medium.
Table 2. Cumulative percent of guaifenesin release from bi-layer tablets at key sampling points
(a) One-stage dissolution with different mobile phases
|
Sampling Time (h) |
Monograph MP |
50% MeOH |
P Value* |
|
0.75 |
28.0 ± 1.4 |
29.5 ± 1.5 |
< 0.001 (< 0.05) |
|
1 |
30.4 ± 1.7 |
32.2 ± 1.6 |
< 0.001 (> 0.05) |
|
3 |
44.1 ± 6.2 |
44.7 ± 3.0 |
< 0.001 (> 0.05) |
|
4 |
47.4 ± 2.9 |
49.6 ± 3.0 |
< 0.001 (> 0.05) |
|
12 |
72.1 ± 4.4 |
75.7 ± 4.3 |
< 0.01 (> 0.05) |
*Two-tailed distribution
(b) Different dissolution methods, but same mobile phase (monograph MP) to assay
|
Sampling |
Cumulative Release (%) in One-stage Method (Water) |
Cumulative Release (%) inTwo-stage Method |
P Value* |
|
0.75 |
28.0 ± 1.4 |
31.7 ± 4.1 |
> 0.05 |
|
1 |
30.4 ± 1.7 |
36.3 ± 4.0 |
< 0.05ξ |
|
3 |
44.1 ± 6.2 |
56.4 ± 4.4 |
< 0.01ξ |
|
4 |
47.4 ± 2.9 |
55.2 ± 2.1 |
< 0.01ξ |
|
12 |
72.1 ± 4.4 |
79.4 ± 1.9 |
< 0.05ξ |
*Two-tailed distribution
ξ Statistically significant
(c) Same two-stage (0.1 N HCl 3 h, then Buffer 9 h) dissolution method with different mobile phases
|
Dissolution |
Sampling Time (h) |
Cumulative Release (%) Using Monograph MP |
Cumulative Release (%) Using 50% MeOH as MP |
P Value* Paired-t test (Independent t-test) |
|
0.1 N HCl |
0.75 |
31.7 ± 4.1 |
32.2 ± 2.8 |
> 0.05 (> 0.05) |
|
1 |
36.3 ± 4.0 |
36.0 ± 3.0 |
> 0.05 (> 0.05) |
|
|
3 |
56.4 ± 4.4 |
55.0 ± 5.6 |
> 0.05 (> 0.05) |
|
|
Phosphate Buffer |
4 |
55.2 ± 2.1 |
45.8 ± 0.9 |
< 0.001 |
|
pH 6.8 |
12 |
79.4 ± 1.9 |
62.3 ± 0.7 |
< 0.001 |
*Two-tailed distribution
¥ Statistically significant in both paired and independent t-tests.
One-stage versus Two-stage In Vitro Dissolution Study Using Monograph Mobile Phase
The dissolution duration and temperature, paddle stir rate, and sampling schedule were kept the same as Section 3.4, but only the Monograph mobile phase (methanol/water/glacial acetic acid, 40:60:1.5, v/v/v [3], apparent pH was 3.08) was used. The drug release between one-stage and two-stage methods were 28.0 ± 1.4 % vs. 31.7 ± 4.1 % at 45 min, 30.4 ± 1.7 % vs. 36.3 ± 4.0 % at 1 h, 44.1 ± 6.2 % vs. 56.4 ± 4.4 % at 3 h, and 72.1 ± 4.4 % vs. 79.4 ± 1.9 % at 12 h (n = 4, Table 2b). These releases in these sampling points were different statistically after 45 min dissolution study (Table 2b, Figure 3a).
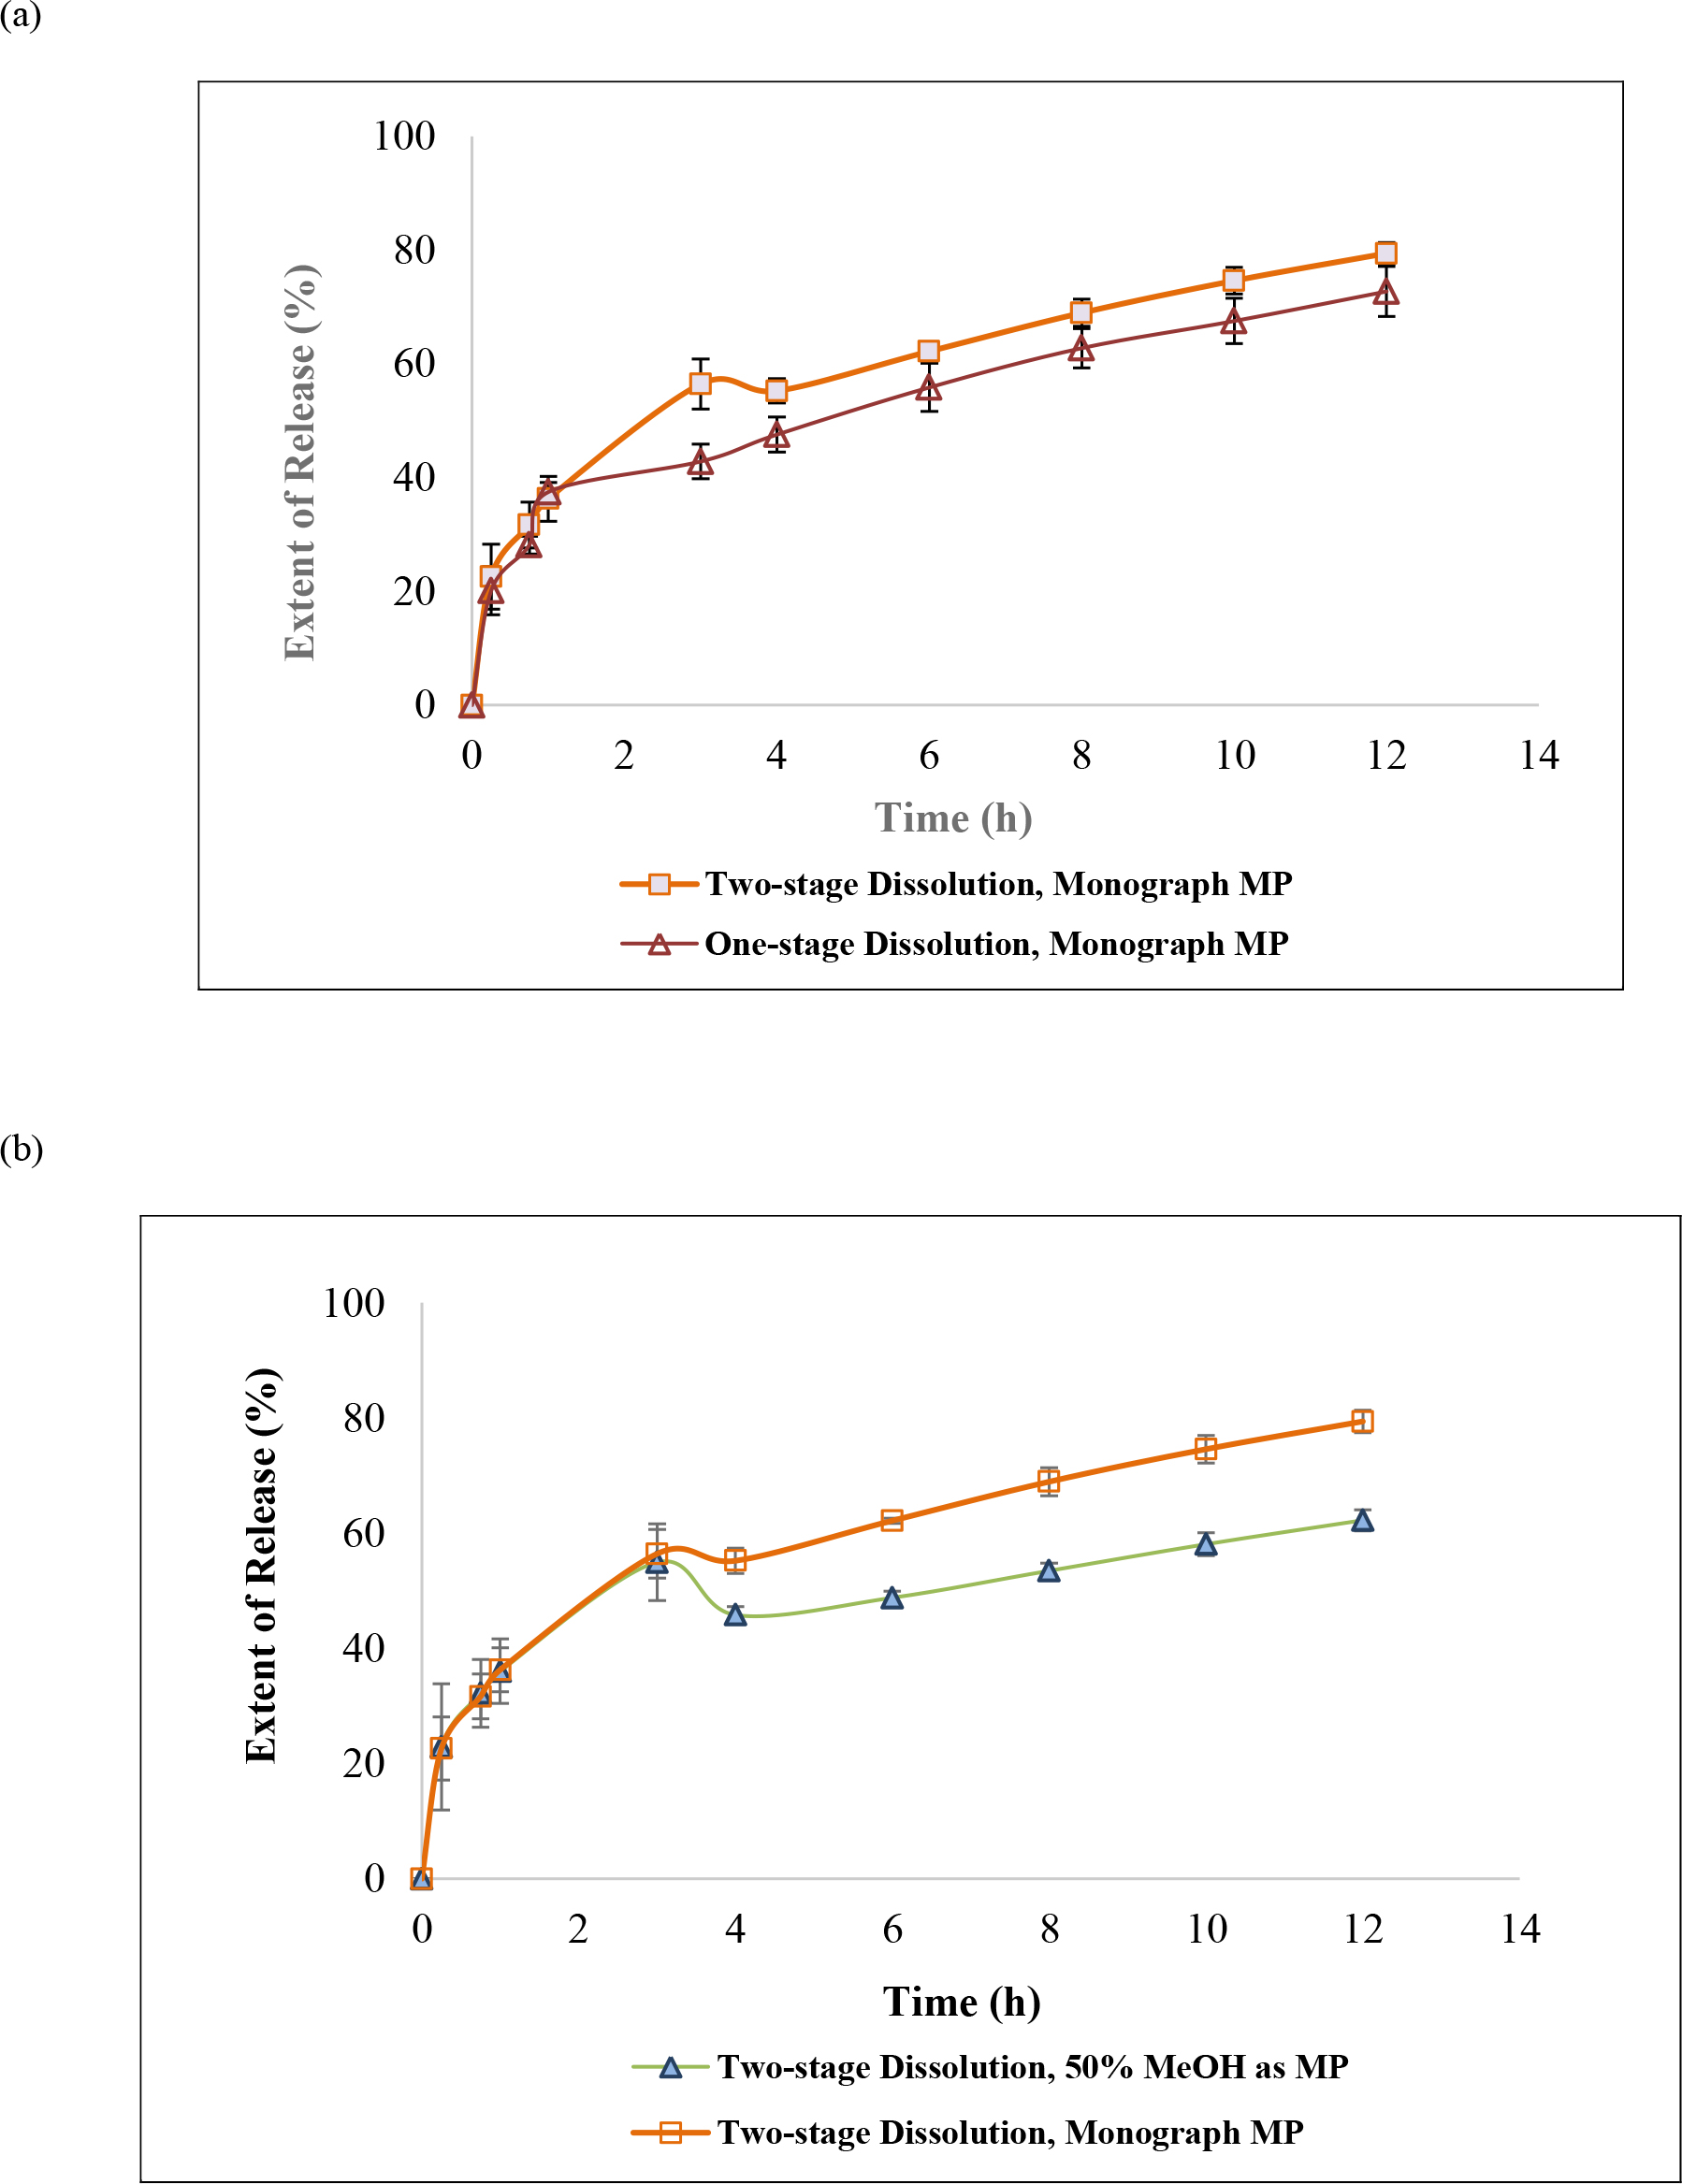
Figure 3. Dissolution method and mobile phase as factors impacting guaifenesin release profiles: (a) design of dissolution method: one-stage in water versus two-stage (acid and buffer stages) when USP Guaifenesin Tablets monograph mobile phase, and (b) selection of mobile phase: 50% MeOH versus USP Guaifenesin Tablets monograph mobile phase. A depression of 12.7% ± 1.4% (n = 4) present 1 h after the medium pH was adjusted to 6.8 (that is the end of 4 dissolution hours). This depression continued until dissolution ended (see text).
Two-stage In Vitro Dissolution Study Using 50% Methanol versus Monograph Mobile Phase
The dissolution method was a tablet was placed in 750 mL of 0.1 N HCl for 3 h, and then 250 mL of 0.2 M tribasic sodium phosphate was added into the apparatus vessel with the pH being adjusted to 6.8. The dissolution duration and temperature, paddle stir rate, and sampling schedule were kept the same as Section 3.4, but both monograph mobile phase (methanol/water/glacial acetic acid, 40:60:1.5, v/v/v [3], apparent pH was 3.08) and the proposed mobile phase (50% methanol) were used respectively. The resultant AUC were converted into cumulative % of release and compared. The release profiles in Acid stage (time 0 to 3 h) quantified by both mobile phases were almost identical (Figure 3b). The cumulative percent of releases in Acid stage using Monograph mobile phase and 50% methanol as mobile phase were 31.7 ± 4.1 % vs. 32.2 ± 2.8 % at 45 min, 36.3 ± 4.0 % vs. 36.0 ± 3.0 % at 1 h, 56.4.1 ± 4.4 % vs. 55.0 ± 5.6 % at 3 h (Table 2c). Never the less, the profiles were statistically different in the Buffer stage (3 to 12 h, Figure 3b, and Table 2c). The cumulative percent of releases in Buffer stage using Monograph mobile phase and 50% methanol as mobile phase were 55.2 ± 2.1 % vs. 45.8 ± 0.9 % at 4 h (which means one hour after the pH had been adjusted to 6.8), 79.4 ± 1.9 % vs. 62.3 ± 0.7 % at 12 h (Table 2c).
Power Law Approximation
On order to fit Power Law Approximation equation, the data had to be taken from extended release region. Since the studied tablet was designed as IR/ER bilayer, we subtracted the cumulative amount of release from the dissolution study at a particular sampling point from the cumulative amount of drug release in the first hour (immediate layer) as Mt iin Equation 1, and further divided Mt by M∞. M∞ was the label amount (1200 mg) minus cumulative amount in 1 hour. The fraction was then plotted against the time of drug released from the ER layer (the total dissolution time minus 1 hour in immediate release layer). Power equations in different dissolution methods and mobile phases were obtained using Excel scatter plot trendline options. The value of the power exponent (n) was 0.767 for both mobile phases, while the prefactor (k) was 0.1007 for Monograph mobile phase and 0.1068 for the proposed mobile phase (50% methanol). The reason of choosing data from hour 2 to hour 12 to fit Peppas power law was based on General Chapter <1088> In Vitro and In Vivo Evaluation of Dosage Forms describes that “For immediate-release dosage forms the in vitro dissolution process typically requires no more than 60 min…” [3]. According to Table 1, the obtained power exponent illustrate that the ER layer of this bi-layer tablet follows Fickian diffusion (Table 3). The Peppas power law was also applied to two-stage dissolution from hour 2 to hour 12 as well as hour 4 to hour 12 using both mobile phases. But the data from hour 2 to hour 12 in the two-stage dissolution method using either mobile phase to quantify are not reported here due to the transition of Acid stage into Buffer stage at the end of hour 3 (Table 3) to avoid misguiding.
Table 3. The release exponent n of the Peppas power equation and drug release mechanism using the ER layer dissolution data from hour 2 to hour 12, and hour 4 to hour 12
|
Dissolution Method |
Dissoultion Period |
LC Mobile Phase |
Exponent (n) |
Drug Release Mechanism |
|
One-stage |
h 2 to h 12 |
Monograph |
0.767 |
Anomalous transport |
|
One-stage |
h 4 to h 12 |
Monograph |
0.692 |
Anomalous transport |
|
One-stage |
h 2 to h 12 |
50% methanol |
0.767 |
Anomalous transport |
|
One-stage |
h 4 to h 12 |
50% methanol |
0.703 |
Anomalous transport |
|
Two-stage |
h 2 to h 12 |
Monograph |
Not reported* |
|
|
Two-stage |
h 4 to h 12 |
Monograph |
0.639 |
Anomalous transport |
|
Two-stage |
h 2 to h 12 |
50% methanol |
Not reported* |
|
|
Two-stage |
h 4 to h 12 |
50% methanol |
0.775 |
Anomalous transport |
*Due to the transition between acid stage and buffer stages at hour 3 (see text).
Discussion
Hydrogels are polymer networks that contain a substantial amount of water. Dry polymer networks can absorb tens, hundreds, or even thousands of times their weight in water without or with dissolving. They have the properties to those of soft biological tissues and of great utility in pharmacy due to a low interfacial tension and less irritation [9]. The polymer network was able to sustain its own structural integrity through cross-linkage [10]. According to General Chapters: <1088> In Vitro and In Vivo Evaluation of Dosage Forms describes that “For immediate-release dosage forms the in vitro dissolution process typically requires no more than 60 min…”. Using this definition, the drug load in an ER bilayer tablet was determined as approximate ≤ 30% in IR white layer, and the remaining in ER blue layer. The residual tablets were retrieved at the end of the 12-h dissolution study showed white layer of the ER bilayer tablet disappeared, but the blue layer swelled but the integrity was still kept (Figure 4). When the bilayer tablet was cut vertically, the polymers in the core were still densely packed reflecting that dissolution medium had penetrated into the tablet core, but the polymer had not yet fully swelled or disintegrated, which resulted in the tolerance for only about 70% to 75% (Q) of the labeled amount. In addition, the leaching of the colorant and erosion of polymer were evidenced by the dissolution medium changed from clear into light blue and the medium became more viscous and slightly sticky in the 12-h release study.
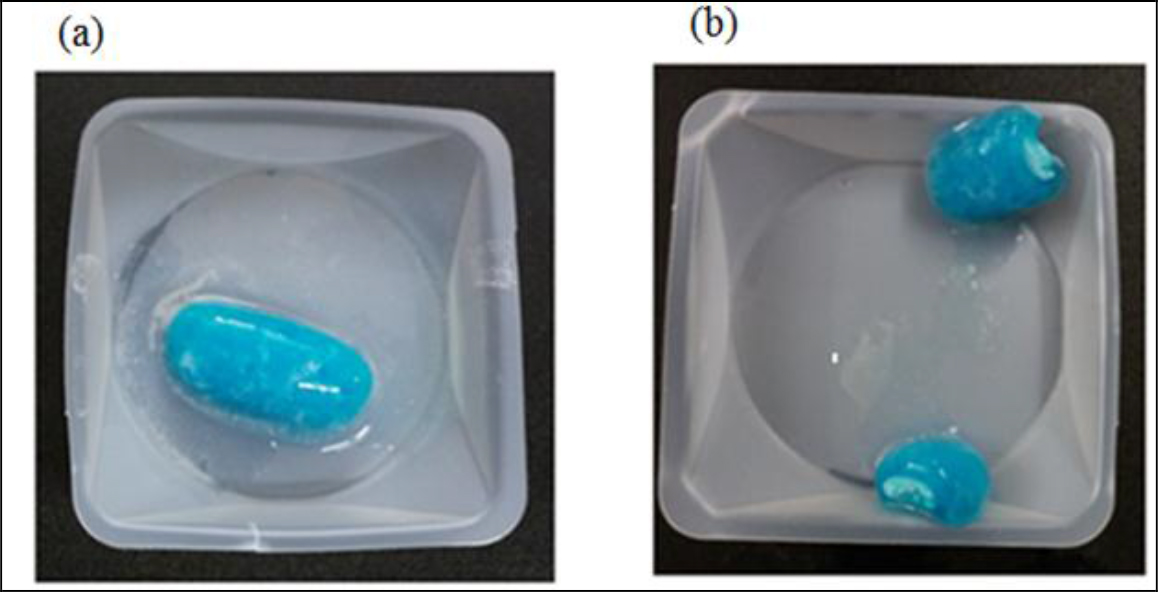
Figure 4. A studied tablet was retrieved from a dissolution vessel: (a) at the end of the 12-h study, and (b) the cross-section shows the core was still densely packed. No significant difference was noticed whether the tablet was retrieved from water or phosphate butter pH 6.8.
The in vitro release data of the ER bilayer tablets from 2 h to 12 h (as the extended release region based on General Chapter < 1088 >) was able to format into a power equation with the power exponent (n) in the range of 0.7 (n = 4, Table 3). Matching the exponent (n value) with those cylindrical geometry in Table 1, its release mechanism was anomalous transport (between Fickian diffusion and polyer swelling), but was closer to polymer swelling mechanism. Peppas and coworkers [4, 5, 6] studied theophylline release from poly(HEMA-co-NVP) [poly(2-hydroxyethylmethacrylate-co-N-vinylpyrrolidone)] disks into distilled water. The tablet geometry of this project was a caplet shape (Figure 1). Siepmann J and Siepmann F also mentioned that the thicker the samples a slightly slowing down of release with time is displayed [6]. This was probably due to drug diffusion becoming increasing more rate limiting. Diffusion is slower at greater distances. When plotting the cumulative amount of drug release versus time, geometry, drug solubility and inhomogeneous initial drug distribution [4, 5, 6] may also impact the value of n (power exponent).
The six inactive ingredients of the ER bilayer tablets and their pharmaceutical functions were stated in Section 3.1. They were composed of coloring agent, controlled-release agent, lubricant, tablet diluent, tablet disintegrant, and gelling agent. Therefore, photos taken after a tablet retrieved from the vessel at the end of a dissolution study were dissected to support the release mechanism of anomalous transport determined from Peppas power law power exponent (n). As seen in Figure 4, there is a clearly defined font between the swollen polymer layer and damped tablet core suggesting that polymer relaxation is required for guaifenesin to be released into either water or phosphate buffer pH 6.8.
Conclusion
In vitro dissolution study may be applied to approximate the drug loaded in IR layer and ER layers of an oral tablet. The current study also supports the use of water as the dissolution medium for extended release dosage forms, because time efficacy and green laboratory practice bring affordable products to our patients. Never the less the selection of a proper mobile phase is of essential. The project suggests that for sake of accuracy and precision, one-stage and two-stage dissolution profiles be compared with the same selected mobile phase. If they are similar, the one-stage study using water as dissolution medium may then be preceded. From Peppa power law as well as the dissection examination of retrieved tablets, the ER layer of the bilayer tablet most likely used anomalous transport mechanism to release guaifenesin.
References
- https://medical-dictionary.thefreedictionary.com/guaifenesin
- http://www.mucinex.com/media/854/drug-facts-maximum-strength-mucinex-se.pdf
- U.S. Pharmacopeial Convention (2018) USP Monographs: Guaifenesin, Guaifenesin Tablets, NF Monographs: Sodium Starch Glycolate, General Chapters: <711> Dissolution. In: USP42-NF37. Rockville MD: U.S. Pharmacopeia; 2018: 2121, 2124, 5962, and 6870.
- Peppas NA (1985) Analysis of Fickian and non-Fickian drug release from polymers. Pharmaceutica Acta Helvetiae 60: 110–111.
- Siepmann J, Peppas NA (2001) Modeling of drug release from delivery systems based on hydroxypropyl methycellulose (HPMC). Adv Drug Deliv Rev 48: 139–157.
- Siepmann J, Siepmann F (2012) Swelling Controlled Drug Delivery Systems. In: Siepmann J, Siegel RA, Rathbone MJ (eds.), Fundamentals and Applications of Controlled Release Drug Delivery. Springer Pg No: 154–162.
- Rowe RC, Sheskey PJ, Quinn ME (2009) Handbook of Pharmaceutical Excipients, 6thedn: Pharmaceutical Press: London, UK.
- Kupiec T, Skinner R, Lanier L (2008) Stability Versus Potency Testing: The Madness is in the Method. Int J Pharmaceutical Compounding, 12: 50–55.
- L.R, Kirkland JJ, Glajch JL (1997) Completing the Method: Validation and Transfer. In: L.R., Kirkland J.J., Glajch J.L. (Eds.), Practical HPLC Method Development. Snyder John Wiley & Sons Pg No: 709
- Siegel RA, Alvarez-Lorenzo C (2017) Hydrogels. In: Hillery A, Park K (eds.), Drug Delivery: Fundamentals and Applications CRC Press Pg No: 333.
- Hydrogel Materials (2014) Drug Delivery: Materials Design and Clinical Perspective. In: Holowka EP, Bhatia SK (eds.), Springer Pg No: 225.
Supplemental Material
Validation of HPLC Method to Assay Guaifenesin in Acid Stage, Buffer Stage Media and Water Using Proposed Mobile Phase (50% Methanol)
Stability Indication Method of Guaifenesin in Acid Stage, Buffer Stage Media and Water using HPLC with the proposed mobile phase (50% Methanol): in acid-stage medium and subjected to 0.1 N HCl for 1 h; (b) in acid-stage medium and subjected to 0.1 N NaOH for 1 h; (c) in acid stage medium and subjected to 50oC for 1 h; (d) acid-stage medium and subjected to 3% hydrogen peroxide for 5 min; (e) in buffer stage medium and subjected to 0.1 N HCl for 1 h; (f) in buffer stage medium and subjected to 0.1 N NaOH for 1 h; (g) in buffer stage medium and subjected to 50 oC for 1 h; (h) in buffer stage medium and subjected to 3% hydrogen peroxide for 5 min; (i) in purified water and subjected to 50 oC for 1 h; (j) in purified water and subjected to 0.1 N HCl for 1 h; (k) in purified water and subjected to 0.1 N NaOH for 1 h; (l) in purified water and subjected to 3% hydrogen peroxide for 5 min; and (m) in purified water without guaifenesin and subjected to 3% hydrogen peroxide for 5 min as control.
- Guaifenesin in acid stage medium (0.1 N HCl) – subject to 0.1 N HCl for 1 hour prior to being neutralized with 0.1 N NaOH to neutral pH (n = 3, please refer to pdf version of chromatograms.)
- Guaifenesin in acid stage medium (0.1 N HCl) – subject to 0.1 N NaOH for 1 hour prior to being neutralized with 0.1 N HCl to neutral pH (n = 3, please refer to pdf version of chromatograms.)
- Guaifenesin in acid stage medium (0.1 N HCl) – subject to 50 oC for 1 hour prior to cooling to room temperature (n = 3, please refer to pdf version of chromatograms)
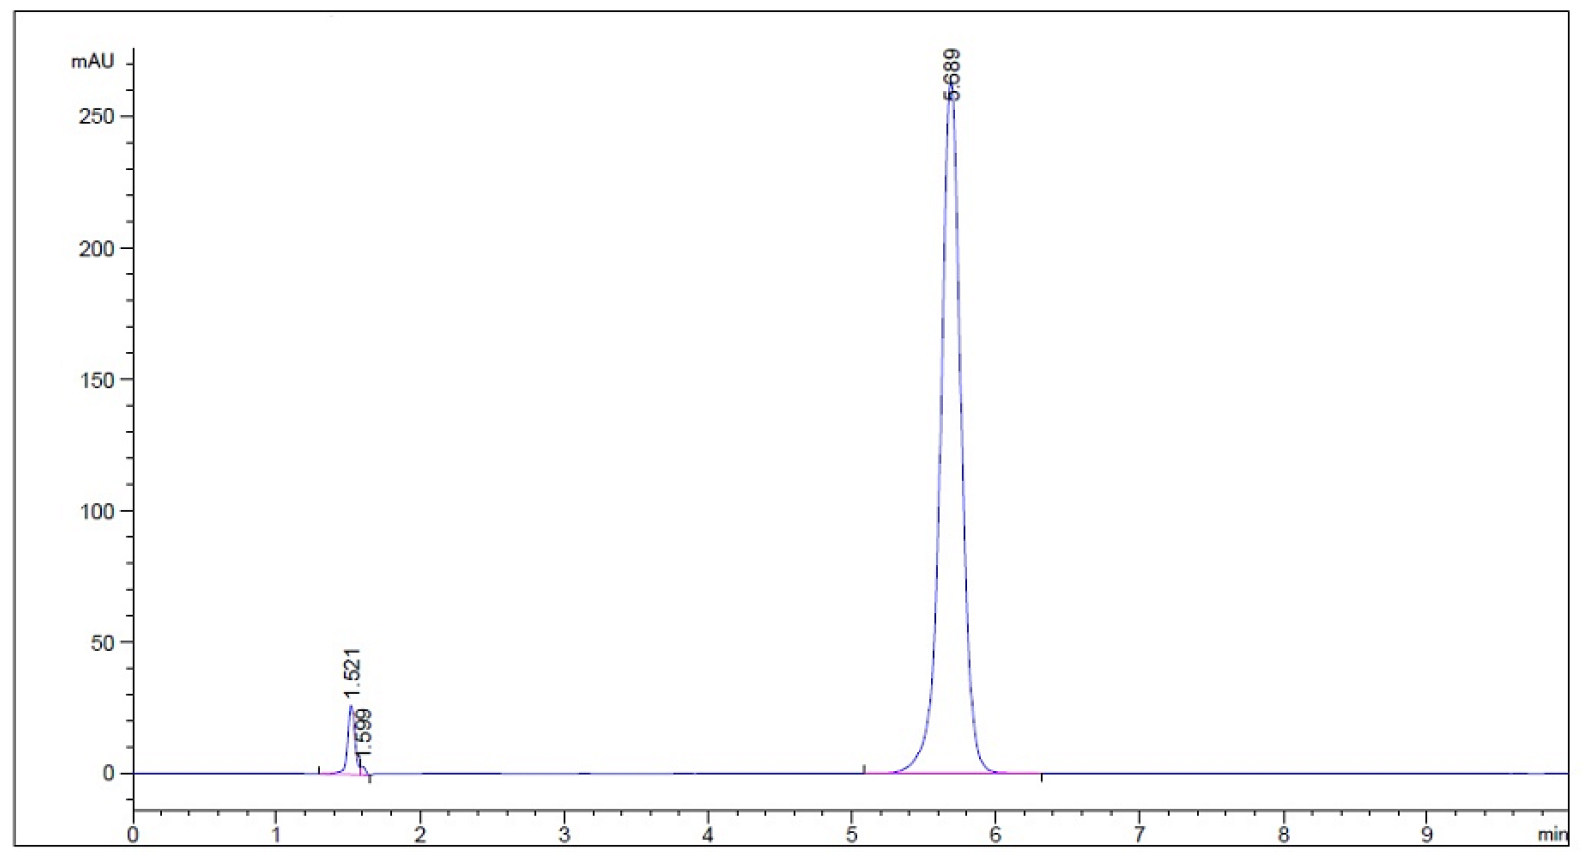
- Guaifenesin in acid stage medium (0.1 N HCl) – subject to 3% hydrogen peroxide for 5 min prior to decomposing hydrogen peroxide into water and oxygen and allowing the excess oxygen to escape (n = 3, please refer to pdf version of chromatograms.)
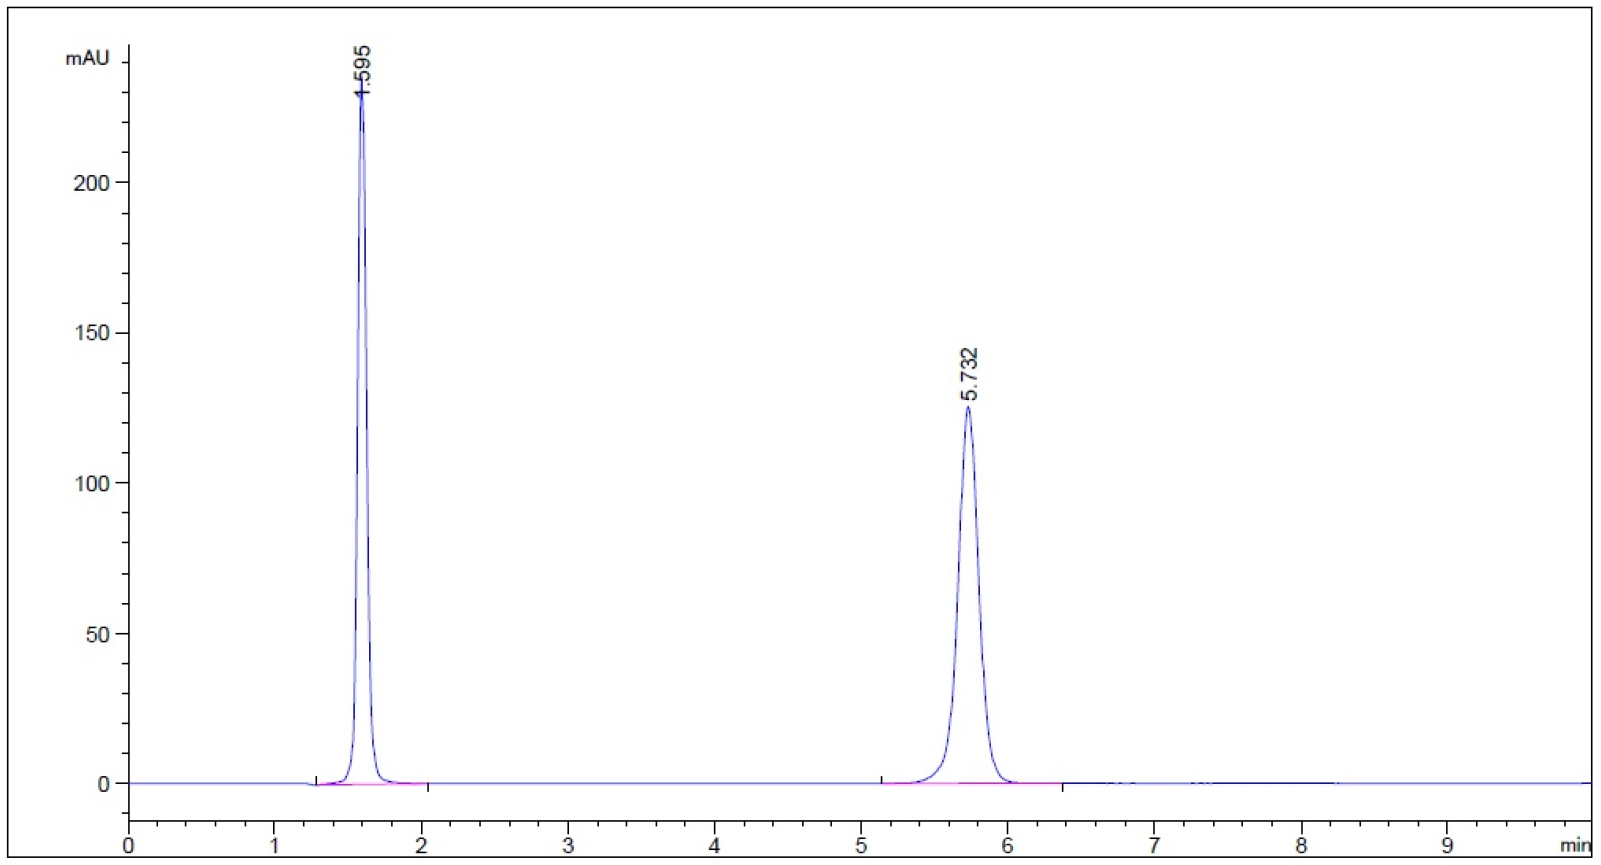
- Guaifenesin in buffer stage medium (phosphate buffer, pH 6.8) – subject to 0.1 N HCl for 1 hour prior to being neutralized with 0.1 N NaOH to neutral pH (n = 3, please refer to pdf version of chromatograms.)
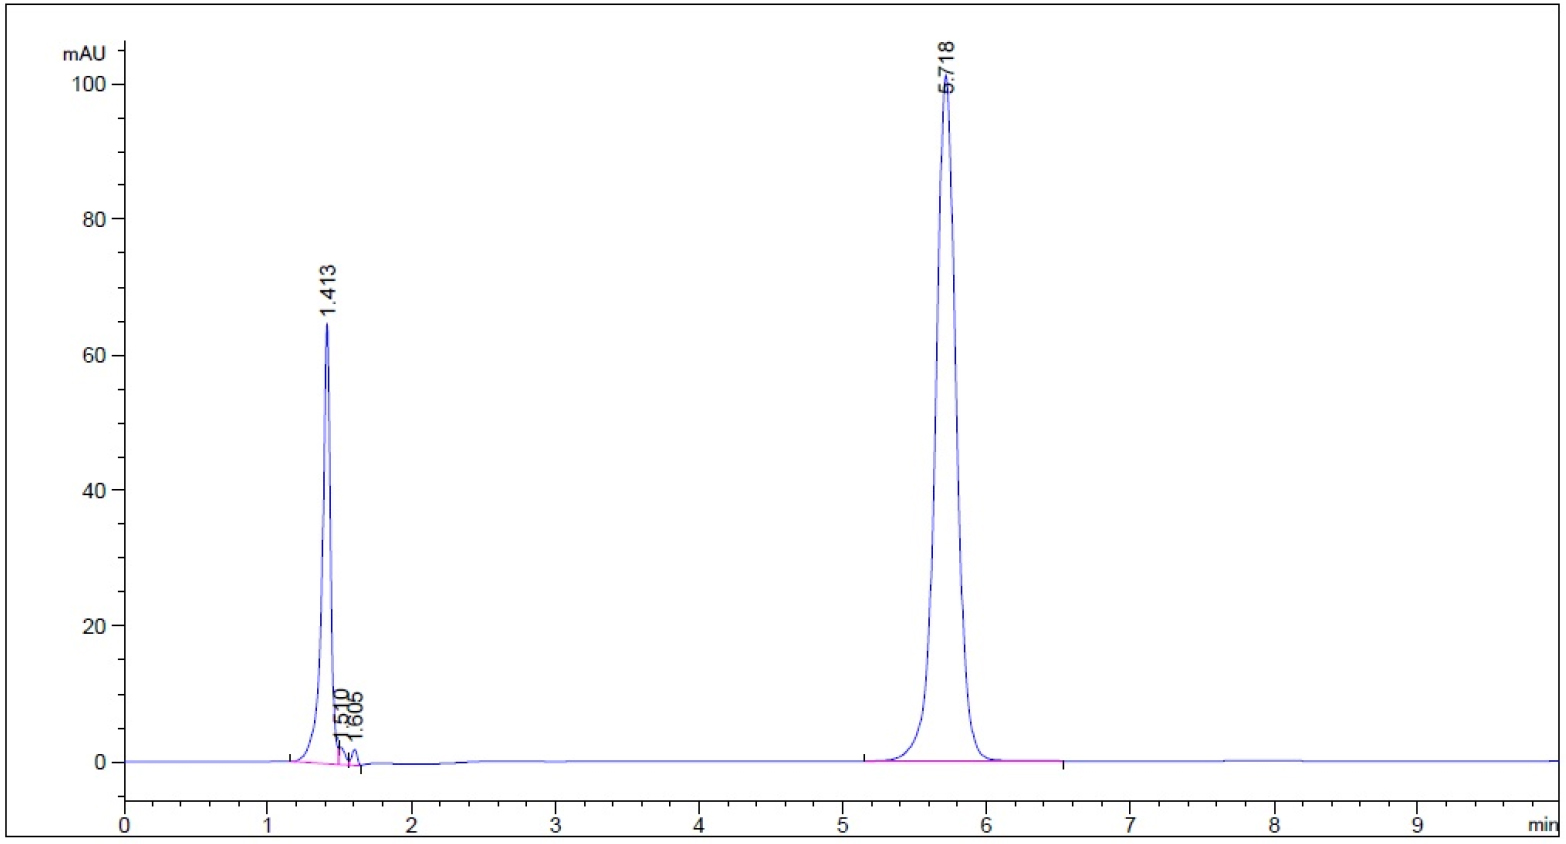
- Guaifenesin in buffer stage medium (phosphate buffer, pH 6.8) – subject to 0.1 N NaOH for 1 hour prior to being neutralized with 0.1 N HCl to neutral pH (n = 3, please refer to pdf version of chromatograms.)
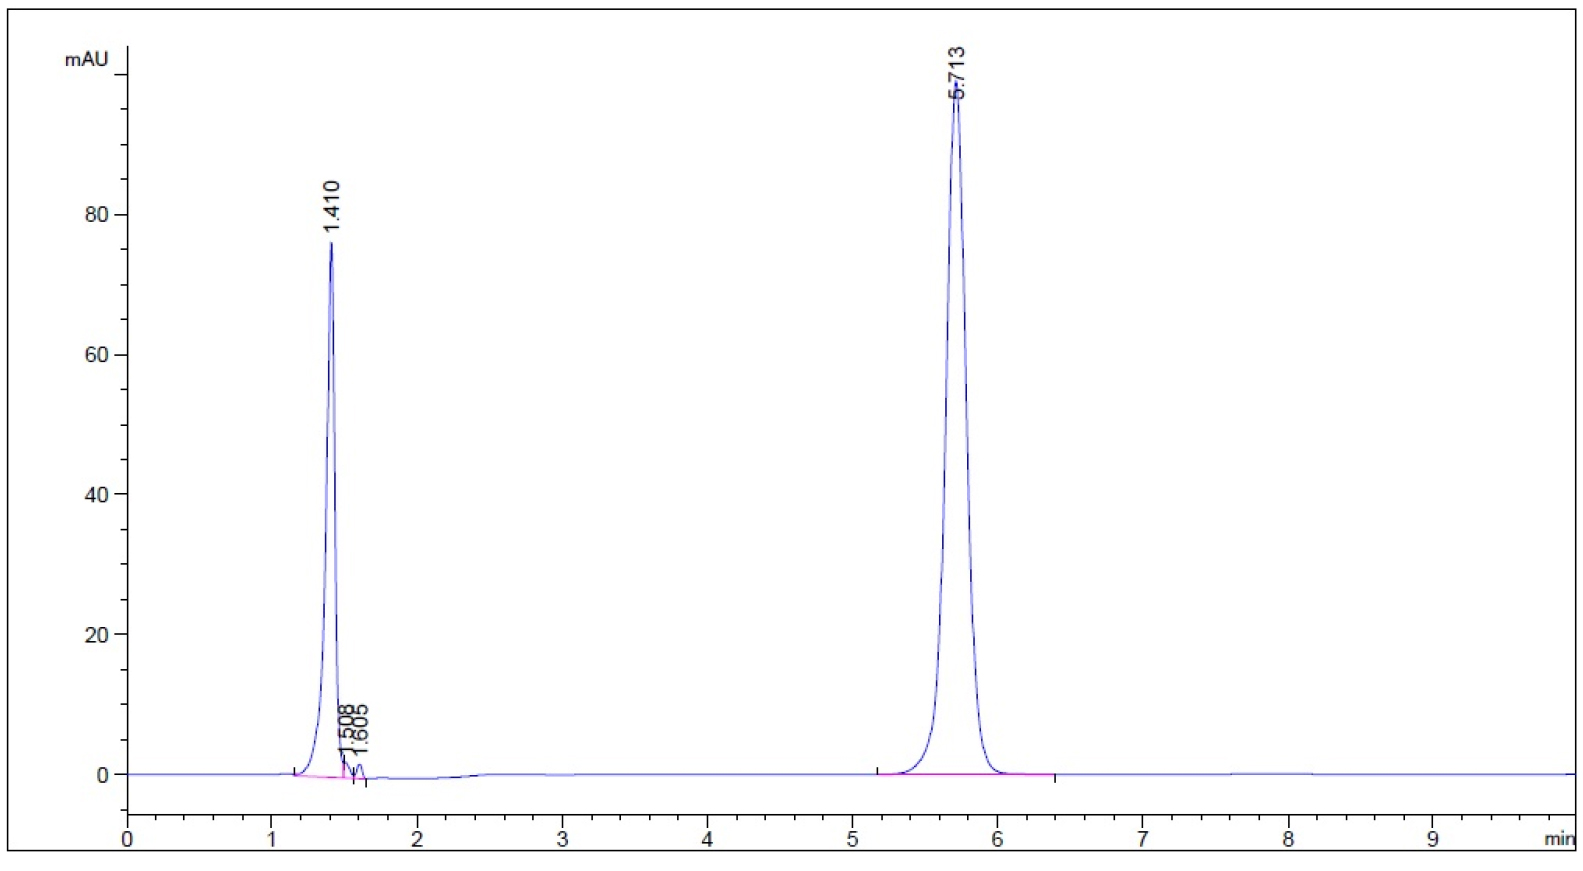
- Guaifenesin in buffer stage medium (phosphate buffer, pH 6.8)– Subject to 50 oC for 1 hour prior to cooling to room temperature (n = 3, please refer to pdf version of chromatograms)
- Guaifenesin in buffer stage medium (phosphate buffer, pH 6.8) – subject to 3% hydrogen peroxide for 5 min prior to decomposing hydrogen peroxide into water and oxygen and allowing the excess oxygen to escape (n = 3, please refer to pdf version of chromatograms.)
- Guaifenesin in purified water – subject to 50 oC for 1 hour prior to cooling to room temperature (n = 3, please refer to pdf version of chromatograms)
- Guaifenesin in purified water – subject to 0.1 N HCl for 1 hour prior to being neutralized with 0.1 N NaOH to neutral pH (n = 3, please refer to pdf version of chromatograms.)
- Guaifenesin in purified water – subject to 0.1 N NaOH for 1 hour prior to being neutralized with 0.1 N HCl to neutral pH (n = 3, please refer to pdf version of chromatograms.)
- Guaifenesin in purified water – subject to 3% hydrogen peroxide for 5 min prior to decomposing hydrogen peroxide into water and oxygen and allowing the excess oxygen to escape (n = 3, please refer to pdf version of chromatograms.)
- Purified water without guaifenesin – subject to 3% hydrogen peroxide for 5 min prior to decomposing hydrogen peroxide into water and oxygen and allowing the excess oxygen to escape (as a control group)