Abstract
We show, in short, using Raman spectroscopy, that upon dissolving boric acid [H3BO3] in heavy water [D2O], all stoichiometric phases form solid crystalline phases and can be detected. The pure D3BO3phase is very rare, but it can be proved. Intermedia forms were not found. Deuterium in higher concentrations in nature is, however, possible in connection with supercritical fluids coming from the mantle region.
Keywords
Raman spectroscopy, heavy water [D2O], solid phases: H3BO3, H2DBO3, HD2BO3, and D3BO3, pegmatites
Introduction
Boron, the fifth element of the periodic table, is relatively rare on Earth, with a concentration of 2.5 ppm in acid rocks. In granite rocks, the average concentration is 15 ppm [1]. Generally, boron is present in the Earth’s crust in its compounds, as tourmaline and other complex minerals. The author has also recently found boron as a mineral in the upper crust [2]. In mineral-forming minerals, especially in pegmatites, boron appears as boric acid [H3BO3], often as a daughter mineral in fluid and melt inclusions in different minerals (quartz, tourmaline, hambergite, beryl, topaz). Raman data of boric acid are difficult for the general public to access. Most publications on this topic are not open access. Therefore, we provide a brief overview of the Raman spectra, including those of deuterium-bearing phases. Because Raman spectroscopy is a relatively straightforward and accurate method for determining the Raman shift by the exchange of hydrogen of boric acid [H3BO3] by deuterium [D], we will show, using the leading Raman bands, the stoichiometric exchange of hydrogen by deuterium.
Methods and Samples
Microscopy, Raman Spectroscopy
Besides a polarization microscope for transmission (JenaLab Pol), we performed all microscopic and Raman spectroscopic studies with a petrographic polarization microscope (BX 43) equipped with an XY- or rotating stage, coupled to the EnSpectr Raman spectrometer R532 (Enhanced Spectrometry, Inc., Mountain View, CA, USA) in transmission. The Raman spectra were recorded in the spectral range of 0–4000 cm−1 using the 30 mW of a single-mode 532 nm laser, an entrance aperture of 20 µm, a holographic grating of 1800 g/mm, and a spectral resolution of 4 cm−1. Solid boric acid (sassolite) crystals are easy to identify under crossed Nicols under the transmission light by their peculiar interference color.
Samples
Deuterium-rich boric acid phases are prepared by dissolving commercial nB-boric acid in pure D2O (heavy water (99.9%) from the PElementeSamples, Belchertown, MA) in surplus. nB refers to boron with natural abundance of the boron isotopes: 80.22% 11B and 19.78% 10B. Droplets of such solutions are placed on the microscope slice, with a deepening in the middle, and the solid boric acid phases slowly crystallize as the heavy water vaporizes at room temperature. Through this slow process, a fractionation of the solid phases occurs according to the schema:
2H3BO3 + 3D2O → 2D3BO3 + 3H2O (1)
H3BO3 + D2O → HD2BO3 + H2O (2)
2H3BO3 + D2O → 2H2DBO3 + H2O (3)
Besides stoichiometric phases, subordinate phases are theoretically possible as well. However, as we will see clearly, the stoichiometric phases are dominant. The relatively large standard deviations of the D-influenced Raman lines allow them to be incorporated as traces. That means that at low deuterium concentration, we mainly observe it inserting into the Raman main line at 880 cm-1, which results in a slight shift to lower values. In our experiments to produce D-bearing boric acid phases, the formation of small amounts of water [H2O], shown in equations (1) to (3), is detectable [3,4]. In our case, 8% (g/g) water was estimated by Raman.
Results
Gmelin’s handbook (1954) [5] gives only 7 Raman lines for boric acid: 503 (4), 880 (6), 1065 (0), 1155 (0), 3180 (3), 3256 (1), and 3574 (3). The numbers in brackets are relative intensities. Boric acid shows, according to Krishnan (1963) [6], 11 Raman lines (4Ag + 2E1g + 5E2g), including three lines from the lattice spectrum. During our study, we have found all 11 Raman lines/bands (Table 1 and Figure 1).
Table 1: Raman lines of boric acid [H3nBO3 ] according to Krishnan (1963) and own measurements using the 532 nm laser.
|
H3BO3 |
Intensity (relative) |
Assignment |
||
|
Krishnan, 1963 |
This work |
|||
|
Raman band (cm-1) |
Species |
Raman band (cm-1) |
||
|
60 |
Ag | 76.0 ± 1.6 |
w |
Lattice- oscillation |
|
128 |
E1g | 119.1 ± 3.8 |
w |
Lattice- oscillation |
|
210 |
E2g | 207.8 ± 1.6 |
m |
OH-O bonds |
|
499 |
E2g | 497.2 ± 3.8 |
m |
O-B-O bending |
|
884 |
Ag | 879.8 ± 0.3 |
vs |
B-O stretching |
|
1085 |
Ag | 1092.0 ± 7.2 |
w |
B-O-H bending |
|
1172 |
E2g | 1166.6 ± 2.7 |
w |
O-H stretching |
|
1384 |
E2g | 1383.5 ± 6.3 |
w |
BOH bending |
|
– |
2294.1 ± 2.7 |
vw |
BOH bending |
|
|
3165 |
Ag | 3173.6 ± 4.2 |
w |
O-H stretching |
|
3251 |
Ag | 3246.4 ± 4.1 |
w |
O-H stretching |
Irel – relative intensity: vs – very strong, s – strong, m – medium, w – weak, vw -very weak.
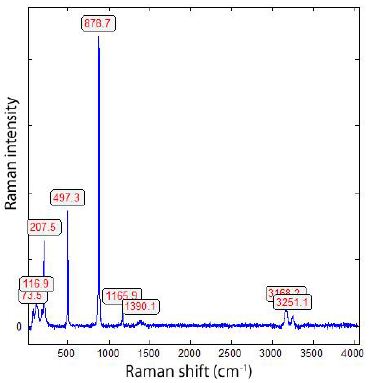
Figure 1: Raman spectrum of boric acid [H3BO3] using nB and the 532 nm Raman excitation in the Raman range from 50 to 4000 cm-1.
The differences in the Raman shift result from the use H3nBO3 and the fractionated crystallization in a droplet of distilled water on the microscope slide. The data in Table 1 are from Krishnan (1963) – [6] and own measurements (mean of 20 measurements per Raman line).
Krishnan (1963) [6] takes the Raman spectrum of crystalline boric acid using the mercury 253.7 nm line.
In a further step, we determined the Raman shift by substituting hydrogen with deuterium. Conspicuously act deuterium on the 880 cm-1 and the 129 cm-1 lines. Figure 2 shows the change in dependence of the substitution degree. Because the 880 cm-1 line (the main line of boric acid) shifts firmly with the substitution of hydrogen by deuterium, the assignment can not be correct – it should be exchanged by B-O-H stretching. As we see from Figure 2, the deuterium substitution influences the lattice oscillation powerfully.

Figure 2: Raman spectrum of boric acid [H3BO3] using nB and the 532 nm Raman excitation in the Raman range from 50 to 4000 cm-1 with the exchange of hydrogen by deuterium.
Figure 2 shows the Raman spectrum of boric acid, where the hydrogen (H) atom is stepwise replaced by deuterium (D), and the extracted results are summarized in Table 2 and Figure 3. In contrast to the Raman spectrum of pure H3BO3 (Figure 1), the spectrum of the deuterium-bearing boric acid is more complex, showing the presence of different D-bearing species (see Table 2 too), especially in the range between 812 – 880 cm-1, and in the range between 75 – 129 cm-1. Conspicuous for the D-bearing boric acid is the Raman band at 2415 cm-1. Pure H3BO3 shows only a very weak doublet in this region at 2235 and 2294 cm-1.
The data in Table 2 are plotted in Figure 3. The correlation coefficient R2 = 0.99914.
Table 2: Position of the main Raman lines at about 880 cm-1 and the Raman shift by including deuterium into the formula (mean of 20 measurements each).
|
Formula |
Raman position | Standard deviation |
Irel |
|
H3BO3 |
879.56 | 0.41 | s |
| H2DBO3 | 854.43 |
0.38 |
s |
|
HD2BO3 |
834.33 | 0.80 | m |
| D3BO3 | 812.78 | 1.46 |
vw |
Irel – relative intensity: vs – very strong, s – strong, m – medium, w – weak, vw -very weak.

Figure 3: Raman shift of the H3BO3 main line at 880 cm-1 in dependence on the number of deuterium (D) in the formula (subscripted numbers). Raman shift RS =879.236 – 24.729 D + 0.895 D2; SD = 0.9926 (RS – Raman shift, SD – standard deviation).
Table 3 summarizes the data for the low-frequency range, and Figure 4 shows the results plotted.
Table 3: Position of the main Raman lines 129 cm-1 and the Raman shift by including deuterium into the formula (mean of 20 measurements each).
|
Formula |
Raman position | Standard deviation | Irel |
| H3BO3 | 129.0 | 2.3 |
vs |
|
H2DBO3 |
116.8 | 0.6 | vs |
| HD2BO3 | 103.9 | 1.4 |
m |
|
D3BO3 |
75.3 | 0.9 |
m |
Irel – relative intensity: vs – very strong, s – strong, m – medium, w – weak.

Figure 4: Raman shift of the H3BO3 main line at 129 cm-1 in dependence on the number of deuterium (D) in the formula (subscripted numbers). Raman shift RS = 128.25 – 5.1 D – 4.1 D2; SD = 0.99293 (RS – Raman shift, SD – standard deviation).
The Raman lines for all deuterium-bearing species in the lattice oscillation range are all relatively intense. By contrast, the intensity of the Raman bands starting at 880 cm-1 declines very rapidly toward lower frequencies. The band for D3BO3 is, in comparison to H3BO3, very weak (see Figure 5). Sometimes the Raman band of H2DBO3 is significantly intense than the 880 and 129 cm-1 bands of pure H3BO3. This behavior results from the species formed by the exchange reaction of boric acid with D2O.

Figure 5: The four boric acid species (H3BO3 , H2DBO3 , HD2BO3 , and D3BO3 ) around 840 cm-1 . The different intensities result from the concentrations of the species in the measured crystal.
Figure 6 shows a Raman spectrum of nearly pure HD2BO3. The Raman band of H BO is completely missing. Table 4 gives the Raman data.
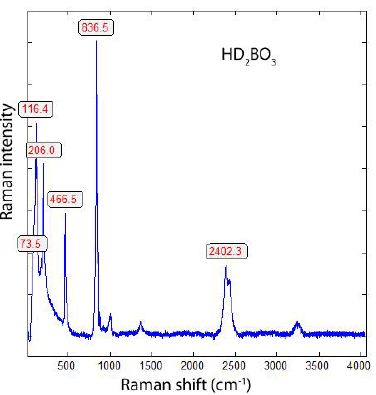
Figure 6: Raman spectrum of nearby pure HD2BO3. The intensity of the 2402 cm-1 band is strongly dependent on orientation.
Table 4: Raman bands of nearly pure HD2BO3 obtained from fractionated crystallization. Measurements using the 532 nm laser and 30 mW on the sample.
|
Raman band of HD2BO3 |
|||
| Raman band (cm-1) | Species | Relative intensity |
Nature of vibration |
|
73.5 |
Ag |
m |
Lattice-oscillation |
|
116.4 |
E1g |
s |
Lattice-oscillation |
|
206.0 |
E2g |
s |
OH-O bonds |
|
466.5 |
E2g |
m |
O-B-O bending |
|
836.5 |
Ag |
vs |
B-O stretching |
|
995.6 |
w |
B-O-H bending | |
|
1375.8 |
E2g |
w |
O-H stretching |
|
2377.2 |
E2g |
m |
BOH bending |
|
2402.3 |
E2g |
m |
BOH bending |
|
3244.1 |
Ag |
vw |
O-H stretching |
|
3251.0 |
Ag |
vw |
O-H stretching |
Irel – relative intensity: vs – very strong, s – strong, m – medium, w – weak, vw -very weak.
Discussion
In this short contribution, we demonstrate with Raman spectroscopy that by dissolving boric acid [H3BO3] into heavy water [D2O], stoichiometric phases like the equations (1) to (3) forms. The formation of pure D3BO3 after equation (1) is reduced. The formation of the non-stoichiometric mixtures could not be proved. The concentration of deuterium in nature is low; therefore, the different D-bearing phases are only very rare. Higher deuterium concentrations are expected in supercritical fluids that form pegmatites [7]. To obtain Raman spectra of the single D-bearing phases, an expensive separation, for example by fractionated crystallisation, is required.
References
- Rösler HJ, Lange H (1975) Geochemische Leipzig. Pg: 700.
- Thomas R (2025) Boron in some Variscan deposits in the German Geol Earth Mar Sci 7: 1-5.
- Thomas R (2000) Determination of water contents of granitic melt inclusions by confocal laser Raman microprobe spectroscopy. American Mineralogist 85: 868-872.
- Thomas R, Kamenetsky VS, Davidson P (2006) Laser Raman spectroscopic measurements of water in unexposed glass inclusions. American Mineralogist 91: 467-470.
- Gmelin L (1954) Gmelins Handbuch der anorganischen Chemie: Bor (Ergänzungsband). Verlag Chemie, Weinheim. Pg: 253.
- Krishnan K (1963) The Raman spectrum of boric acid. Proceedings of the Indian Academy of Sciences – Sec A. 57: 103-108.
- Thomas R (2024) NaHCO3-NaDCO3 and 13CO2-rich fluid inclusion in pegmatite quartz from Bornholm Island/Denmark. Geol Earth Mar Sci 6: 1-5.