Abstract
Green infrastructure refers to all manners of established green spaces that provides habitat for wildlife and ecosystem services for people. Areas with richer biodiversity is known to provide measurable benefits to the local wellbeing and the wider ecosystem, but it remains unclear if the size and the type of greenspace affect the extent of species richness. This study investigates the distribution of 92 species across green infrastructure in England to identify the variables which have the most effect on species richness. The results suggest that Forestry Commission Woodlands and Country Parks had the highest species richness, whilst Doorstep Greens and Village Greens returned the lowest species richness. ANOVA confirmed that the variation between the groups was significant. The main difference in the groups was the area, with Forestry Commission woods being on average 140 times larger than Doorstep Greens. When considering the greenspace with the highest species richness, habitats having highest mean area were woodland, managed grassland and waterfronts. These results confirm our intuition but also suggest that richer biodiversity can be only achieved in well preserved and managed woodlands and country parks occupying a sizable plot, and that regular patches of green infrastructure embedded within the urban areas do not offer high species richness.
Keywords
ANOVA, Biodiversity, Green infrastructure, Species richness, Woodlands
Introduction
Green Infrastructure (GI) is a relatively new term that is loosely defined as “a spatial structure providing benefits from nature to people [which] aims to enhance nature’s ability to deliver multiple valuable ecosystem goods and services such as clean air or water” [1]. More generally, it is a reference to established green spaces and new sites (of greenspace) that is considered to have a positive effect on our wellbeing and the wider society) [2], and they range from large areas such as agricultural land, forests, wetlands, woodlands and parks to individual street trees, private gardens, green roofs, rivers and transport corridors (UK Green Building Council 2015) [3]. Aside from the various social benefits and cultural services they offer to our society, GI has the potential to provide habitat and connectivity to wildlife. For instance, cities in the United States have seen an increase in the frequency and diversity of wildlife sightings, as more cities have invested in GI to improve their respective urban environment and achieve environmental resilience [4]. A systematic review of the literature [5] suggests that increase in biodiversity is generally considered to yield positive effect on human health. Also, GIs with greater diversity of avian species are known to evoke positive emotional responses from their visitors [6].
However, what triggers a greater range of biodiversity remains unclear. Lawton (1998) [7] once suggested that a coherent and resilient ecological network for biodiversity requires a series of larger habitat patches with good connectivity to other sites. In other words, larger areas usually hold more species present within them and the connectivity to other areas reduces the risk of localised extinctions due to changes in the local conditions. However, securing a large area of green space within and around the confined space of cities can be challenging. Also, it is unclear as to what types of green space are likely to offer high species richness. Most studies on GI and general greenspace have focused on a small sample size, or a short duration and were often unable to differentiate between greenspace type or quality. As a result, the association between the attributes of GI (the types of GI and the size in particular) and biodiversity remains understudied. Furthermore, with the predicted change in climate, a number of studies have investigated the ability of GI to alter the urban environment and alleviate the impact of climate change such as extreme temperature, rising sea levels, frequent extreme weather events and increase in the spread of diseases and pests [8-11]. Climate change is also considered to affect biodiversity with an increase in the intensity and frequency of droughts, storms and fires. For instance, the intense fires in Australia in 2019 and 2020 have increased the number of threatened species in GI and the vicinity of cities by 14% (The Royal Society 2021) [12]. Against this background, this study investigates which aspects of greenspaces would yield benefit for people and wildlife through maintaining and enhancing biodiversity.
Literature Review
Impact of Green Infrastructure on People
Green space is often considered to have a positive effect on our wider wellbeing, ranging from the reduction of post-surgery recovery time [13] to lowering cortisol levels and blood pressure [14]. However, this assertion is not conclusive, and some studies report a mixed or even negative impact of green space on our wider wellbeing. For instance, Shanahan et al. (2015) [15] systematically reviewed relevant studies and concluded that some studies reported reduced mortality and generally enhanced wellbeing, whilst some studies found no association between green space coverage and mortality, and one study even reported increase in mortality in relation to larger green space coverage. Similarly, Maas et al. (2009) [16] investigated the association between green space coverage and morbidity and other disease within a 1km window, and concluded that, the degree of urbanity of the study areas, rather than the area of green space, had stronger impact on the health outcomes. At the same time, Maas et al. (2009) also highlighted that having access to a greater green space coverage helped reduce anxiety related disorders. Others (Gong et al. 2014 [17], Coutts and Hahn, 2015) [18] report that, while accessibility of green space generally improves our health and wellbeing, the effect varies between different types of green space.
Impact of Green Infrastructure on Wildlife
The direct and indirect effects of GI on humans is wide ranging and findings in the literature are also varied. The impact of GI on wildlife, on the other hand, is more straightforward in that it provides habitat connectivity in an increasingly urbanised world [19]. Several studies have attempted to assess which aspects of GI are important for different species, and their findings vary greatly, including size, connectivity/isolation, the management regime and type of habitats present within the GI [20-22]. Birds are among the most widely studied taxa in relation to GI, because they are relatively easy to survey and their life cycles are well understood [23]. For instance, Chamberlain et al. (2007) [24] investigated bird species richness in urban parks in London and found that site area was the most important factor related to bird species richness and that, in smaller sites, the presence of a high number of adjacent gardens caused the species richness to increase. In addition to size, those areas which held rough grass or waterbodies also returned higher species richness. The authors noted that the relationship between size and species richness simply reflects the fact that larger greenspaces tend to contain a higher number of habitats, which could attract a wider range of species. Negative associations were also recorded for the presence of buildings, roads and pavements across both the species groups and the seasons. In a similar study, Zorzal et al. (2020) [20] found that the taxonomic diversity of bird species recorded across six urban greenspaces in Brazil was positively associated with greenspace area. However, when analysing the bird diversity against a proximity index, the study found that there were no correlations with maximum noise or the degree of patch isolation. They also found that species richness had a positive correlation with the heterogeneity of the habitats within each greenspace. The study was limited to a relatively small sample size as it was constrained by the number of accessible urban greenspaces available. Other studies ranged from bird populations in Sweden [22], to bumble bee populations in relation to the urban features of San Francisco [25], amphibians in New Jersey, McCarthy and Lathrop (2011), and general insect diversity in green roofs in Nova Scotia [26], most of which found richer biodiversity in GI away from urban centres, and in GI with larger area.
Furthermore, a study in Slovenia by Groot et al. (2021) [27] found that out of the 2 most prevalent urban greenspace types in Ljubljana (urban forest and managed park) there was a lower abundance of bird species within parks than urban forest, but that species richness and species composition were not affected by greenspace type. Greenspace area significantly affected the bird abundance and greenspace type influenced which species was designated as indicative of the habitat. Although there were no significant differences in bird biodiversity between urban and peri-urban areas, Ljubljana holds relatively large areas of urban forest and the impact of urbanisation (e.g. disturbance, predation) are likely to be reduced. The link between biodiversity and the provision of ecosystem services has been explored further in a literature review by Sandifer et al. (2015) [5]. In their review, papers concentrating on the effects of biodiversity on ecosystem services were considered in order to provide a body of evidence on the effects of biodiversity on human health. The review highlighted that in the most part, biodiversity assists good human health and that in studies where relationships were not found, this could be attributed to a lack of suitable data, although there is the possibility of a confounding effect of socio-economic status on human health. Most of the studies investigated had inadequate sample sizes, study durations or measured controls, or were found to be lacking in rigorous statistics; objective data; unable to differentiate between greenspace type or quality; showing evidence of long-term effects; or suffering from the suite of health data collected being too narrow. Very few studies also attempted to identify the mechanisms through which the effects of biodiversity work.
Assessing the Quality of Green Infrastructure
Many of the studies highlighted above did not account for the quality of the GI in their analyses. Quality of GI can be measured in the field, which allows for detailed surveys of local areas, but this is time-intensive and cannot be easily extrapolated across larger areas. Another way to determine quality is through the use of GIS and spatial modelling where a set of spatial criteria are captured through remote sensing and/or a composite index was used for representing the regional environmental quality [28]. The quality of GI measured with respect to their benefit to humans as well as the wildlife can be analysed by assessing the current value of different Ecosystem Services within an area. One of these tools is the Outdoor Recreational Value tool (ORVal), which seeks to estimate the number of visits a greenspace might receive and the monetary equivalent of those visits. The ORVal tool estimates the value of a GI through the application of a recreational demand model which places importance on the cost in time of visiting a greenspace, and the quality of the recreational experiences at that greenspace [29]. The quality of recreational experiences is thus considered to be based on an extensive set of variables encompassing greenspace type, size, land cover, designations, points of interests and direct connectivity with other greenspaces. These studies suggest that GI has a generally positive effect on humans and the wildlife, but there is a gap in the literature where a systematic investigation into their effect and the contributing factors towards species richness is understudied at the larger, national scale.
Context and Data
As mentioned earlier, majority of the studies carried out on evaluating the impact of green space focus on a small sample size or a specific type of greenspace. This study will investigate the relationship between the recreational value of greenspace and the number of species they hold across England. England contains an estimated 27,000 public parks, and its National Planning Policy Framework (NPPF) mandates new developments to provide more GI—in the form of safe and accessible areas of greenspace with recreational, cultural and social facilities—as these areas are considered to help mitigate climate change effects and deliver wider benefits for nature [30]. Other areas of nature reserve and conservation areas are also protected from development. Despite that, the amount of green space in urban areas has dropped from 63% to 55% between 2001 and 2018 [31]. To mitigate the loss of sites, maintaining GI of high quality and the capacity to nurture biodiversity is essential. The quality of GI can be measured in a variety of different ways, including the proximity to urban areas and types of land cover, and it is difficult to extract a single attribute as a proxy to describe each GI. The Outdoor Recreational Value (ORVal) tool mentioned earlier is a tool developed by the University of Exeter in collaboration with DEFRA. Its primary purpose is to give an estimate of the quality for people of greenspaces across the United Kingdom both in monetary terms and as an estimated number of visits. At the same time, the tool also models the interactions between the habitats present, whether the site has any legal designations or points of interest, and whether there are any shared boundaries with other greenspaces; and it is these auxiliary data that this study will exploit. Habitat areas in ORVal are derived as a combination of the 25m-grid of the 2007 Land Cover Map (LCM), Ordnance Survey Master Map data, the Priority Habitat Inventory dataset from Natural England [32] and Open Street Map data.
The estimated greenspace visits are taken from the Monitor of Engagement with the Natural Environment (MENE) survey administered by Natural England. The estimated value of each greenspace is calculated through an opportunity cost model of recreational trip choice, whilst taking into account the socio-economic factors. While both values are estimates derived from the respective surveys and cost models, they have been calibrated through empirical studies to improve their accuracy [29]. Species data is taken from the National Biodiversity Network (NBN) which provides access to arguably the most comprehensive set of aggregated biodiversity data from multiple recording schemes across England and Wales. The NBN gateway limits the maximum number of downloads to 500,000 records per species and 10 million in total. To comply with these limits, the number of species included in this study was limited to amphibians, birds, butterflies, mammals (including bats) and reptiles listed in section 41 of the Natural Environment and Rural Communities (NERC) Act 2006; namely, those of principal importance for the purpose of conserving biodiversity and are considered most likely to be accurately recorded across the whole of England. Species groups such as beetles, moths and freshwater fish were excluded due to the lack of reliability in the measurement of their recording and/or because of their irrelevance to the terrestrial habitats under study. Some species listed in section 41 are deemed sensitive, and to avoid reporting the specific locations of these species, the NBN gateway provides the location at a reduced geographical resolution. The exact location of these species records is stored internally and only available to individuals having enhanced access, with the data provided on the public interface being generalised to a lower resolution of 1km grid. To align all analyses, location data of the species records was renumerated to 1km grids. Further data processing and cleaning were conducted on QGIS platform and with R-Studio software. The ORVal website provides a GIS shapefile detailing the boundaries of the greenspaces. Greenspace types that may not be open to the public (e.g. golf course) were removed from the data set. This left 22,698 greenspaces in the analysis. Table 1 shows the number of each greenspace type after the data processing.
Table 1: Number of each greenspace type
| Greenspace Type |
Number of features |
| Common |
1283 |
| Country Park |
413 |
| Doorstep Green |
103 |
| Forestry Commission Woods |
193 |
| Garden |
331 |
| Millenium Green |
81 |
| Nature |
2844 |
| Park |
9633 |
| Village Green |
669 |
| Wood |
7166 |
Species records were plotted as points, and the points falling within each 1km grid square of England were aggregated to the respective grid so that the total number of records within each grid square was classified by the species’ groups. Additionally, the presence of each species was calculated within the grid squares; i.e. for each species group, the presence of species within that group was counted to give the number of unique species. The number of species records in each group is shown below (Table 2).
Table 2: Number of records for each species group
| Species group |
Number of records |
| Amphibians |
98,453 |
| Bats |
77,756 |
| Birds |
2,208,575 |
| Butterflies |
687,150 |
| Mammal |
430,380 |
| Reptiles |
136,514 |
While different species and attribute data exhibited different patterns of distribution, a log(Y+1) transformation offered an overall best fit to bring each distribution closer to normal distribution and was therefore performed for all variables.
Analysis
The independent variables were identified through the literature as having potential correlations to species richness were plotted in scatter graphs (Figure 1). To understand the contributing factors for the biodiversity (unique number of species), this study conducted OLS regression. In other words, the OLS regression was used to determine which variables were significant in explaining the sum of unique species. Figure 2 shows the association between these variables and the number of species within greenspace. As a result, the following variables were used in the OLS regression model as the independent variables: area, wood, natural grass, managed grass, parking, urban percentage, rivers and canals, and the number of habitats. All variables were analysed using the transformed log(Y+1) data.
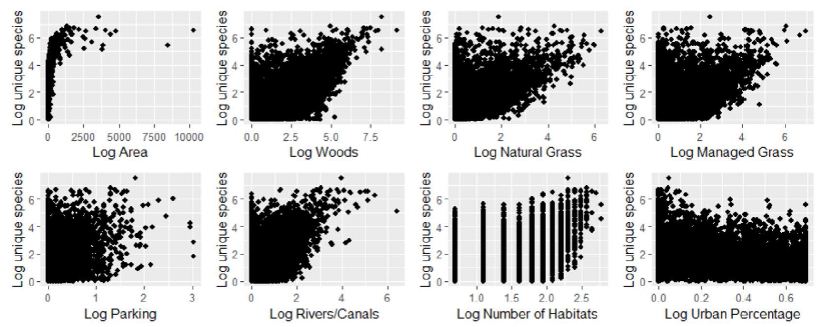
Figure 1: Scatterplots of the log of unique species against variables used in OLS regression
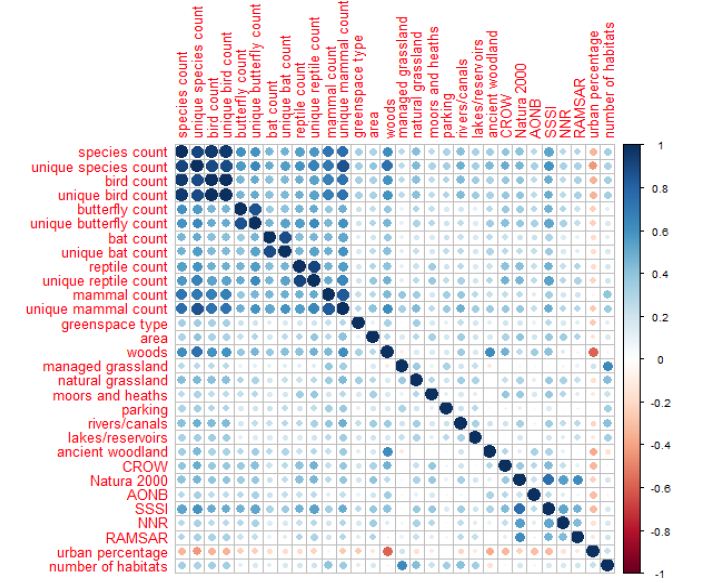
Figure 2: Variables affecting the number of species within greenspace
Figure 1 shows the scatterplots of the variables used in the OLS regression model against the unique species number. Whilst there is strong positive correlation between some variables, most have weak positive correlation even after transformation. The outputs of the scatterplots suggest that the analysis would be best achieved with non-parametric tests. However, due to the number of records used in the analysis, applying non-parametric tests to the entire dataset holds the risk of returning inaccurate results [33,34].
To explore the spatial concentration of these variables, the Local Indicator of Spatial Autocorrelation (LISA) was calculated in the form of local Moran’s I for each variable in the OLS regression (Figure 3). The maps clearly show that “area” size has very few hotspots or coldspots, with smaller low-low area clusters being generally around urban areas and larger high-high area clusters being generally clustered in rural areas. A large proportion of the greenspaces have no significant clustering of area, except for woodlands which show a clear contrast between the hotspots (or the areas with high concentration of woodlands surrounded by similarly high proportion of woodlands) and the remaining regions. In particular, counties with higher percentages of woodland area such as Surrey appear to be well represented in hotspot clusters in the woodland variable, with counties having typically lower woodland cover such as Suffolk and Somerset showing up as coldspots. There are areas such as Cornwall and the Lake District which have low overall woodland coverage but are both shown as having hotspot clusters, suggesting that in these counties the woodlands which are present occur in close proximity to each other rather than being dispersed across the wider county. Managed grassland habitat areas tend to be larger in urban areas whilst natural grassland habitat areas tend to be larger in rural greenspaces. Parking is again fairly sparse with large areas of no significant clustering. Whilst there appear to be some hotspots for parking in urban areas and some coldspots in rural areas, this does not hold true across the country.
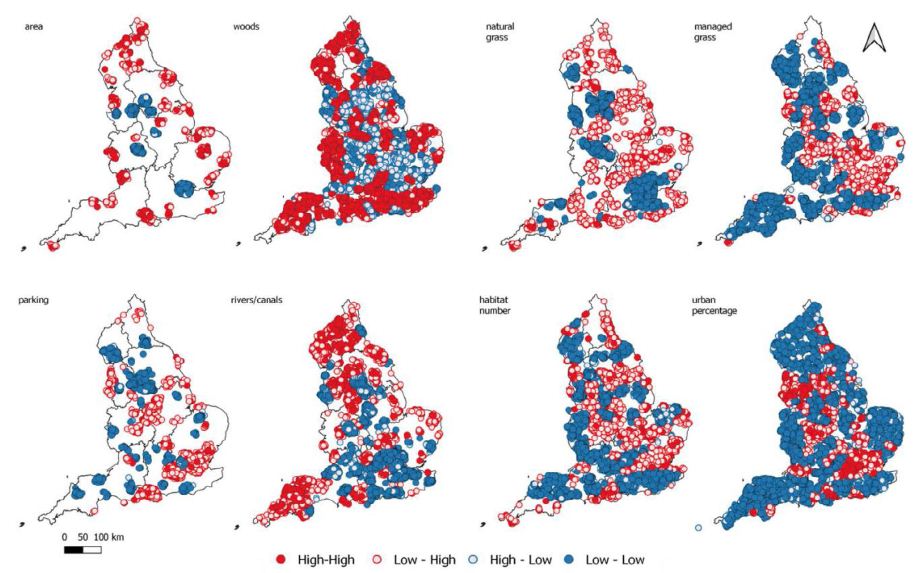
Figure 3: Local Moran’s I clusters for each log variable: area; woodland; natural grassland; managed grassland; parking; rivers and canals; number of habitats; and urban percentage.
Rivers and canals have large significant hotspots in north-west and south-west with coldspots mainly concentrated in the south and south-east. The total number of habitats shows significant hotspots mainly in urban areas, however as man-made habitats were included in the calculation for number of habitats, there is perhaps a predisposition to urban areas with significant coldspots occurring in rural areas in a similar pattern to the managed grassland variable. The urban percentage clusters appear generally as expected, although there are comparatively few high-high clusters in urban areas. Table 3 shows the results for the OLS regression of unique species counts. It illustrates the highly significant relationship for all variables with a low standard error (≤0.5162). The variables explained 76 % of the variance of the species richness. Analysis of the t-values shows that woodland area has the strongest positive relationship with unique species number, and rivers and canals showing the weakest relationship if still significant. Urban percentage was shown to have a weak negative relationship.
Table 3: Results of OLS regression
| Variable |
Estimate |
Std error |
T Value |
Pr(>|t|) |
|
| (Intercept) |
-2.81E-01 |
1.50E-02 |
-18.7 |
<2e-16 |
*** |
| Area |
6.33E-04 |
2.86E-05 |
22.14 |
<2e-16 |
*** |
| Woods |
5.16E-01 |
3.42E-03 |
150.83 |
<2e-16 |
*** |
| Natural Grass |
3.01E-01 |
7.05E-03 |
42.75 |
<2e-16 |
*** |
| Managed Grass |
1.94E-01 |
5.97E-03 |
32.45 |
<2e-16 |
*** |
| Parking |
4.07E-01 |
2.07E-02 |
19.71 |
<2e-16 |
*** |
| Rivers/canals |
9,49E-02 |
8.48E-03 |
11.19 |
<2e-16 |
*** |
| Number of Habitats |
3.92E-01 |
1.28E-02 |
30.68 |
<2e-16 |
*** |
| Urban Percentage |
-2.02E-01 |
1.49E-02 |
-13.69 |
<2e-16 |
*** |
To examine the relationship between greenspace type and species richness, a boxplot was produced (Figure 4). It highlights the difference in the number of unique species in each type of greenspace with Forestry Commission Woods and Country Parks having the highest species richness, whilst Doorstep Green and Village Green showing the lowest number of species. Woods and Nature had large variations in species richness, partly due to the frequent outliers present for these categories. An ANOVA test returned a significant result for the variation, where the sum of squares = 3184 and p = < 2.2e-16 with 1 DF.
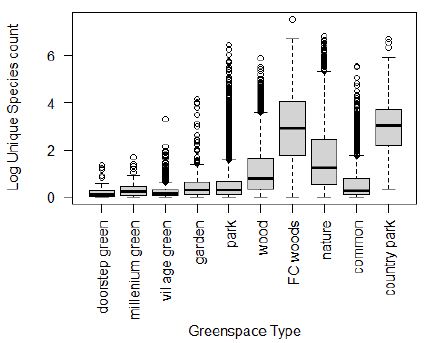
Figure 4: Boxplot of log +1 unique species count and greenspace type
Further analysis of the means for the lowest and highest groupings are shown in Figure 5. Unsurprisingly, both country parks and forestry commission woods have higher areas of woodland cover than doorstep green does, although country parks also have more managed grassland. Parking, built habitats, and rivers and canals were also higher in country parks than the other greenspace types investigated. Whilst it was not plotted on the graph due to the large variation in size even at a log scale and the resultant skewing of the y-axis, Forestry Commission Woods were on average approximately 140 times larger than Doorstep Greens, and average area of Country Parks were approximately 50 times larger than Doorstep Greens.
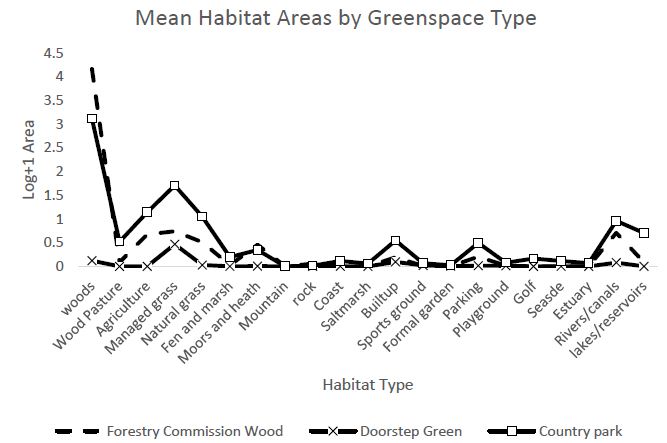
Figure 5: Mean habitat areas by greenspace type
Discussion
Figure 3 showed that the contributing factors towards high species count (hence, high biodiversity) tend to be spatially aggregated into known species diversity hotspots such as the New Forest and Jurassic Coast, Ainsdale NNR, the Cambridge fens and the Norfolk and Suffolk coasts. The presence of hotspots mainly outside of urban area validates the use of the total unique species to determine species richness rather than using species abundance. The presence of coldspot clusters also confirms results consistent with findings from previous studies whereby species richness decreases with increasing urbanicity [25,26]. The decision to aggregate species counts by 1km2 may have affected the clustering, and a smaller grid could have given a more detailed picture of the species distributions. The large blocks of hotspots and coldspots may have been an artefact of the large data set, and analysis using smaller grid units may have resulted in more nuanced distribution of clusters.
The locations of the high-high clusters suggest that the best greenspaces for both people and wildlife mainly occur on the edges of suburbs around large urban centres, or in larger urban parks, although this may again simply be highlighting an issue with the extraction method for the species data. Analysis of the variables which make up each of the cluster grouping suggests that those greenspaces which are composed of woodlands with managed grassland are more likely to benefit wildlife. However, clusters of high species-low value greenspaces had a high mean woodland area, without a high mean managed grassland area. The large impact of woodlands on high biodiversity may also be an artefact of the species data which was used. Bird records accounted for more than 60% of the records and studies investigating the effects of landcover on bird diversity have reported a strong relationship between species richness and woodland cover [22,35]. The results of the OLS models confirm that the woodland area of a greenspace is the most important factor when predicting the number of unique species present within that greenspace. This finding reiterates the suggestion above that the heavy skew towards bird records within the original species data, and the strong relationship between bird biodiversity and woodland area, may be over-emphasising the relationship.
Further analysis of the grouped species data would be necessary to identify if the same trends are found in other species groups. The relatively low result for area in the regression model was surprising, with the estimate being ranked 5th out of the 8 variables modelled. This may be due in part to the negative multicollinearity with both natural grassland and rivers and canals. It may also be that since there are many factors that could affect each species differently, if the species groups were modelled separately then the size of each greenspace may have shown more significance in explaining species richness for generally lower mobility groups such as butterflies. The relatively high effect of parking suggests that even though attempts were made to reduce recorder bias, bias may still exist within the data as it gives the impression that an increase in parking area resulted in higher unique species counts. The variance in species richness caused by these variables is unlikely to be geographical in origin, as the geographic variation cannot be discerned at this spatial scale. The exceptions are the managed grassland and natural grassland variables, both of which broadly follow the respective distributions. A potential alternative method would have been to geographically subset the data in order to provide the local Moran’s I for each area. Also, splitting the data down into distinct geographical regions such as the south-east, south-west and so on may have provided a method to investigate how the variables behave with an adaptive bandwidth. Indeed, the effect of greenspace type on biodiversity appears to reflect their size and ruralness. Both country parks and forestry commission woods tend to be large areas of greenspace, which may explain the positive relationship between these and the number of unique species. Country parks have a set criterion for designation including a minimum area, facilities and accessibility whilst being a predominantly semi-natural landscape. Country parks should be over 10ha in size and as an increase in area typically results in an increase in the number of habitat types and thus available habitat niches, as well as reducing population isolation and disturbance [36]. As Forestry Commission Woods are the largest supply of sustainably managed timber in the UK, and commercial forestry operations require large amounts of land, Forestry Commission Woodlands are on average the largest greenspace type within the analysis.
Conclusion
This study found that green space outside the urbanised areas has a high level of species diversity than those within urban areas. Variables that contributed to high species richness were area, woodland cover, grassland cover (both managed and natural), rivers and canals, parking, number of habitats and percentage urban cover. Greenspace types with large areas (e.g. country parks and forestry commission woods) corresponded to a higher number of unique species present than those that are usually small in size (e.g. village greens and doorstep greens). Where size is not dictated by greenspace type, such as in the case of woods and commons, these result in a lower average unique species with a large number of outliers being present in the data. Potential avenues for further investigation into this topic include analysis of different species groups and comparing their findings with those from this study; and identifying similar greenspaces with similar recording effort across the country in order to test whether the differences shown in species richness during this study are geographical or an artefact of over- and under-recording. Despite these challenges, this study confirmed that richer biodiversity can be generally only achieved in well preserved and managed woodlands and country parks occupying a sizable plot, and that regular patches of green infrastructure embedded within the urban areas do not offer high species richness. This has policy implications in that, while we can explore the positive effect of having a varying extent and types of green infrastructure within urban areas, we cannot expect high biodiversity in relation to such green infrastructure.
References
- EU (2013) Green Infrastructure (GI) — Enhancing Europe’s Natural Capital.
- Natural England (2009) Green Infrastructure Guidance, York.
- UK Green Building Council (2015) Demystifying Green Infrastructure, London.
- Hunold C (2019) ‘Green Infrastructure and Urban Wildlife: Toward a Politics of Sight’, Humanimalia 11: 89-109.
- Sandifer, P. A., Sutton-Grier, A. E. and Ward, B. P. (2015) Exploring connections among nature, biodiversity, ecosystem services, and human health and well-being: Opportunities to enhance health and biodiversity conservation. Ecosystem Services, Elsevier, 12: 1-15.
- Cameron RWF, Brindley P, Mears M, McEwan K, Ferguson F, et al. (2020) ‘Where the wild things are! Do urban green spaces with greater avian biodiversity promote more positive emotions in humans?’, Urban Ecosystems 23: 301-317.
- Lawton JH (1998) Daily, G. C. (Ed.). 1997. Nature’s services. Societal dependence on natural ecosystems. Island Press, Washington, DC. 392 pp. ISBN 1-55963-475-8 (hbk), 1 55963 476 6 (soft cover).’ Animal Conservation, Cambridge University Press, vol. 01, no. 01, p. S1367943098221123.
- Arntz, W., Strobel, A., Moreira, E., Mark, F., Knust, R., Jacob, U., Brey, T., Barrera-Oro, E. and Mintenbeck K (2012) Impact of climate change on fishes in complex Antarctic ecosystems. Advances in Ecological Research 46: 351-426.
- Forzieri G, Feyen L, Russo S, Vousdoukas M, Alfieri L, et al. (2016) ‘Multi-hazard assessment in Europe under climate change’, Climatic Change 137: 105-119.
- Emilsson T, Sang ÅO (2017) ‘Impacts of Climate Change on Urban Areas and Nature-Based Solutions for Adaptation’, ln: Kabisch N, Korn H, Stadler J, and Bonn A (eds) Nature-Based Solutions to Climate Change Adaptation in Urban Areas: Linkages between Science, Policy and Practice, Cham, Springer International Publishing, pg: 15-27 [Online].
- IPCC Secretariat (2021) Scientific review of the impact of climate change on plant pests – A global challenge to prevent and mitigate plant pest risks in agriculture, forestry and ecosystems., Rome.
- The Royal Society (2021) Climate Chang eand Biodiversity – Interlinkages and Policy Options, London.
- Ulrich RS (1984) View Through a Window May Influence Recovery from Surgery, Science, American Association for the Advancement of Science 224: 420-421.
- Grazuleviciene R, Vencloviene J, Kubilius R, Grizas V, Dedele A, et al. (2015) ‘The Effect of Park and Urban Environments on Coronary Artery Disease Patients: A Randomized Trial’, Castelnuovo, G. (ed), BioMed Research International, Hindawi Publishing Corporation.
- Shanahan DF, Lin BB, Bush R, Gaston KJ, Dean JH, et al. (2015) Toward improved public health outcomes from urban nature. American Journal of Public Health 105: 470-477. [crossref]
- Maas J, Verheij R, de Vries S, Spreeuwenberg P, Schellevis F et al. (2009) ‘Morbidity is related to a green living environment’, Journal of Epidemiology and Community Health 63: 967-973. [crossref]
- Gong, Y., Gallacher, J., Palmer, S. and Fone, D. (2014) Neighbourhood green space, physical function and participation in physical activities among elderly men: The Caerphilly Prospective study. The International Journal of Behavioral Nutrition and Physical Activity 11. [crossref]
- Coutts C, Hahn M (2015) Green Infrastructure, Ecosystem Services, and Human Health. International Journal of Environmental Research and Public Health 12: 9768-9798. [crossref]
- Zhang S, Ramírez F (2019) Assessing and mapping ecosystem services to support urban green infrastructure: The case of Barcelona, Spain. Cities 92.
- Zorzal R, Diniz P, Oliveira R, Duca C (2020) Drivers of avian diversity in urban greenspaces in the Atlantic Forest. Urban Forestry & Urban Greening 59.
- Holtmann L, Philipp Becke, Fartmann T (2017) Effects of habitat and landscape quality on amphibian assemblages of urban stormwater ponds. Urban Ecosystems 20.
- Mörtberg U, Wallentinus HG (2000) Red-listed forest bird species in an urban environment — assessment of green space corridors. Landscape and Urban Planning, Elsevier 50: 215-226.
- Leveau LM, Isla FI (2021) Predicting bird species presence in urban areas with NDVI: An assessment within and between cities’, Urban Forestry & Urban Greening, Urban & Fischer 63.
- Chamberlain DE, Gough S, Vaughan H, Vickery JA, Appleton GF (2007) Determinants of bird species richness in public green spaces. Bird Study, Taylor & Francis 54: 87-97.
- McFrederick QS, LeBuhn G (2006) Are urban parks refuges for bumble bees Bombus spp. (Hymenoptera: Apidae)? Biological Conservation 129: 372-382.
- MacIvor JS, Ksiazek-Mikenas K (2015) Invertebrates on Green Roofs. Pg ; 333–355.
- de Groot M, Flajšman K, Mihelič T, Vilhar U, Simončič P et al. (2021) Green space area and type affect bird communities in a South-eastern European city. Urban Forestry & Urban Greening, 63.
- Rahman Md R, Shi ZH, ad Chongfa C (2014) Assessing regional environmental quality by integrated use of remote sensing, GIS, and spatial multi-criteria evaluation for prioritization of environmental restoration’, Environmental Monitoring and Assessment 186: 6993-7009.
- Day B, Smith G (2017) The ORVal Recreation Demand Model: Extension Project, Exeter.
- Communities and Local Government Committee (2012) The National Planning Policy Framework: Eighth Report, London.
- Public Health England (2020) Improving Access to Greenspace: A new review for 2020, London.
- Day B, Smith G (2016) Outdoor Recreational Valuation (ORVal) Data Set Construction, Exeter.
- Skovlund E, Fenstad G (2001) Should we always choose a nonparametric test when comparing two apparently nonnormal distributions? Journal of Clinical Epidemiology 54: 86-92.
- Fagerland MW (2012) t-tests, non-parametric tests, and large studies—a paradox of statistical practice? BMC Medical Research Methodology 12.
- Jokimäki J (1999) Occurrence of breeding bird species in urban parks: Effects of park structure and broad-scale variables. Urban Ecosystems 3: 21-34.
- Zhao JM, Zhou LZ (2018) Area, isolation, disturbance and age effects on species richness of summer waterbirds in post-mining subsidence lakes, Anhui, China. Avian Research 9.