Introduction
In this paper, the author presents his techniques of applying firstorder perturbation theory of quantum mechanics to predict and build a Postprandial Plasma Glucose (PPG) waveform based on the “perturbation factor” of carbs/sugar intake amount. This is a part of his GH-Method: math-physical medicine research methodology.
Methods
Initially, he applied segmentation pattern analysis to analyze his 1,825 meals with 23,725 PPG Sensor data collected during a period of 5/5/2018- 12/13/2019. Initially, his two segments were based on both “first factor” of meal’s carbs/sugar intake amounts and “second factor” of post-meal walking steps. His low-carb meals occupy about 2/3 of the total meals (1,209 meals with 8.5 grams per meal) and high-carb meals occupy about 1/3 of the total meals (615 meals with 27.1 grams per meal). A standard waveform (curve) contains 13 data points for each PPG curve and one input data for each 15-minute time segment. His post- meal walking steps are comparable (4,238 vs. 4,282 steps). Therefore, he decided to focus on the first factor of carbs/sugar intake amount only.
Next, he applied the first-order perturbation theory of quantum mechanics to continue and extend his glucose prediction research work. The perturbation equation is expressed in the following:
A = ~ ( A0 + ε * A1 )
Where A0 would be the known solution to a simpler but solvable initial problem and A1 represents the first-order term which may be found interactively by some systematic procedure. For small ε (epsilon), this higher-order term in the series becomes successively smaller and derives to an approximate solution.
Since the second factor of post-meal walking steps are almost equal (4,238 vs. 4,282 steps) between the low-carb case and high-carb case, he will only focus on the first factor of carbs/sugar intake amount. The author conducted the two following perturbation analysis cases:
(1) Using a combination of weighted carbs/sugar amount, 14.6 grams, which is equal to (1/3 * high-carbs + 2/3 * low-carbs).
(2) Using an average carbs/sugar amount, 17.8 grams, which is equal to 1/2 * (high-carbs + low-carbs)
He will then be able to construct two new separate PPG waveforms (curves) between 0-minute throughout 180-minutes by applying the perturbation theory.
Finally, he used his collected data to calculate and construct a waveform with a gram of carb following very closely to the perturbed waveform with 17.8 grams of carb.
Results
Figures 1 and 2 display both the data table and waveforms chart of low-carb pattern vs. high-carb pattern. Although their opening glucoses at 0-minute (129mg/dL vs. 131mg/dL) and PPG curve shapes are quite similar (two “mountain” shapes with 58% correlation), their peak glucoses (140mg/dL vs. 156mg/dL) and closing glucoses at 180-minutes (127mg/dL vs. 140mg/dL) have different results. These differences have resulted from varying glucose decaying speeds after 60-minutes, which have deeper biomedical meanings, and are extremely critical to a patient’s risk probabilities of having diabetes complications. The significance of these differences from a segmentation analysis has already been discussed in his previous publications and presentations.
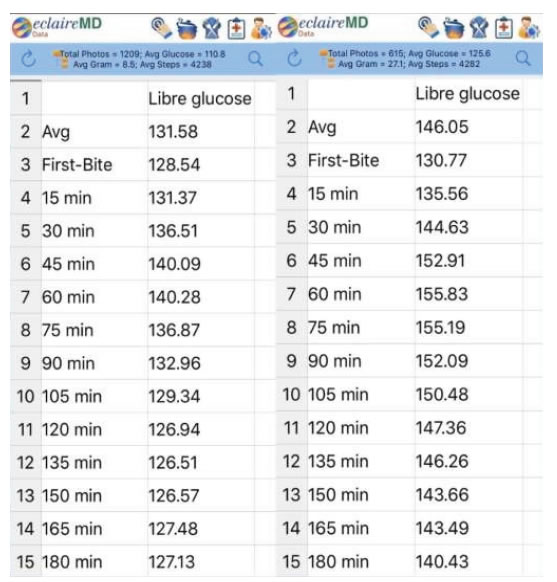
Figure 1. Data table of low-carbs and high-carbs PPG values.
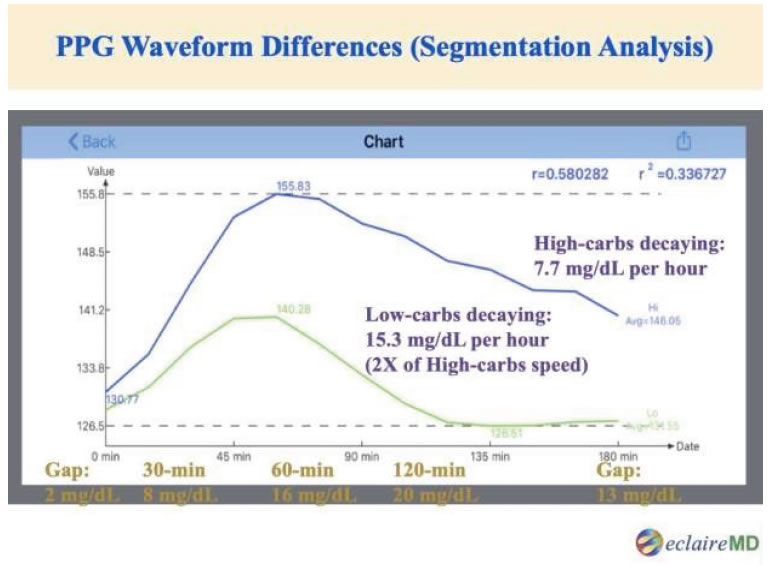
Figure 2. Graphic chart of low-carbs and high-carbs waveforms.
Figures 3 and 4 illustrate both data table and two additional “perturbed waveforms” between low-carbs and high-carbs. It should be noted that the weighted combination PPG curve (14.6g) almost completely matches with the original PPG curve generated with real data. However, the average carb PPG curve (17.8g) is a newly generated waveform by using the perturbed factor, carbs amount, which is similar to those two original curves, low-carbs and high-carbs, but are not the same if you examine them closely. Through application of perturbation theory concept of quantum mechanics, the author could generate a predicted PPG waveform entirely based on the selected “perturbation factor” of 17.8 grams of carbs/sugar intake amount. Of course, this perturbed waveform is only an approximated curve based on the first perturbation factor, carbs/sugar intake amount.
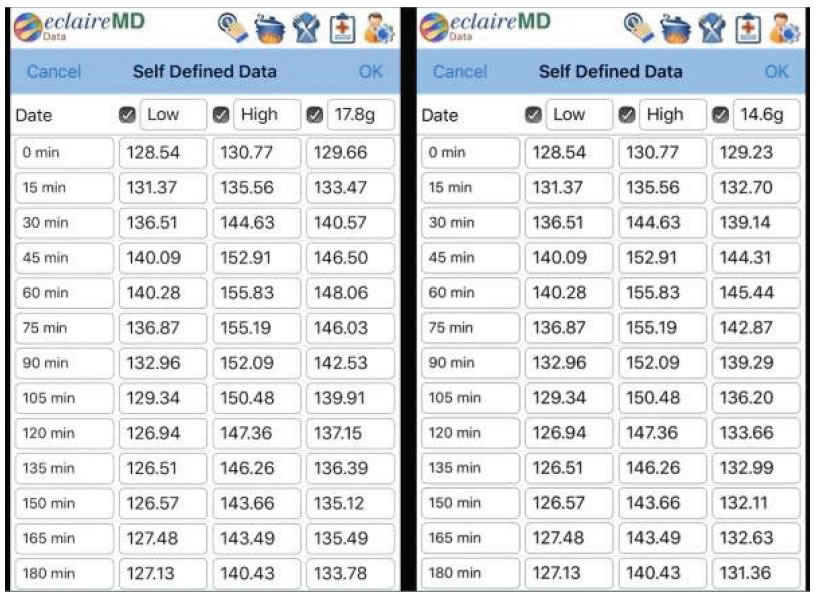
Figure 3. Data table of low-carbs, high-carbs, and two perturbed PPG values.
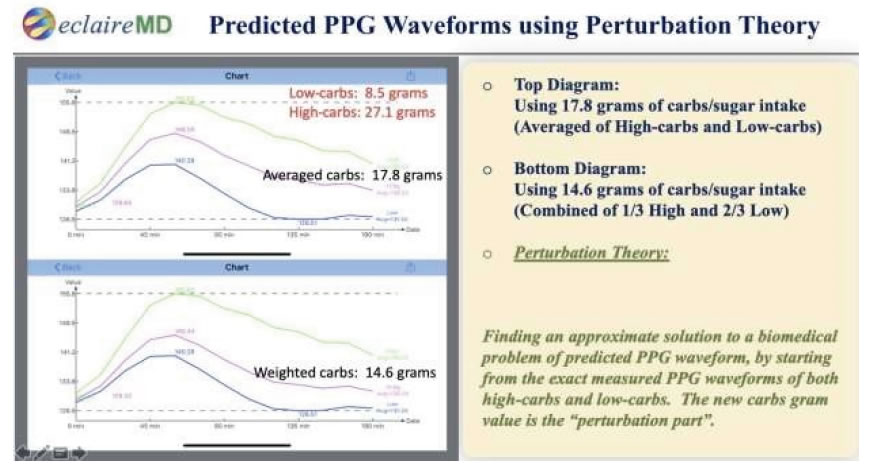
Figure 4. Graphic chart of low-carbs, high-carbs, and two perturbed PPG waveforms.
For clarity of waveform comparison, Figure 5 further demonstrates these two newly generated perturbed waveforms by using two slightly different perturbed carb values.
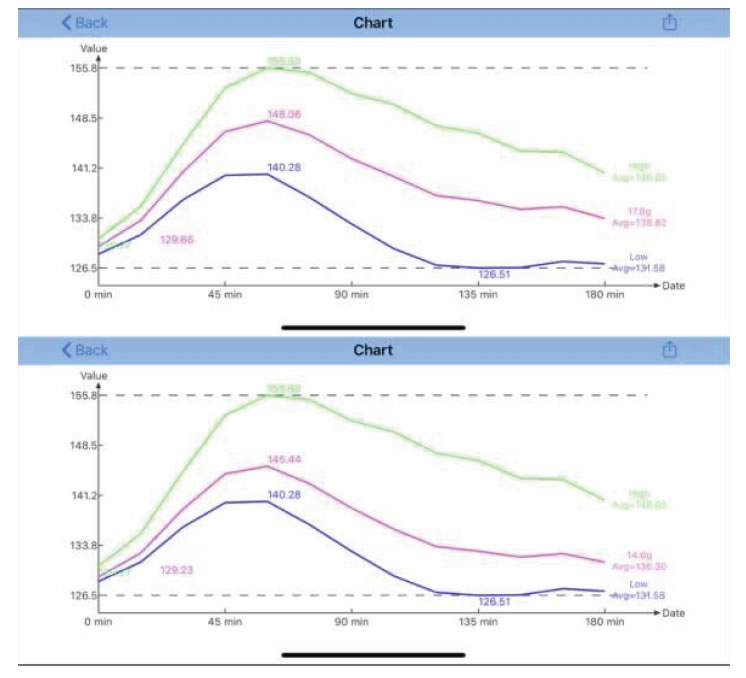
Figure 5. Waveforms comparison.
In Figures 6 and 7, the author selected 84 meals with an averaged carb amount of 18g and constructed a new waveform between 0-180 minutes. This measured PPG waveform with 18g and 138.21mg/dL is compared against the perturbed PPG waveform with 17.8g and 138.81mg/dL to achieve a combined (adjusted) prediction accuracy of 98.4%.
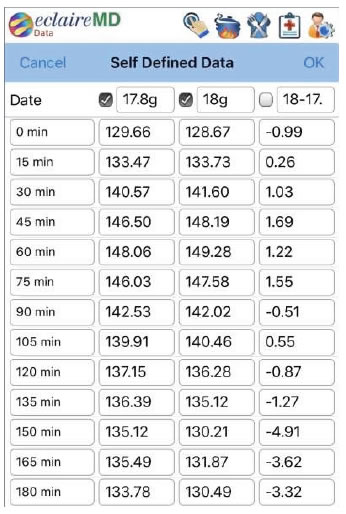
Figure 6. Verification data comparison between measured PPG @ 18g and perturbed PPG @ 17.8g.
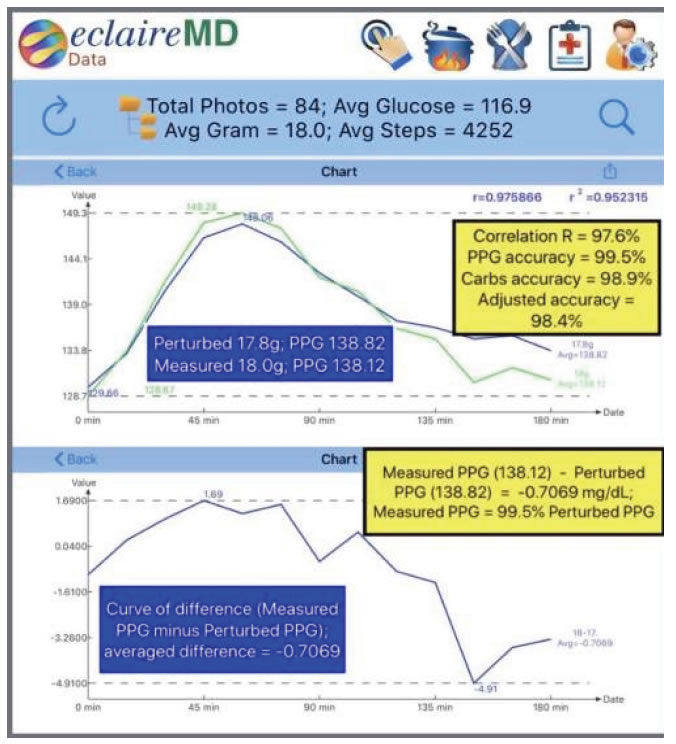
Figure 7. Verification waveform comparison between measured PPG and perturbed PPG plus a 98.4% combined accuracy using perturbation prediction theory.
The deviation amount of PPG is 0.5% and the deviation amount of carbs gram is 1.1% (in an opposite direction). Therefore, the combined deviation is 1.6%, which yields an accuracy rate of 98.6%.
Conclusion
Glucose variance is an extremely complex biochemical and biophysical phenomenon. After a diabetes patient measures and establishes two separate initial waveforms with one low-carb meal and another high-carb meal separately, we can then collect the patient’s PPG data and draw two separate PPG waveforms accordingly. As a result, we can predict the glucose behavior by using the perturbation theory of quantum mechanics to obtain an approximated PPG waveform according to this selected carbs/sugar intake. Of course, the same method can also be applied using the second per nation factor, post-meal waking steps. In this way, a patient will have the ability to predict his/her own PPG behavior before consuming a meal or initiate post-meal exercise.