Introduction
For a long period of time, cesarean sections were primarily performed in situations where they were medically necessary to safeguard the lives of both mothers and infants. However, over the past few decades, the prevalence of this surgical procedure has notably increased. According to the Lancet series on Cesarean section, there were approximately 141 million babies born around the world in 2015 – 29 million of them (21%) were delivered through a Cesarean section [1]. The escalation in cesarean section rates is attributable to a complex interplay of factors, which vary widely between and within countries. The World Health Organization highlights the importance of conducting research to identify and define the specific drivers of rising cesarean section rates in distinct settings. This research should also explore the local factors influencing cesarean births and consider the perspectives and cultural norms of both women and healthcare providers [2].
The proportion of caesarean sections at the population level is a measure of assessing progress in maternal and infant health and in monitoring emergency obstetric care. It is however challenging to determine the optimal or adequate rate of caesarean sections in a country [3].
WHO conducted a systematic review of studies to find this rate, and recommended that no more than 10-15 percent deliveries are justifiable by C section in any population [1,4]. The advice emphasized performing Cesarean sections solely when medically required and refrained from suggesting a specific population-level target rate. This was due to the potential for debate regarding the definition of underuse and overuse rates [5]. Still countries have used certain cut-off levels to show high or low C section rates in any population. Less than 5 percent of C section in any population indicates low antenatal and maternal care and hence account for delivery complications and even maternal mortality [6]. For nearly 30 years, the international healthcare community considered the ideal rate for caesarean sections to be between 10% and 15% based on the World Health Organization recommendation of 1985. However, with the changing demographics of the world population, especially in high- and middle-income countries the 10% to 15% rates don’t seem optimal [7]. Studies have shown that until now there is no evidence of benefit for the health of mothers and babies in populations with values of CS above 15%, regarding the lower limit, it has been argued that CS rates of 5% could achieve major improvement on maternal outcomes. However, for neonatal health, rates between 5% and 10% have been reported to attain better outcomes [5].
Pakistan presents a similar picture and the CS rates have increased from 3.1% to 22.3% in the last two decades [7] with reported rural and urban CS rates as 18% and 32% respectively. Equity analysis showed that women in the highest wealth quintile were more likely to be delivered by CS (46%) compared to women in the lowest quintile (8%). Further, more developed, and urban provinces like Punjab have higher CS rates (29%) than the less developed province like Baluchistan (4%). Private health facilities (38%) report higher CS rates as compared to public health facilities (25%) [8]. The factors contributing to the rise in CS rate are complex and identifying interventions to reduce this rate is challenging. One of the main referred difficulties was the lack of a classification tool that would be feasible to be used internationally, to allow audit feedback and setting an optimal CS rate over countries. Till the end of 2010, there was no standard classification system for caesarean section that would allow the comparison of caesarean section rates across different facilities, cities, countries, or regions in a useful and action-oriented manner. In 2011 the World Health Organization (WHO) conducted a systematic review that identified 27 different systems to classify CS. These classifications looked at “who” (woman-based), “why” (indication-based), “when” (urgency-based), as well as “where”, “how” and “by whom” a CS was performed [1]. This systematic review of system concluded the Robson classification is the most appropriate system to fulfil current international and local needs [5].
Based on the review WHO recommended the “Robson’s Ten Group Classification System” (RTGCS) for comparing CS rates for the purpose of audit and monitoring interventions needed to reduce the Cesarean section rates globally [9]. The classification is simple, robust, reproducible, clinically relevant, and prospective – which means that every woman admitted for delivery can be immediately classified into one of the 10 groups based on the following basic characteristics: parity (nulliparous, multiparous with and without previous caesarean section); onset of labor (spontaneous, induced or pre-labor caesarean section); gestational age (preterm or term); fetal presentation (cephalic, breech or transverse); and number of fetuses (single or multiple). This allows a comparison and analysis of caesarean section rates within and across these groups. Unlike classifications based on indications for CS, the Robson Classification is for “all women” who deliver at a specific setting (e.g., a maternity or a region) and not only for the women who deliver by CS. It is a complete perinatal classification [6].
Robson Classification Data Collection and Implementation
For implementation of Robson group classification in institutions the simplest way is:
i) Collect data on the six variables as shown in Robson Classification Manual(World Health Organization, 2017) [6], from obstetrical history or from case sheet of client.
ii) Classify each woman into one of the 10 groups. This can be done manually or recording the core variables in electronic client record using a software application that automatically assigns the specific Robson group shown in Table 1 based on pre-established formulas.
iii) Data collection then is conducted on the information of mode of delivery, vaginal or Cesarean section. The 10-group classification could be used to create the Robson report Table 1 and assess the C/section rate in each group and then possibly bring about changes in management that may alter the caesarean section rate.
The implementation of this classification is simple and helped healthcare facilities to: Identify and analyze the groups of women which contribute most and least to overall caesarean section rates; Compare practice in these groups of women with other units who have more desirable results and consider changes in practice; Assess the effectiveness of strategies or interventions targeted at optimizing the use of caesarean section; Assess the quality of care and of clinical management practices by analyzing outcomes by groups of women [10].
Despite of WHO’s recommendation that all health care facilities should use the Robson classification system for women admitted to give birth and to monitor the rates of caesarean sections there is little done in this regard. To ensure the adoption of the key recommendations in Pakistan, and to prevent cases of unnecessary caesarean section, there is little published experience on the practical utilization of the WHO Robson classification and no concrete experience reported so far on how to use and implement Robson classification in an action-oriented manner in health facilities.
We conducted a literature review to identify and appraise the studies that included Robson Classification as a system for categorizing and analyzing the data in clinical audits, as interventions to help reduce and optimize CS rates.
Methodology
This review of literature was conducted using two data bases; PubMed, Google Scholar, and grey literature, it was then reported according to recommendations of PRISMA framework.
Types of Studies
Any study that used the Robson classification within clinical audit or as an intervention to reduce or optimize CS rate, were eligible for inclusion. CS rate had to be part as one of the outcomes in each study. We included studies regardless of study design, sample size, duration of study, and type of setting for example, nationwide or facility-based etc.
Type of Participants
Studies presenting the use of the Robson classification in any group of women were eligible for inclusion regardless of obstetric characteristics, level of risk, socio-economic status.
Type of Implementation of the Robson Classification
We considered studies demonstrating the use of the Robson classification including any number of patients, study duration, in a group of women regardless of the women’s obstetric characteristics, level of risk or socio-economic status. Studies using variations of Robson Classification like (splitting or combining groups e.g., 2a, 2b etc.). Only those studies were incorporated which used Robson classification for clinical audit or to assess trends and outcomes (CS rate, group size, group CS rates etc.)
Exclusion Criteria
We excluded studies that were not conducted in Pakistan and did not provide any quantitative data on the effects of the use of Robson Classification in clinical audit or intervention to optimize CS rates. Studies that had unclear definitions or groups categorization were also excluded.
Search Strategy
An electronic search was conducted using two electronic databases; PubMed and Google Scholar for studies published between January 2010 and January 2023. Only studies in English language were included. The electronic search was complemented by screening the references of all articles chosen for full-text evaluation.
Screening, Data Extraction Template
All citations identified from the electronic searches were downloaded into Reference Manager and duplicates were deleted. Relevant citations for full text readings were then selected. The selected articles were then independently read by two reviewers and those fulfilling the aforementioned selection criteria were included in the review. A standardized data extraction template was designed for this review and data was extracted by two reviewers.
Information recorded for each article included: (1) study design; (2) study objectives; (3) place of study, year, setting, type of institution, time duration; (4) number of women or deliveries included; (5) source of data; (6) description of the intervention; (7) CS rates pre and post intervention(s); (8) conclusions according to the author; (9) observations, comments for using the classification system.
WHO recommends the adoption of updated Robson classification including its 10 groups and ensures its implementation at health facility as a tool to facilitate the classification system to monitor and compare CS rates at facility level in a standardized, reliable, consistent, and action-oriented manner.
Table 1: Studies in Pakistan using Robson Classification included in review
|
SN |
Study Site |
Deliveries |
Use of Robson |
| 1 | Abbasi Shaheed Hospital Karachi (ASH-KHI) (Imtiaz, Husain, & Izhar, 2018) [17] |
1960 |
To compare the rate at health facility for 2013 and then in 2016 after simple interventions |
| Abbasi Shaheed Hospital Karachi (ASH-KHI) (Imtiaz, Husain, & Izhar, 2018) [17] |
1560 |
||
| 2 | CMH Abbottabad, (CMH-AB) (Tahir N, 2018) [18] |
2340 |
To see what proportion of CS cases fall into each group, from Sep 2016 to Mar 2017 |
| 3 | Pakistan Institute of Medical Sciences, Islamabad (PIMS-ISB) (Gilani, Mazhar, Zafar, & Mazhar, 2020) [19] |
6155 |
To identify and analyze the groups of women which contribute most and least to overall CS rates, from October,2016, to September 2017 |
| 4 | Pak Emirates Military Hospital Rawalpindi (PEMH, RWP) (Ansari A, 2019) [20] |
7206 |
To assess the effectiveness of strategies. The audit cycle was completed from Jan to June 2017 by identifying the problem areas, and devising & implementing recommendations. A re-audit was conducted after 6 months to analyze the changes from July to Dec 2017 |
| 5 | Khan Research Laboratories (KRL-ISB) (Khan, Sohail, & Habib, 2020) [21] |
964 |
To analyze the trends of cesarean sections from Nov 2017 to April 2018 |
| 6 | Holy Family Hospital – Unit 1, Rawalpindi, (HFH-UI) |
1458 |
To compare rate in ten groups of women with other units and health facilities in 2019 |
| Holy Family Hospital – Unit 1, Rawalpindi, (HFH-U2) |
1521 |
||
| Benazir Bhutto Hospital, Rawalpindi (BBH-RWP) |
1528 |
||
| District Head Quarter, Rawalpindi (DHQ-RWP) (Chaudri, et al., 2019) [22] |
1096 |
||
| 7 | Unit B Mchc, Ath Abbottabad (Afridi SA, 2022) [23] |
352 |
The analysis of unjustified C/S rate is done by Using Robson’s Ten Group Classification system
August 2021-jan 2022 |
| 8 | Lahore General Hospital (Sabir, et al., 2020) [24] |
3660 |
A Retrospective descriptive study is carried out in gynecology unit 2 of Lahore General Hospital Lahore. Records of all patients who delivered in gynecology unit two over a period of one year from 1st January 2021 to 31st December2021 are collected and analyzed. |
| 9 | Hayatabad Medical Complex (Ali, Khattak, Sadaf, Begum, & Kishwar, 2021) [25] |
5611 |
Retrospective study done in the Department of Obstetrics and Gynecology Hayatabad Medical Complex
Hospital Peshawar, a tertiary care hospital, from a period of 1 st January 2019 till 31 st December 2019. |
| 10 | Allama Iqbal Memorial Teaching Hospital, Sialkot (Bano, et al., 2022) [26] |
5787 |
It is a retrospective study conductedatKhawaja Muhammad Safdar Medical College, Allama Iqbal Memorial Teaching Hospital Sialkot,from January 2022 to June 2022 |
| 11 | Jinnah postgraduate medical center Karachi (JPMC) (Majid E, 2022) [27] |
1242 |
To determine the frequency of caesarean section with its indication by grouping according to Modified Robson’s Criteria at JPMC.
1st Jan to 30th June 2018 |
| 12 | MTI, LRH Peshawar (Fatima SS, 2022) [28] |
1679 |
To analyze CS rate in Department of Obstetrics and Gynecology MTI, LRH, Peshawar; according to RTGCS. This will help understand the major contributory groups to the overall CS rate and to formulate strategies to optimize the escalating rates
Jan 2021-Dec 2021
|
| 13 | Hayatabad medical complex Peshawar-Unit B (Akhtar R, 2021) [29] |
1258 |
To determine the caesarean section rate and frequency of different indications of caesarian section (CS) in a tertiary care hospital.
1st January2019 to 31st December2019 |
| 14 | Holy Family Hospital, Karachi, Pakistan. (Abidi SM, 2023) [30] |
1464 |
To identify areas for improvement in obstetric care practices and facilitate the development of strategies to optimize obstetric care and reduce CS rates, thereby improving maternal and neonatal outcomes.
January 1st, 2022, to December 31st, 2022 |
| 15
|
CMH Quetta (Khanum F, 2021) [31] |
714 |
To find out the incidence of C-Section rate and reducing it after auditing by use of Modified Robson Criteria
January 2020-June 2020 |
|
853 |
To find out the incidence of C-Section rate and reducing it after auditing by use of Modified Robson Criteria
August 2020-January 2021 |
||
| 16 | Khyber teaching hospital Peshawar (Afridi F, 2022) [32] |
330 |
To determine the frequency of various groups of patients undergoing C-section in a tertiary care hospital in Peshawar, using WHO Ten Group ROBSON Classification of C section. January-March 2019 |
Results
An electronic search yielded 597 studies using two Databases. After screening of records, 35 studies fulfilled the inclusion criteria and all other studies that were either not conducted in Pakistan or did not use Robson Classification system for clinical audit were excluded. After reading full-texts 16 studies were included in our review. Our review also highlights the limited number of studies published in Pakistan using the RTGCS Figure 1.
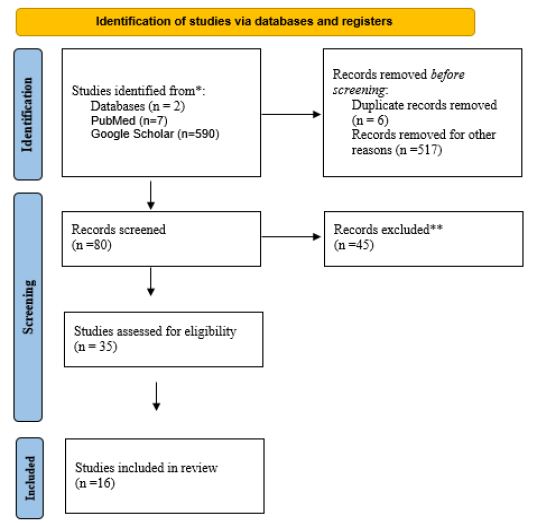
Figure 1: Study Flowchart.
*Reasons for exclusion include duplication, not including Pakistan, not using Robson Classification.
Two-third of the studies included more than 1000 women and were hospital record data. Majority of the studies (2/3rd) were cross sectional study designs while were three studies each used trend analysis and audit. The figure below, Figure 2, shows the studies that are included in the review of C-Section rates in Pakistan. All these studies showed the utility of Robson’s ten group classification system for caesarean section as an auditing tool. Most of the studies were cross-sectional designs and audits, two were a trend-analysis. All the studies are single center/facility studies. It helped in identifying the groups which are contributing to high cesarean rates. Effort then directed towards those groups, strategies devised, and policies and practices modified to help reduce the LSCS rate.
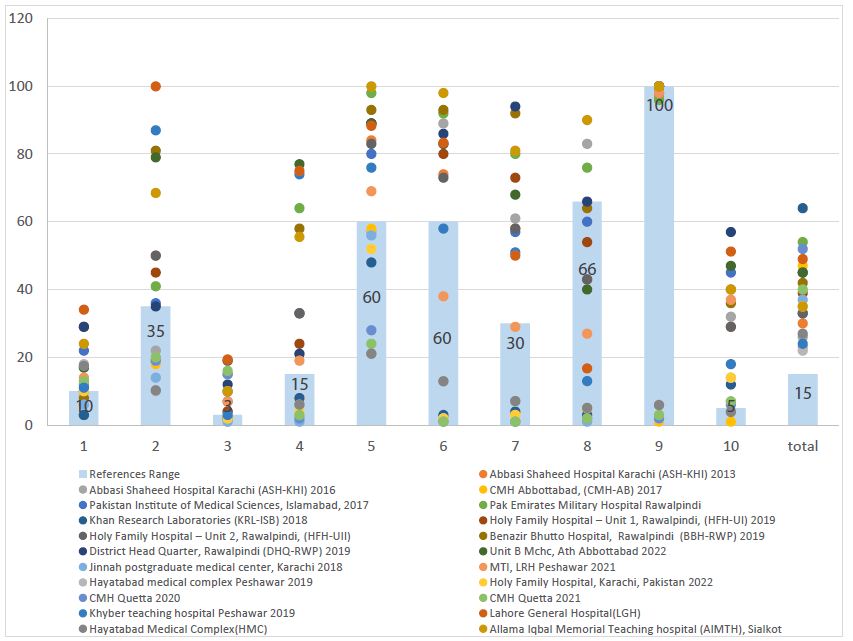
Figure 2: A review of results from various studies on RTGCS in Pakistan
The bars in the above graph represent the upper proportion limit of CS rates in each of the Robson groups (except for groups 6 &7). It was based on the source developed by Michael Robson, based on his international experience since 1990. It was used merely to interpret range of CS rates in Robson report table, rather than recommendations. Each colored dot represents the proportion of Cesarean section reported by each reviewed study. In above mentioned sites, over all primary caesarean delivery rates in group 1, 2, 3 and 4 were higher than the recommended Robson’s guidelines, except in two hospitals for group 1 and group 2 and in one hospital for group 3. In group 5 (had previous one or more sections) all studies reported a very high rate that ranged from 57% to 98%. In all sites almost 75% of women in group 6 and 7 (women with breech presentations) had Cesarean sections. Group 9 (transverse lie) which is recommended to be 100% and shows quality of data and understanding of Robson Classification leading to misclassification of women. CS rates in each group will vary in different hospitals and settings depending on their capacity level of complexity, the epidemiological characteristics of the population served and the local clinical management guidelines, among other factors Figure 3.
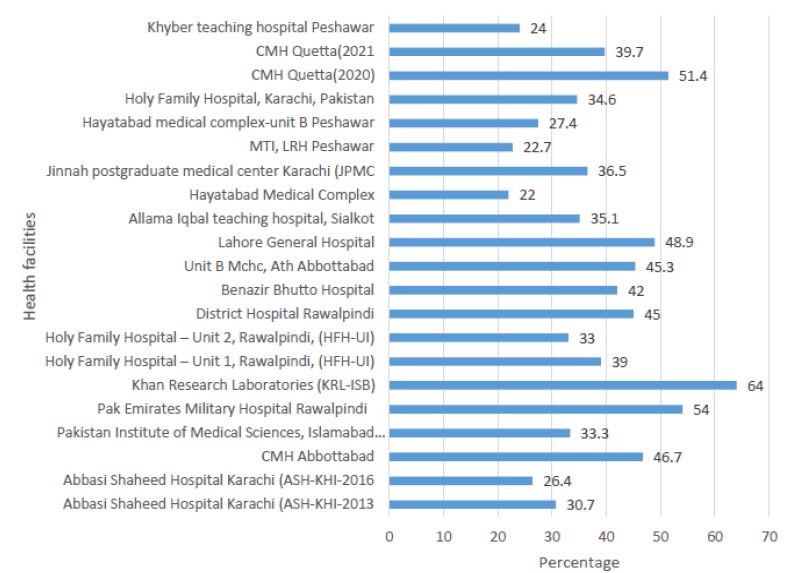
Figure 3: Overall CS rates in each health facility
Results show that the overall C/S rate in all targeted health facilities ranged between 26.4% to 64% which is many points higher than the recommended 5 to 15% CS rate by Robson Guidelines. Studies that were clinical audits showed decrease in overall CS rates, for example, a study in CMH Quetta showed a 12% decrease in overall CS rates and a similar trend was observed in a tertiary care facility in Karachi. We, however, know that c/section rates higher than 10-15% are not associated with reductions in maternal and neonatal mortality rates.
Discussion
This review included 16 studies from Pakistan presenting the experiences of users for adoption, interpretation, and implementation of Robson classification in their health facility. The findings of our review suggests that despite lack of official endorsement from the government of Pakistan, the use of Robosn Classification is increasing rapidly globally and in Pakistan for optimization of CS rates. All the studies in our review include experiences from tertiary care facilities. The Robson classification system classifies every woman who is admitted for delivery into 10 groups to identify and categorize women to understand the underlying factors for the increased CS deliveries, to design interventions according to groups, in turn optimizing the overall CS rates [9].
WHO has proposed health facilities to use the Robson classification system as a gold standard to assess the Cesarean section rates in a country [6]. Despite WHO’s recommendation that all health care facilities should use the Robson classification system for women admitted giving birth, to monitor the rates of caesarean sections there is little done in this regard. To ensure the adoption of the key recommendations in Pakistan, and to prevent cases of unnecessary caesarean section, there is little published experience on the practical utilization of the WHO Robson classification and no concrete experience reported so far on how to use and implement Robson classification in an action-oriented manner in health facilities.
In studies included, over all primary caesarean delivery rates in group 1, 2, 3 and 4 were higher than the recommended Robson’s guidelines, except in two hospitals for group 1 and group 2 and in one hospital for group 3 [11]. The primary caesarean delivery for these groups in targeted health facilities raised a specific concern. In Group 1 and 3 (women admitted in spontaneous labor) primary Cesarean sections can be explained by inappropriate indication to Cesarean section (CTG misinterpretation or suspected fetal distress). An area needing improvement was thus brought to light. High rates in group 1 and 3 for primary caesarean section can be lowered by the presence of senior consultants [12]. Cesarean section rates in groups 2 and 4 (women who had induction of labor or pre labor C/S) were higher in all sites than Robson except at only one site for group 2 . This may be possibly due to poor choice of women to induce or poor success rates for induction or inappropriate indications to Cesarean section in IOL and pre-labor Cesarean section. Absence of consensus on what constitutes a failed induction, the standard inducing agent, duration of induction and improper counselling regarding expectation of the women is a reason quoted for failed inductions [13].
In group 5 (had previous one or more sections) all studies reported a very high rate that ranged between 57% and 98%. It needs to be mentioned that the recommended rate of CS in this group is between 50-60%. The high rate in this group has been a matter of discussion and has attracted a lot of criticism towards the community regarding the promotion of vaginal birth after caesarean section. The vaginal birth after caesarean section (VBAC) is a valid option for women with nonrecurring indications and is safe if a delivery is conducted at a hospital [14].
In all studies almost 75% of women in group 6 and 7 (women with breech presentations) had Cesarean sections. By identifying the high rate in these groups clinical interventions, such as external cephalic version for breech delivery at term, vaginal breech delivery in appropriately selected women could reduce the frequency of CS use.
Variations in group 8 (had multiple pregnancy) depends on the type of twin pregnancy and ratio of nulliparous/multiparous with or without a previous scar. In Group 9 (women with transverse lie) should be 100% as showed in studies. In group 10, the rates had a huge variation and ranged between 6.6% and 56.9%. The recommended rate in this group is 5%, thus a very high rate in this group is seen.
In addition to the studies mentioned above, an intervention study was conducted in Abbasi Shaheed Hospital, Karachi. Two sets of data were collected each in year 2013 and 2016. The CS rates of both years were compared in terms of RTGCS. After the initial audit in 2013, three interventions were implemented, and the audit cycle repeated. The overall C/S rate fell from 30.7% to 26.4% and C/S rate in each group also reduced in three years just by implementing simple measures such as 24-hour senior registrar presence; structured counselling for women with previous caesarean delivery during the antenatal visits regarding vaginal birth after caesarean and review of all women with failed induction by a senior obstetrician [15].
In this context, WHO conducted a systematic review in 2014 which included 73 studies from 31 countries that reported on the use of Robson Classification between 2000-2013 [16]. The review assessed the challenges faced by countries in the adoption, implementation and interpretation of the Robson’s classification and identified various barriers and facilitators of its adaptation and implementation. The main strengths of this classification reported are its simplicity, robustness, reliability, and flexibility. An inherent advantage of the classification is that it allows self-validation since some groups can act as controls. For instance, group 9 (women with a fetus in a transverse or oblique lie) is expected to represent less than 1% of all women admitted for delivery and to have a CS rate of close to 100%. The resources, software and variables needed to implement the classification are considered minimal, making it suitable for low resource settings. In addition, ‘‘not requiring indications for CS’’ is an advantage because of the variability and potential subjectivity when using indications to classify CS, and because these are insufficiently registered in some settings. Some of the limitations included focus of more than two third of these studies in developed regions (Europe, North America, and Oceania). The classification also does not consider other maternal and fetal factors that significantly influence the rate of CS (e.g., maternal age, pre-existing conditions such as BMI or complications) and therefore additional statistical methods (e.g., adjusting) are necessary to account for these factors.
These multiple global reviews suggest that the basic Robson classification identifies the contributors to the CS rate but does not provide insight into the reasons (indications) or explanations for the differences observed. Several suggested modifications could be useful to help facilities and countries as they work towards its implementation. If used on a continuous basis, some studies suggest that this classification system can provide critical assessment of care at delivery and be used to change.
The RTGCS can also be used to monitor and compare caesarean section rates within provinces, states as well as assess the progress within selected health care facilities over time. However, there is a constant debate about the usefulness of the Robson’s CD rates especially because it is difficult to conclude that much progress has been made or consensus on its effectiveness.
Conclusion
To conclude all studies reviewed showed exceptionally high rates of Cesarean sections, overall as well as across all different groups. However, it is important to realize that all these studies were conducted in tertiary care hospitals, receiving referral of high-risk obstetric population.
References
- Wiklund I, Malata A, Cheung N, Cadee F (2018) Appropriate use of caesarean section globally requires a different approach. Lancet 392: 1288-1289. [crossref]
- Wagman H (1993) Caesarean section rates. Lancet 342: 1490.
- Betrán AP, Ye J, Moller AB, Zhang J, Gülmezoglu AM, et al. (2016) The increasing trend in caesarean section rates: Global, regional and national estimates: 1990-2014. . PLoS One 11: 1-12. [crossref]
- Belizán JM, Minckas N, McClure EM, Saleem S, Moore JL, et al. (2018) An approach to identify a minimum and rational proportion of caesarean sections in resource-poor settings: a global network study. Lancet Glob Heal 6: e894-e901. [crossref]
- Torloni MR, Betran AP, Souza JP, Widmer M, Allen T, et al. (2011) Classifications for Cesarean Section: A Systematic Review. PLoS One 6. [crossref]
- World Health Organization. (2017). Robson Classification: Implementation Manual.
- Mumtaz S, Bahk J, Khang YH (2017) Rising trends and inequalities in cesarean section rates in Pakistan: Evidence from Pakistan Demographic and Health Surveys, 1990-2013. PLoS One 12: 1-14. [crossref]
- NIPS (2017) Pakistan Demographic Heath Survey 2017-18. Retrieved from http://nips.org.pk/abstract_files/PDHS 2017-18 – key findings.pdf
- Robson M (2001) Classification of caesarean sections. Fetal and Maternal Medicine Review 12: 23-39.
- Abubeker FA, Gashawbeza B, Gebre TM, Wondafrash M, Teklu AM, et al. (2020) Analysis of cesarean section rates using Robson ten group classification system in a tertiary teaching hospital, Addis Ababa, Ethiopia: a cross-sectional study. BMC Pregnancy 20: 1-7. [crossref]
- Boatin AA, Cullinane F, Torloni MR, Betrán AP (2018) Audit and feedback using the Robson classification to reduce caesarean section rates: a systematic review. BJOG An Int J Obstet Gynaecol 125: 36-42. [crossref]
- Lewis EA, Barr C, Thomas K (2011) The mode of delivery in women taken to theatre at full dilatation: Does consultant presence make a difference? J Obstet Gynaecol (Lahore) 31: 229-231. [crossref]
- Talaulikar VS, Arulkumaran S (2011) Failed induction of labor: strategies to improve the success rates. Obstetrical & gynecological survey 66: 717-728. [crossref]
- Senturk MB, Cakmak Y, Atac H, Budak MS (2015) Factors associated with successful vaginal birth after cesarean section and outcomes in rural area of Anatolia. Int J Womens Health 7: 693-697. [crossref]
- Parveen R, Khakwani M, Naz A, Bhatti R, (2021) Analysis of Cesarean Sections using Robson’s Ten Group Classification System. Pakistan Journal of Medical Sciences 37: 567. [crossref]
- Vogel JP, Betrán AP, Vindevoghel N, Souza JP, Torloni MR, et al. (2015) Use of the robson classification to assess caesarean section trends in 21 countries: A secondary analysis of two WHO multicountry surveys. Lancet Glob Heal 3: e260-e270. [crossref]
- Imtiaz R, Husain S, Izhar R (2018) Adoption of Robson’s Ten Group Classification. Annals Abbasi Shaheed Hospital & Karachi Medical & Dental College 23: 191.
- Tahir NAM (2018) Caesarian Sections: Frequency and Indications at Peripheral Tertiary Care Hospital. Pak Armed Forces Med J 68: 273-279.
- Gilani S, Mazhar S, Zafar M, Mazhar T (2020) The modified Robson criteria for caesarean section audit at mother and child health center Pakistan Institute of Medical Sciences Islamabad. J Pak Med Assoc 70: 200-303. [crossref]
- Ansari A, Baqai S, Imran R (2019) An audit of caesarean section rate using modified Robson criteria at a tertiary care hospital. J Coll Physicians Surg Pak 29: 768-770. [crossref]
- Khan MA, Sohail I, Habib M (2020) Auditing the cesarean section rate by Robson’s ten group classification system at Tertiary Care Hospital. The Professional Medical Journal 27: 700-706. [crossref]
- Chaudri R, Hanif K, Bilqis H, Reza T, Uzma Q, et al. (2019) Analysis of Caesearian section rates using the Robson’s ten group classification at tertiary level facility in Rawalpindi Pakistan: A cross-sectional study. Unpublished.
- Afridi SAAK (2022) Analysis of Caesarean Sections Rates Using Robson’s Ten Group Classification System, Unit B Mchc, Ath Abbottabad. J Ayub Med Coll Abbottabad 34: 537-539.
- Sabir S, Baig F, Safdar Z, Zeb S, Tariq F, et al. (2020) Rising Cesarean Section Rate, Need to Revisit Cesarean Section Indications. Pakistan Journal of Medical and Health Sciences 16: 687-690.
- Ali S, Khattak S, Sadaf R, Begum S, Kishwar N (2021) Caesarean Section Rate and Frequencies of Indications using Robson’s Ten Classifications. Journal of Gandhara Medical and Dental Sciences 8: 43-47.
- Bano N, Tufail N, Ali S, Salman N, Ghafoor N, et al. (2022) Robson Ten Group Classification System and Fetal Distress as the Indication for Caesarean Section. Pakistan Journal of Medical and Health Sciences 16: 822-824.
- Majid E, Kulsoom S, Fatima S, Zuberi BF (2022) To evaluate the rising caesarean section rate and factors contributing to it by using modified Robson’s Crtiteria at a tertiary care hospital. Pak J Med Sci 38: 2021-2025. [crossref]
- Fatima SS,ZL (2022) Analysis of Caesarean Section Rate According to Robson Classification Criteria: A Cross Sectional Study in a Tertiary Care Hospital. Ajhmn 7: 18-27.
- Akhtar RSG (2021) Analysis of Caesarean Section Rates in a Tertiary Care Hospital through Robson’s Ten Group Classification System (RTGCS). Adv Basic Med Sci 5: 11-14.
- Abidi SM, AS (2023) Application of the Robson classification in assessing cesarean section rates: An audit of a tertiary care hospital’s gynecology department in Karachi, Pakistan. MedRxiv
- Khanum F, AU (2021) Use of Modified Robson Criteria for an audit of Caesarean Section at a Tertiary Care Hospital. Pakistan Journal of Medical and Health Sciences 15: 3627-3629.
- Afridi F, ZA (2022) Determining the Indications of C Section Based on who Robson Classification-an Experience in a Tertiary Care Hospital In Peshawar. Journal of Medical Sciences 30.