Abstract
To understand how an area changed over time, change detection analysis using multi-decadal satellite remote sensing data can be quite useful. Out study here uses 30m Landsat data acquired at 30 years apart from 1987 to 2016 collected during the same time of the year (December) to understand the landscape dynamics in the Chilika Lake and neighbouring areas. ISODATA unsupervised classification technique is applied in ArcGIS 10.4.1 for our analysis. The Landsat images of our study area were categorized into bare ground, grass, shrubs, forests and surface water cover types. Our analysis showed that during the last thirty years, bare ground, grass and surface water cover decreased by 139 sqkm, 115 sqkm and 139 sqkm respectively while shrub and forest cover types increased by 180 sqkm and 217 sqkm respectively. The results from our study provides a baseline understanding of the changes happening in this key coastal ecosystem during the last three decades and thus provides information towards developing understanding of long-term coastal ecosystem change in the study area.
Keywords
Decadal Change, Change Detection, Ecosystem Change, Coastal Ecosystems, Landsat
Introduction
Land use and land-cover (LULC) change is in the mainstream of studying Global Change impacts. Land use and land cover are two separate terminologies often used interchangeably [1]. The changes in the physical characteristics of the earth’s surface e.g. deforestation, afforestation, distribution of water bodies, soil and types of vegetation as well as anthropogenic changes such as proliferation of manmade structures are captured in the term land use. The land use and land cover changes of a region is characteristic of the human use of the land and can also be representative of the economic activities. The patterns of these changes are normally a combination of natural and socio-economic drivers over time. Therefore, developing an understanding of the land use and land-cover changes of a region is important to develop management schemes to meet increasing stresses on the natural resources of a region.
Over the years, Land-change science established itself as the foundational ground for studying global environment change and overall sustainability of an ecosystem [2]. This field helps to better understand the human and environment dynamics leading to changes land uses and land covers. This takes care of the change happening in terms of their type, magnitude and location as well. This requires the integration of social, natural, and geographical information sciences. LULC is considered as one of the major concerns in global environmental change and hence overall sustainability of an ecosystem. The LULC driven by rapid urbanization and increasing economic activities put a lot of pressure on natural resources. This is especially true for a rapidly developing country such as India. The environmental degradation associated with LULC change has shown to impact various ecosystem good and services. Various studies have demonstrated that conversion of various land cover types to agriculture and urban landscapes have negative impacts on nutrient cycling, erosion control and climate regulation and water availability and soil fertility [3–7]. The direct consequences of these changes degrade various ecosystem goods and services provided to the human beings through various ecosystem functions. Thus it is important to understand the consequences of the LULC change and hence the overall impact it can have on a whole ecosystem using satellite based measurements over decades.
Remote sensing and GIS has taken a significant role in developing the LULC change science [8–10]. While remote sensing has made possible to study the changes of large areas with precision and over decade’s time-scale, GIS provided a platform for data analysis and updating of mapping products. With emergence of high resolution and long-term satellite programs such as Landsat combined with advanced GIS software, the LULC science has been able to provide routine services for monitoring and modelling of land use / cover patterns. The Landsat series of satellite data archive since 70s has provided one of the strongest resources for LULC science. The freely made available Landsat archive represents a huge information source for studying the changes and developing monitoring capabilities in our manmade and physical environments [11].
Coastal ecosystems are key ecosystems considering their importance in providing goods and services. In addition to the aesthetic and recreational value provided by the coastal ecosystems, economic benefits provided by them in supporting human livelihood via food and materials, nutrient cycling, waste processing and other essential goods and services are quite important. Millennium Ecosystem report of 2005 identifies coastal ecosystems as one of the most productive yet highly vulnerable ecosystems of the world. Coastal areas are vulnerable to climate change impacts due to factors such as: sea level rise, changes in storm surge and precipitation, increased coastal water temperature and ocean acidification. Additionally, factors such as increasing human habitats and technological advances also put additional pressures on coastal ecosystems and thus contribute to the exploitation of coastal resources. In recent times, there are evidences of dramatic declines in various types of coastal ecosystems such as coral reef, mangroves, estuaries, marshes, dunes, deltas, seagrass beds and kelp forests. In this study, an attempt has been made to develop a baseline understanding of changes happening in the Chilika and its neighbouring areas using long-term satellite data records.
Study Area
Our Study area is Chilika Lagoon and its neighbouring areas. Chilika Lagoon is the largest brackish water wetland of India and a Ramsar site. The highly productive eco-system, and its rich fishery resources provides livelihood for more than 0.2 million people who live in and around the lagoon. The lagoon was encountering serious ecological as well as anthropogenic problems leading to change in its ecological characters for which it was included in the Montreux record in 1993 by Ramsar Bureau. This serious threat to the lagoon eco-system had also adversely affected the biodiversity and livelihood of local communities. To restore this unique ecosystem the Government of Orissa created Chilika Development Authority. Rising to the occasion Chilika Development Authority initiated the restoration of the lagoon with ecosystem approach and active community participation. Our interest in the particular area is mainly due its dynamic ecological nature as a coastal area which also provides essential goods and services for a sizeable population and thus providing services for regional economy.
Methods
Two cloud-free Landsat scenes at 30m spatial resolution were selected in December, 1987 (Landsat-TM) and December, 2016 (Landsat-8) for the land use / cover analysis. The data was downloaded from the USGS Earthexplorer site (https://earthexplorer.usgs.gov). The datasets were pre-processed in open source software QGIS using Semi-Automatic Classification Plugin for QGIS (Ref). First, the raw DN data for individual bands were converted to radiance values and TOA reflectance. Then the TOA reflectance was converted to surface reflectance using the DOS1 correction. An area of interest (AOI) was created for the Chilika Lake and the adjoining areas and both the scenes were subset to the AOI. Following this, NDVI values were calculated using NIR and Red bands for respective sensors for both the dates. The Landsat data provided by USGS are already georegistered and orthorectified and hence these steps were not performed. As we calculated NDVI i.e. a standard spectral index, inter-sensor calibration was also not needed.
For our classification, we wanted to have a simple classification scheme for a few classes to have an understanding of how the landscape changed over three decades. Iso Cluster Unsupervised Classification analysis of the Spatial Analyst Extension in ESRI ArcGIS 10.4.1 software was used to classify the two NDVI images into five classes each. The number of classes that we wanted to have for our study was determined based on our estimation of broad land-use classes for the area after reviewing the NRSC LULC map. The Iso Cluster Unsupervised Classification analysis combines the functionalities of the Iso Cluster and Maximum Likelihood Classification tools and outputs to a classified raster. The algorithm automatically finds the clusters in an image and outputs a classified image and an optional signature file. We identified our broad classes as Bare ground, Grass, Shrub, Forrest and Water.
To perform change detection analysis for land use / cover change in the study area, a post classification detection analysis was employed. First a pixel-based comparison was used to identify change information for each of the classes and thus interpret changes using “-from, -to” information from 1987 to 2016. Then each of the raster images for each of the classes were converted to vector files and total areas for each of the classes was calculated for each of the years i.e. 1987 and 2016. This information was used to calculate gain or loss of the total area of each of the classes over three decades time period. These data were compiled and presented in table forms.
Results
The results from our analysis are shown below in Figs 2 – 8. Figure-1 Shows the study area and Table-1 summarize the results from the change detection analysis. The following paragraphs provide a brief account of the results obtained.
Table 1. Summary of Landcover change during 1987–2016
|
Land-cover Type |
Area in 1987 (Sq. Km) |
Area in 2016 (Sq. Km) |
Area Change (Sq. Km) |
% of total area in 1987 |
% of total area in 2016 |
% change |
|
Bare ground |
1893 |
1754 |
-139 |
30.9 |
28.6 |
-7.3 |
|
Grass |
1302 |
1187 |
-115 |
21.2 |
19.4 |
-8.8 |
|
Shrub |
866 |
1046 |
180 |
14.1 |
17.1 |
20.7 |
|
Forrest |
1070 |
1287 |
217 |
17.4 |
21.0 |
20.2 |
|
Water |
999 |
860 |
-139 |
16.3 |
14.0 |
-13.9 |
Our initial visual assessment of the study area using natural colour RGB images of Landsat images in December showed visible changes which is shown in Figure 1. Particularly, the northern sector of the lake showed some distinct visible changes in vegetation as marked with dotted circles in the figure. This was also visible from the LULC analysis as shown in Figure 2. Figures 3 – 7 are created by overlaying spatial distribution of the particular land cover type for 1987 and 2016 for all the (a) figures and overlaying the 2016 on top of 1987 for all the (b) figures. The purpose of these figures is to show the dynamics of each of the landcover types and how they lost and/or gained in spatial extension from 1987 to 2016. Figure 3 shows the increase in bare ground class from 1987 to 2016 (Fig 3a) and decrease in bare ground spatial class from 1987 to 2016 (Fig 3b). This reveals that bare ground coverage decreased by 7.3% of the total from 1987 to 2016 which is equal to an area of 139 Sq. Km.
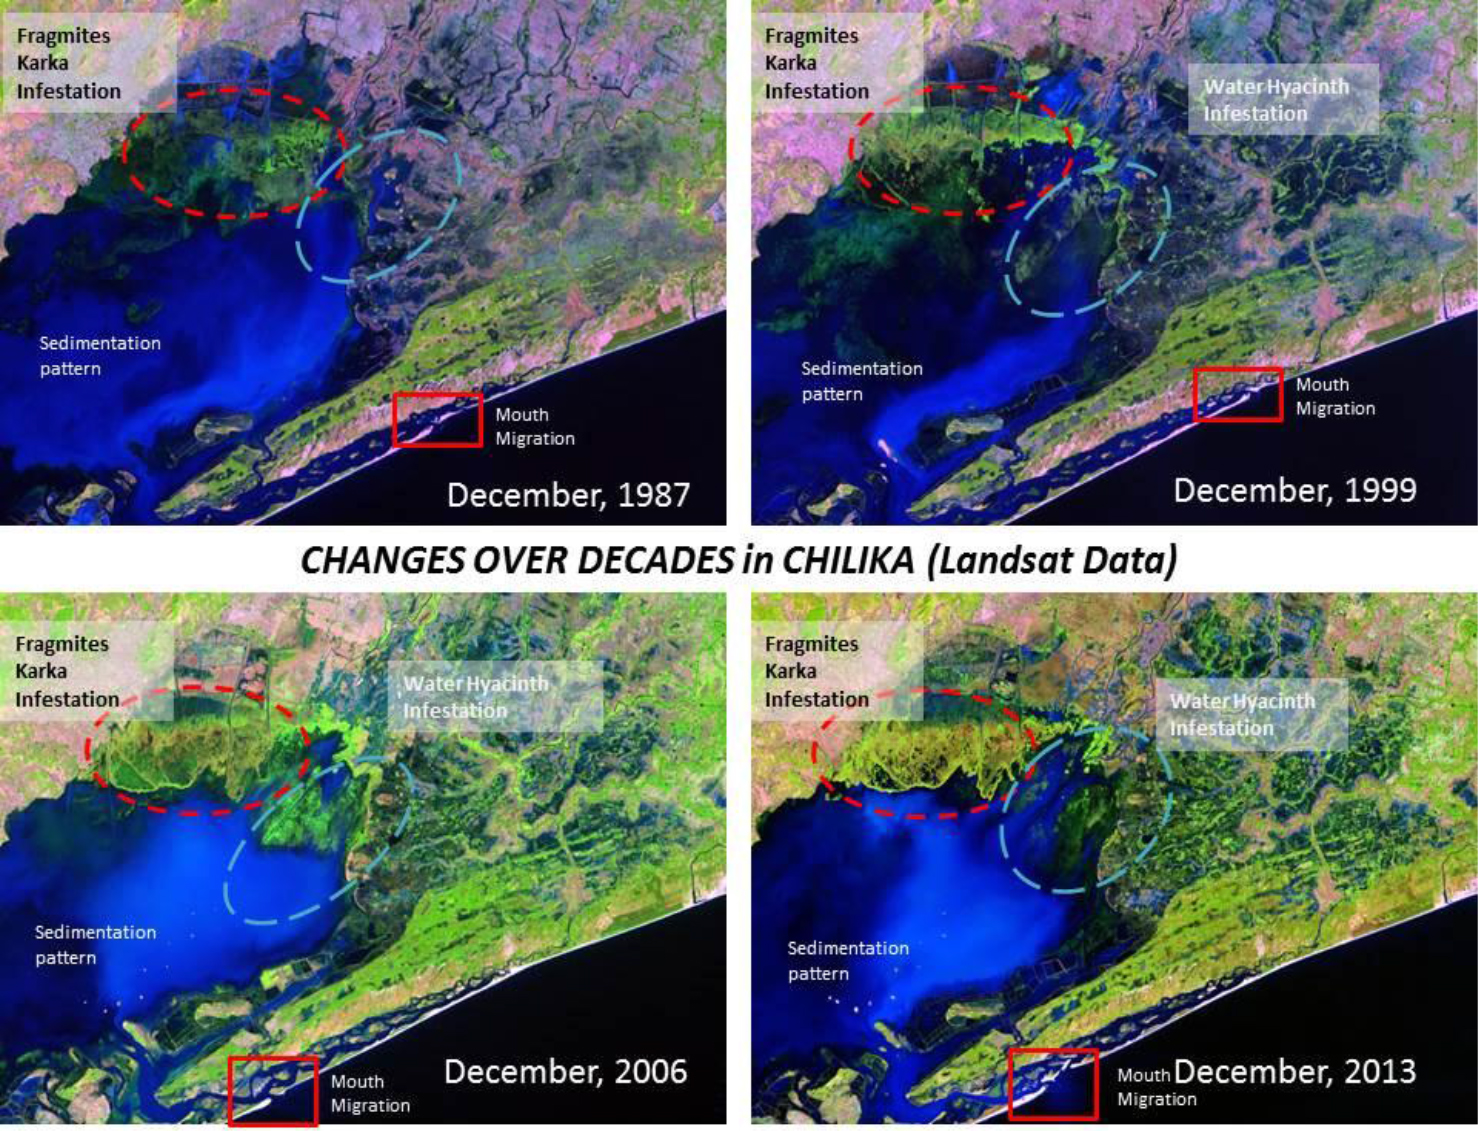
Figure 1. The figure shows natural colour RGB images of Landsat in December of 1987, 1999, 2006 and 2013 for a subset of the study area. The image depicts some visible changes in vegetation change. The type of vegetation change was identified in consultation with the Chilika Development Authority and also in a recent field visit to the study area.
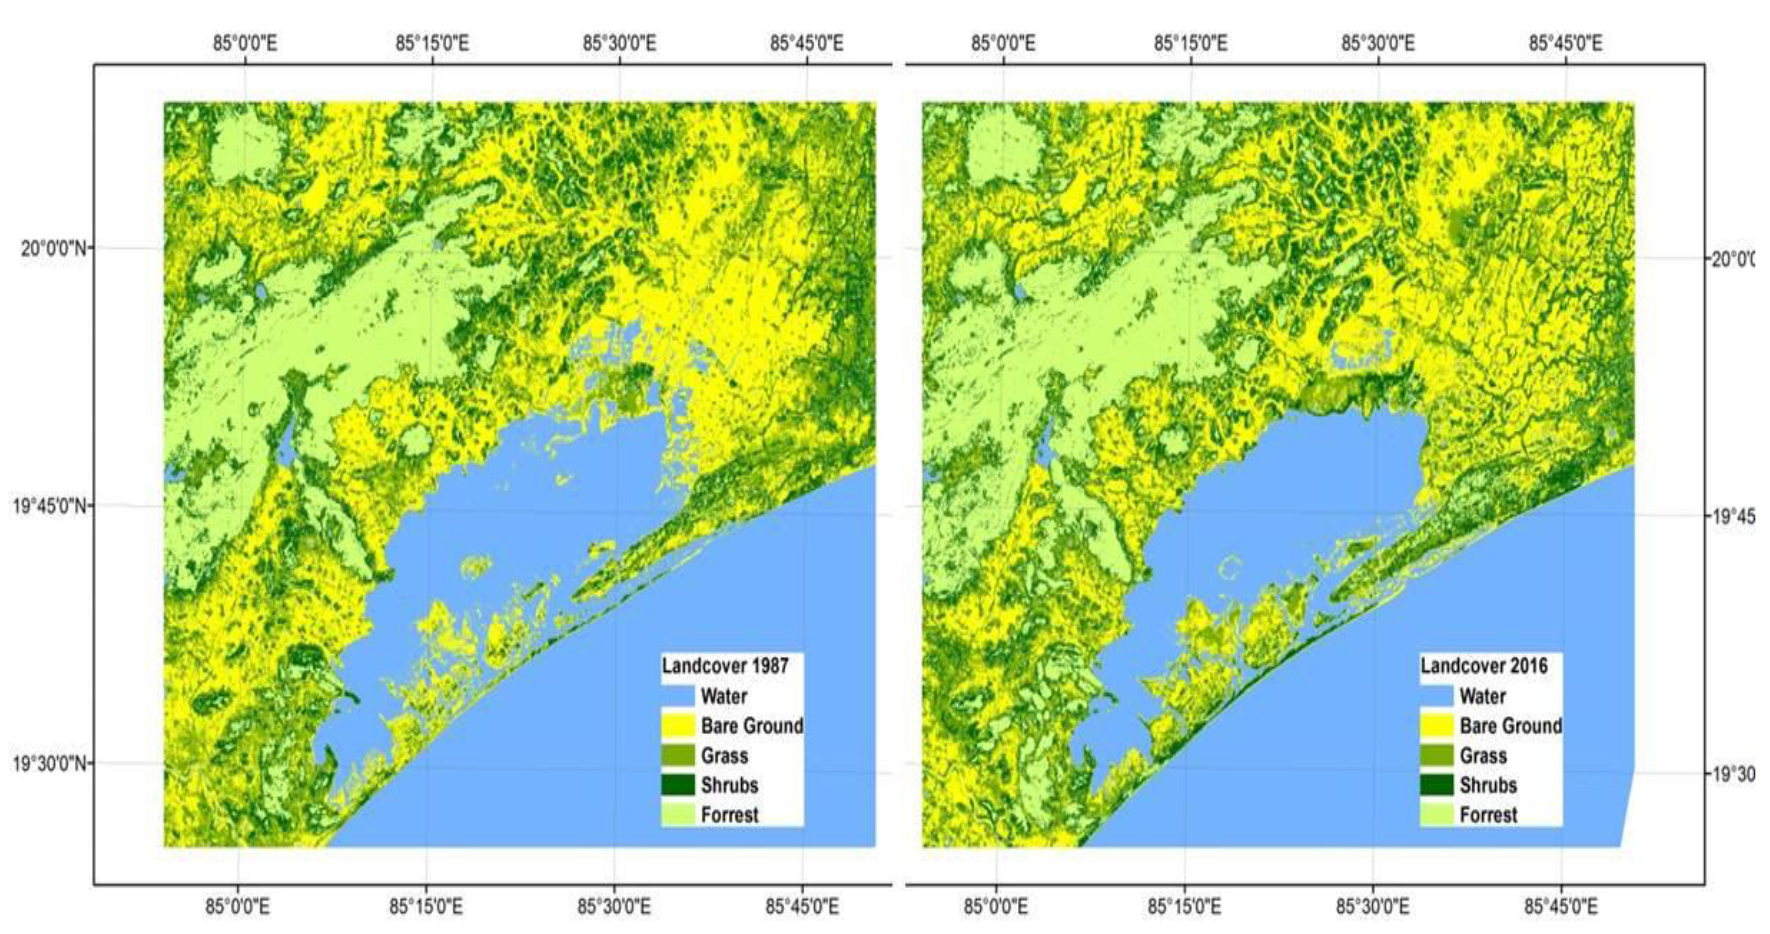
Figure 2. The figure shows the five classes in December, 1987 and December, 2016. The legend inside each figure marks the classes with respective colours.
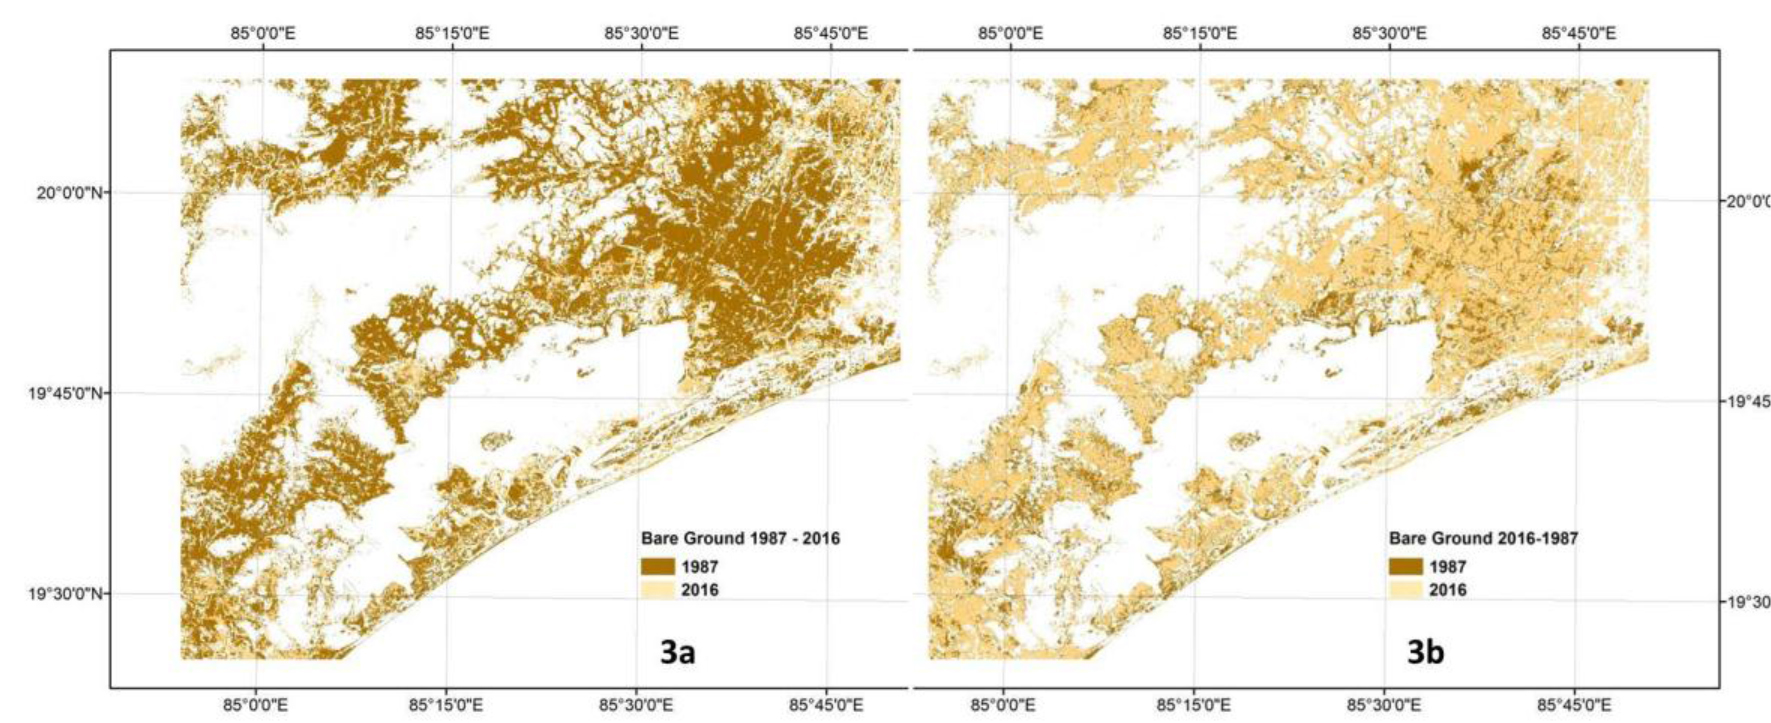
Figure 3. Dynamics of bare ground change between 1987 and 2016. The lightly shaded areas in Fig 3a shows the bare ground extent gained in 2016 compared to 1987 while the dark shaded areas in Fig 3b shows the bare ground extent lost in 2016 compared to 1987. Overall, the bare ground coverage decreased by 7.3% of the total from 1987 to 2016 with an area of 139 Sq. Km.
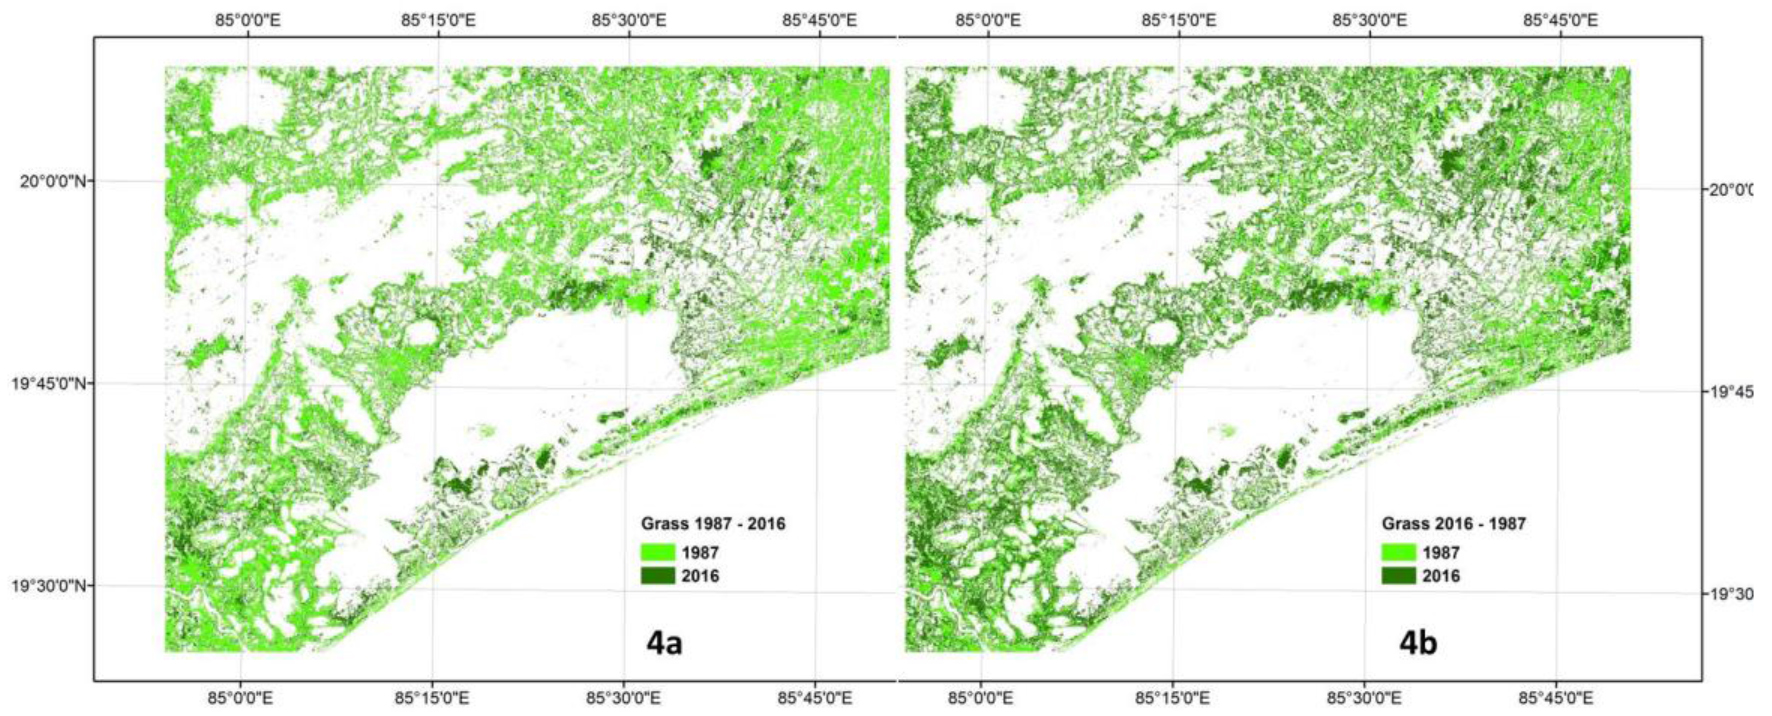
Figure 4. Dynamics of grass change between 1987 and 2016. The dark shaded areas in Fig 4a shows the grass extent gained in 2016 compared to 1987 while the light shaded areas in Fig 4b shows the grass extent lost in 2016 compared to 1987. Overall, the grass coverage decreased by 8.8% of the total from 1987 to 2016 with an area of 115 Sq. Km.
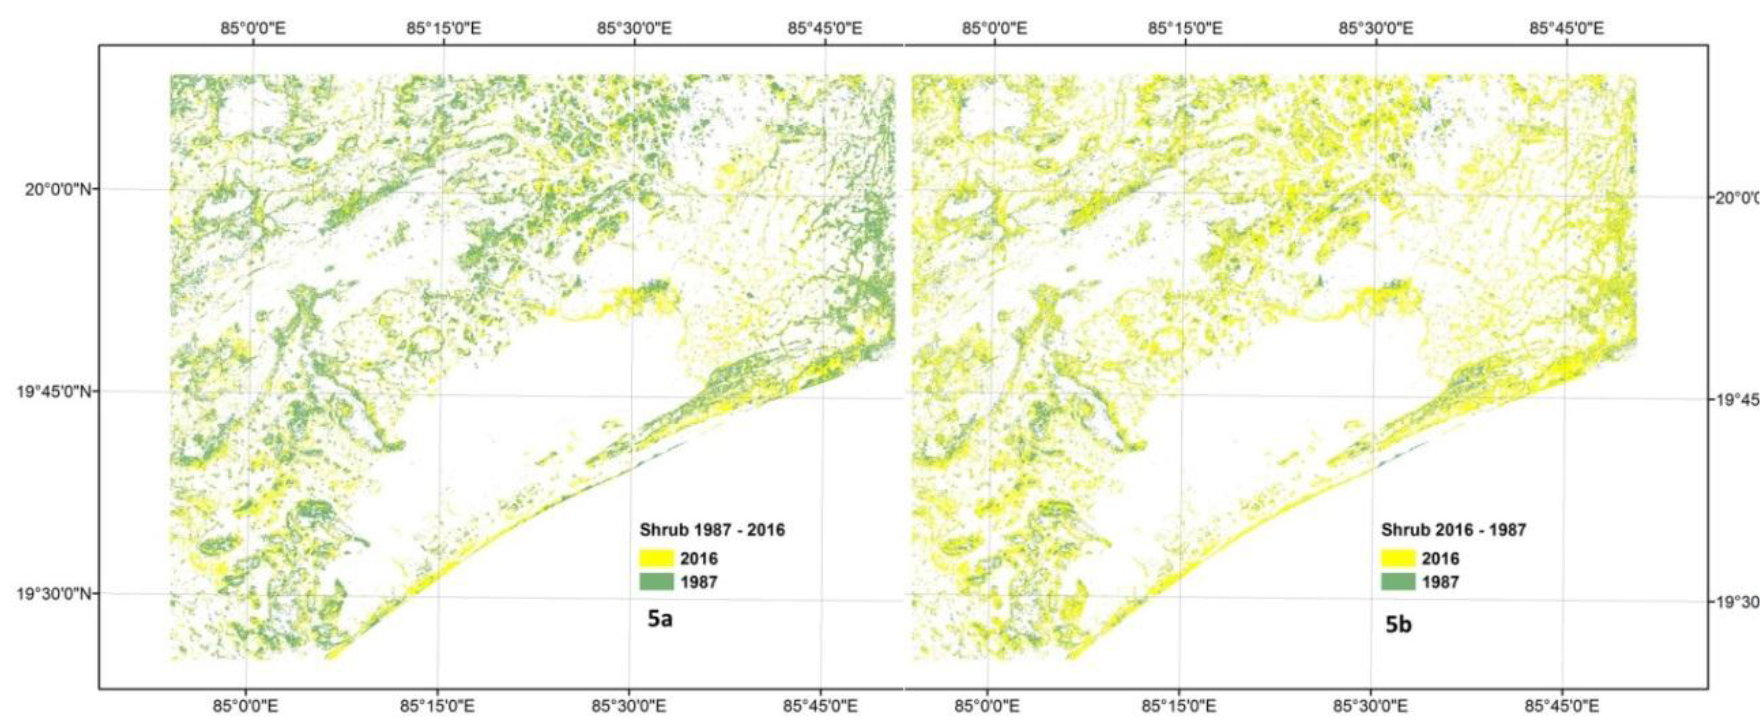
Figure 5. Dynamics of shrub change between 1987 and 2016. The lightly shaded areas in Fig 5a shows the shrub extent gained in 2016 compared to 1987 while the dark shaded areas in Fig 5b shows the shrub extent lost in 2016 compared to 1987. Overall, the shrub coverage was increased by 20.7% of the total from 1987 to 2016 with an area of 180 Sq. Km.
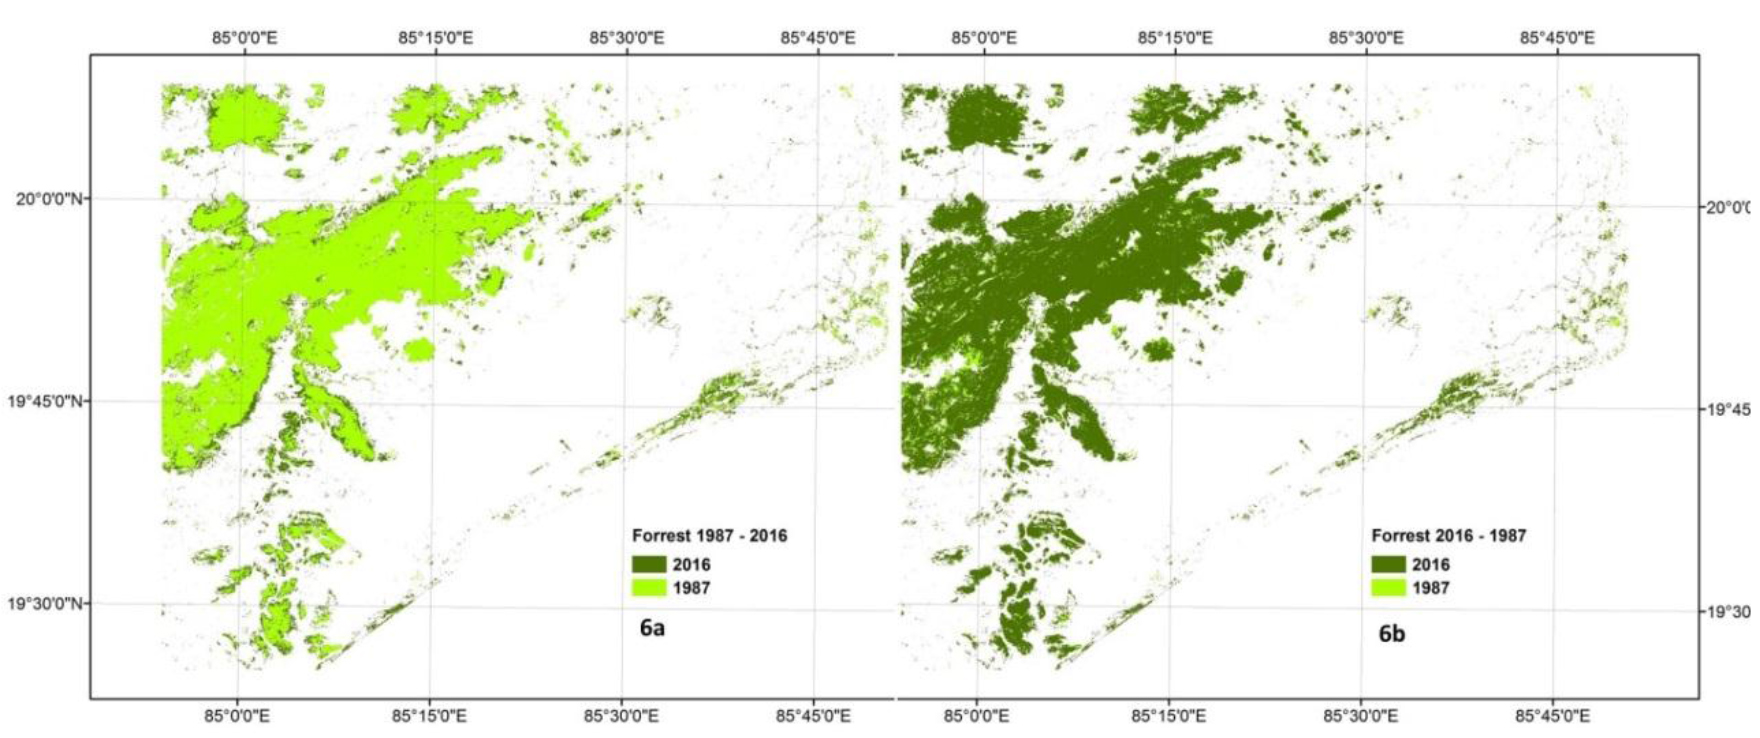
Figure 6. Dynamics of forest change between 1987 and 2016. The dark shaded areas in Fig 6a shows the forest extent gained in 2016 compared to 1987 while the light shaded areas in Fig 3b shows the forest extent lost in 2016 compared to 1987. Overall, the forest coverage increased by 20.2% of the total from 1987 to 2016 with an area of 217 Sq. Km.
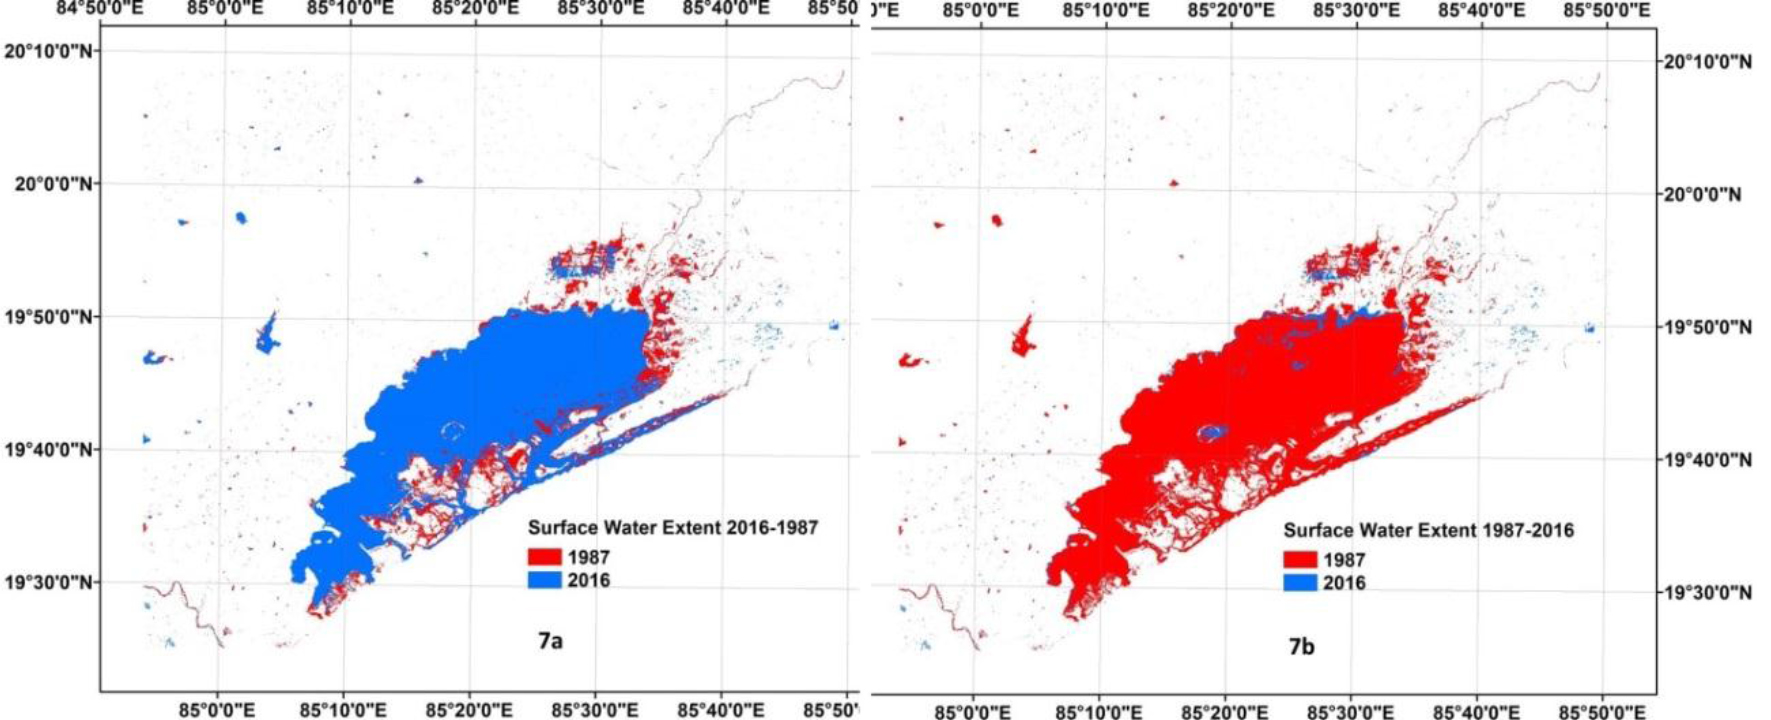
Figure 7. Dynamics of Surface Water change between 1987 and 2016. The red shaded areas in Fig 7a shows the surface water extent lost in 2016 compared to 1987 while the blue shaded areas in Fig 7b shows the surface water extent lost in 2016 compared to 1987. Overall, the surface water extent coverage decreased by 13.9% of the total from 1987 to 2016 with an area of 139 Sq. Km.
Similarly, figure 4 shows the change of cover type grass from 1987 to 2016. The figure depicts that this cover type decreased by 8.8% of the total from 1987 to 2016 with an area of 115 Sq. Km. For land cover type shrub shown in figure 5, the cover type has seen an overall increase by 20.7% of the total from 1987 to 2016 which equals to an area of 180 Sq. Km. Figure 6 depicts the change dynamics of the land cover type forest i.e. dense vegetation from 1987 to 2016. The figure reveals that this land cover type increased by 20.2% of the total from 1987 to 2016 with an area of 217 Sq. Km. The surface water land cover type change increased decreased by 13.9% of the total from 1987 to 2016 which equals an area of 139 Sq. Km.
Table 1 summarizes the analysis for the land use / cover type carried out on the Landsat data for December 1987 and December 2016. The total area in 1987 and 2016 and how much they changed are shown in sq.Km. Each of the land cover types in percent of the total area in 1987 and 2016 and how much they changed from 1987 to 2016 as a percentage are also shown in positive and negative changes.
Discussions and Conclusion
This study conducted near Chilika and its adjoining areas provided us the first glimpse of land cover change over three decades. The basic land cover types we chose helps us to have an baseline understanding of the changes happening in the area which is important while trying to develop long-term studies of change detection in finer spatial and temporal resolution. This study also shows us how we can exploit the long-term Landsat archive for ecosystem studies at a reasonably fine spatial resolution which is otherwise not available from any of the other satellites data archive. The results from our study reveal that bare ground, grass and water land cover types decreased from 1987 to 2016 while shrub and forest types increased from 1987 to 2016. We did our analysis on December Landsat data mainly due to better coverage because of less cloudy conditions. The timing of the season also has an impact on the land cover types we chose. For example, the bare ground included areas that are normally left barren after rice cultivation in December months in addition to open soils. Therefore, decreasing of bare ground from 1987 to 2016 probably means that less areas being cultivated in 2016 compared to 1987. The decrease of grass land cover types from 1987 to 2016 might mean that more naturally vegetated areas are being exploited for built-up areas. The shrub land cover type included shrubby vegetation which also included some of the weed infestation in Chilika area such as Phragmites Karka. Chilika Development Authority recognizes this as a major problem in Chilika area and also states the proliferation of this vegetation around Chilika over the last few decades. So, increase of shrub from 1987 to 2016 by about 180 sq.km probably captures the proliferation of this particular weed infestation problem that is happening in Chilika which is an interesting result. The forest land cover type included any dense vegetation including actual forests. The increase of forest type from 1987 to 2016 is mostly because of replantation that is happening in the area which was confirmed by the Chilika Development Authority. The decrease of surface water in the area by 139 sq km also complements the finding of increase of shrubs in the area which is actually proliferation of weeds in the chilika area. The decrease in surface water probably also depicts the degradation of coastal wetlands in the areas over three decades duration. Degradation of wetlands is a recognised problem in India and elsewhere and hence our finding provides us important baseline information for developing further studies. This finding needs further investigation with finer spatial and temporal resolution data and ground validation.
Acknowledgements
We would like to acknowledge support from the NRSC-NICES program to conduct this study as part of the Ecosystem Change and Climate Change research theme. We would also like to thank Chilika Development Authority, Govt. of Odisha for helpful feedback during our studies and also to interpret our results.
References
- Dimyati MUH, Mizuno K, Kobayashi S, Kitamura T (1996) An analysis of land use/cover change in Indonesia. International Journal of Remote Sensing 17: 931–944.
- Turner BL, Lambin EF, Reenberg A (2007) The emergence of land change science for global environmental change and sustainability. Proceedings of the National Academy of Sciences 104: 20666–20671.
- Ahearn DS, Sheibley RW, Dahlgren RA, Anderson M, Johnson J et al (2005) Land use and land cover influence on water quality in the last free-flowing river draining the western Sierra Nevada, California. Journal of Hydrology 313: 234–247.
- Leh M, Bajwa S, Chaubey I (2013) Impact of land use change on erosion risk: an integrated remote sensing, geographic information system and modeling methodology. Land Degradation & Development 24: 409–421.
- Li S, Gu S, Liu W, Han H, Zhang Q (2008) Water quality in relation to land use and land cover in the upper Han River Basin, China. Catena 75: 216–222.
- Xiong X, Grunwald S, Myers DB, Ross CW, Harris WG et al (2014) Interaction effects of climate and land use/land cover change on soil organic carbon sequestration. Science of the Total Environment 493: 974–982.
- Gallo KP, Easterling DR, Peterson TC (1996) The influence of land use/land cover on climatological values of the diurnal temperature range. Journal of climate 9: 2941–2944.
- Dewan AM, Yamaguchi Y (2009) Land use and land cover change in Greater Dhaka, Bangladesh: Using remote sensing to promote sustainable urbanization. Applied Geography 29: 390–401.
- Basnyat P, Teeter LD, Lockaby BG, Flynn KM (2000) The use of remote sensing and GIS in watershed level analyses of non-point source pollution problems. Forest Ecology and Management 128: 65–73.
- Gupta M, Srivastava PK (2010) Integrating GIS and remote sensing for identification of groundwater potential zones in the hilly terrain of Pavagarh, Gujarat, India. Water International 35: 233–245.
- Chander G, Markham BL, Helder DL (2009) Summary of current radiometric calibration coefficients for Landsat MSS, TM, ETM+, and EO-1 ALI sensors. Remote sensing of environment 113: 893–903.