Abstract
This study assessed the variation of concerns about expressing emotions in social relations, emerging from the increasing use of smartphones. Fifty respondents from the continental U.S.A participated through an application of Mind-Genomics Science. Two mind-set segments emerged. People in the first mind-set were concerned about the increasingly use of smartphones for social interaction, and the need for instant feedback. People in this segment stressed the need to put on a mask when presenting only a happy successful face. This segment was also preoccupied with our changing language skills, and with the increasing lack of privacy because everything one with smartphones is trackable. People in the second mind-set segment expressed concerns regarding the negative social effects of using smartphones to express emotions: less interaction at meals, isolation from personal relationships, fewer expressions of feelings, losing patience more quickly, and emerging health issues. A PVI (personal viewpoint identifier) is presented to allow discovery of these two mind-sets among new individuals, enabling a deeper understanding of the mind-sets by future researchers.
Introduction
An increasing array of studies have begun to document both the positive and the negative contributions to health and well-being benefits associated when people expression their feelings through this modern device, a multi-purpose mobile computing device, inexpensive, and widely used. The smartphone has become ubiquitous, and now a necessity in people’s lives offering, among others, new opportunities to interact in social relations. This study assesses concerns with the relation between use of smartphones and the changing patterns and abilities in a person’s expression of emotions.
Smartphone use produces both positives and negatives. One is example is self-esteem. Communication through smartphones did not predict self-esteem. The smartphone also has an effect on interpersonal relations. The smartphone is a way to express caring feelings. People wanted to use smartphones to bond with each other, thus reducing depression [1].
Interesting patterns emerge when the research focuses on the use of smartphones in the evening, rather than during the day. Those who work in the evening felt that using the smartphone to express emotions diminished a feeling of well-being, suggesting that smartphones used in the worktime (here evening) to express emotion, was simply not effective. There should be a time when smartphones are used to express emotions, and that time is not when one works. Furthermore, using smartphones in the evening for work increased psychological detachment [2].
When a person uses the smartphone compulsively, an increasingly behavior, certain psychological correlates emerge. In a study of links between psychological traits and the behaviors of smartphone users, Lee, Chang, Lin, and Cheng [3] reported that compulsive use of smartphone for expressing emotions was positively related to: locus of control, anxiety regarding social interaction, and finally a need for touching.
The growing evidence on negative effects of using smartphones raises the question about attitudes of people towards this use, which is the focus of this study. Compulsive use of smartphones provides a wonderful psychological ‘petri dish,’ emerging out of an increasingly used technology. The issues involve social relations, as well as well as characteristics of various types: Personal, psychological, emotional, and social-environmental, respectively [4–6].
- Social isolation, family discord, divorce, academic failure, job loss and debt [7].
- People with depression, loneliness, social anxiety, impulsivity and distraction may easily become compulsive users in expressing emotions through smartphones [8]. Fifty-four percent of compulsive users reported a prior history of depression; 34% had an anxiety disorder; and 52% had a history of alcohol and drug abuse.
- The place offering internet access, the degree of time to use the internet, peer relationships, parenting types were also linked to compulsive use [5].
- Most of compulsive users did not have proper school, work or interpersonal relationship, respectively [5]. They felt anxious and lonely without their smartphones [9].
Defining The Problem – What Concerns about Emotions and Empathy in this New World
The preponderance of social research about trends comes either from observing trends of behavior, and/or asking people about their feelings, either through surveys or discussions, such as focus groups with people discussing a topic, or in-depth interviews with one or two people to probe deeply. From these investigations one learns what is happening, and why it is happening. The two questions provide a good idea of the nature of the trend and may even suggest what will be the trajectory of the trend.
Mind Genomics approaches the problem of what and why through a different approach, one grounded in experimental psychology, and based in the notion of experiments to understand causality. Mind Genomics approaches the issue by presenting the respondent with a variety of vignettes, descriptions of a situation, a feeling, an observation. These vignettes are created by a Socratic technique, involving asking four questions about the topic, questions which tell a story, providing four answers to each question, mixing the answers together by a systematic approach, presenting these mixtures or vignettes to respondents, obtaining ratings, and then determining which element or answer in the vignette is a ‘driver’ of the rating.
The foregoing approach sounds very circuitous to answer a problem of ‘what is the trend,’ or ‘how do you feel?’ Yet, as the data will show below, this presentation of vignettes, getting responses, extracting the contributions of the elements, and uncovering the pattern provides a richness of insight that could otherwise not be obtained.
Approaching the problem by Mind Genomics
Mind Genomics begins with the raw material, ideas, and messages. These are called silos (questions) and elements (answers to the questions.) The actual study will involve mixing these elements into combinations, but before the mixing can occur, one must assemble the raw material, relevant statements about the issue, and sort them into questions and answers.
The actual work of creating silos and elements, questions and answers, is not presented here. Only the final set of test material is presented, as shown in Table 1. The task of developing the questions and answers is separate, and appropriate for any effort which wants to ‘sharpen’ a person’s mind. By expanding a topic such as loss of empathy into questions and answers, silos and elements, we force the researcher to ‘rewire’ thinking, proceeding in a more structure, and more methodical, more inclusive manner than the superficial thinking which accompanies the activities of ordinary daily life.
The four questions and the four answers to each question represent just a small sample of the many different ‘ideas’ involved in the possible loss of empathy through the overuse of today’s smartphone and similar devices. It is important to emphasize the that Mind Genomics does not try to answer the ‘big question’ by one study, but rather builds up a picture of the topic through many small studies whose combined information reveals an underlying pattern. The study reported here deals with only a limited number of meaningful aspects of the smartphone experience as it drives and affects interpersonal interactions and empathy. One could easily repeat this study, with new questions, new answers, and in doing so obtain another answer, or more correctly another ‘slice’ of the answer. The metaphor with the MRI should become clear. The MRI takes different pictures, from different angles. Mind Genomics does so as well, but pictures of big topics, not pictures of tissues [10].
Creating Combinations of Elements or Answers by Experimental Design
Today’s course of science education teachers that the scientific method works by isolating variables and studying the variables in detail. In such a way, one obtains a sense of ‘how nature works.’ The notion of studying interactions among variables is, of course, part of the basic topic. Interactions are, for the main part, studied with the belief that one studies a single variable, in the presence of other variables which affect that single, studied variable. That is, the focus is still on the single variable. The interaction of two variables is presented as how one or several variables ‘affect’ the response to the variable being studies.
Mind Genomics works in a different way, perhaps more in the spirit of everyday life. The focus of Mind Genomics is how bigger ideas emerge from the composition of smaller ideas, with these smaller ideas evaluated in combination with each other. Mind Genomics might be the study of art, where the focus is on the study of an emergent experience that experience coming from the combination of different independent variables. For Mind Genomics, it is the compound idea which is important, that compound idea coming from mixing together the different elements or answers.
Mind Genomics is taken from mathematical psychology, as adapted by the late Professor Paul Green and his colleagues at the Wharton School of the University of Pennsylvania [11].
Table 2 shows an example of six vignettes, i.e., combinations of elements or answers. Each combination is a defined mix of elements or answers, the exact composition coming from a prescription of combination to be followed. The table shows the element identifying codes for each vignette (top) and the binary expansion of the design, as a preparatory step for data analysis by OLS (ordinary least-squares) regression.
Table 2. Experimental design underlying six vignettes, i.e., combinations of elements.
|
Question/Silo |
Vig1 |
Vig2 |
Vig3 |
Vig4 |
Vig5 |
Vig6 |
|
A |
A4 |
A4 |
A1 |
A1 |
||
|
B |
B2 |
B4 |
B1 |
B1 |
B3 |
B2 |
|
C |
C2 |
C3 |
C1 |
C1 |
||
|
D |
D3 |
D1 |
D1 |
D3 |
D3 |
D4 |
|
|
||||||
|
Binary Expansion of the design for regression analysis |
||||||
|
A1 |
0 |
0 |
0 |
1 |
0 |
1 |
|
A2 |
0 |
0 |
0 |
0 |
0 |
0 |
|
A3 |
0 |
0 |
0 |
0 |
0 |
0 |
|
A4 |
1 |
0 |
1 |
0 |
0 |
0 |
|
B1 |
0 |
0 |
1 |
1 |
0 |
0 |
|
B2 |
1 |
0 |
0 |
0 |
0 |
1 |
|
B3 |
0 |
0 |
0 |
0 |
1 |
0 |
|
B4 |
0 |
1 |
0 |
0 |
0 |
0 |
|
C1 |
0 |
0 |
0 |
0 |
1 |
1 |
|
C2 |
1 |
0 |
0 |
0 |
0 |
0 |
|
C3 |
0 |
1 |
0 |
0 |
0 |
0 |
|
C4 |
0 |
0 |
0 |
0 |
0 |
0 |
|
D1 |
0 |
1 |
1 |
0 |
0 |
0 |
|
D2 |
0 |
0 |
0 |
0 |
0 |
0 |
|
D3 |
1 |
0 |
0 |
1 |
1 |
0 |
|
D4 |
0 |
0 |
0 |
0 |
0 |
1 |
It is important to note that the combinations, the vignettes, are not complete. That is, some vignettes comprise four elements, one element or answer from each silo or questions. Examples include Vig1 and Vig6. The remaining four show only three elements in a vignette. There are also others which show only two elements in the vignette.
The rationale for incomplete vignettes is that the elements must be statistically independent of each other. The only way to do that is to ensure that they are uncorrelated. In turn, uncorrelated means that knowing the components three of the components of the vignette should not affect the fourth at all. If, for example, we set up the rule that the vignette must have exactly one element from each silo, i.e., one answer from each of the four questions, then knowing three of the vignettes automatically tells us e which specific set of elements will constitute the source of the fourth element in the vignette. In such a situation, the elements are not truly independent of each other in a statistical sense. The regression analysis will fail because of so-called multi-collinearity.
The experimental design itself prescribes 24 vignettes or combinations of elements. Although the combinations might seem to be created in a haphazard fashion, the reality is quite the opposite. There is one basic design which is ‘efficient.’ By the word ‘efficient’ we mean that the respondent is required to evaluate a minimal number of vignettes (here 24), that all 16 elements appear equally often, that a vignette has at most one element from a silo (i.e., one answer from a question), and that the combinations can change from person to person, but the basic design remains the same. The latter, so-called permuted designs, enables Mind Genomics to test many different combinations of elements, with each respondent evaluating a unique set of 24 combinations [12]. Once again, the analogy here is the MRI, which takes many pictures, many ‘slices’ of the tissue, and combines these pictures to get a more complete picture.
Figure 1 shows an example of a vignette as the computer presents the vignette to the respondent. The figure is presented in the way the vignette would appear on the screen of a smartphone.
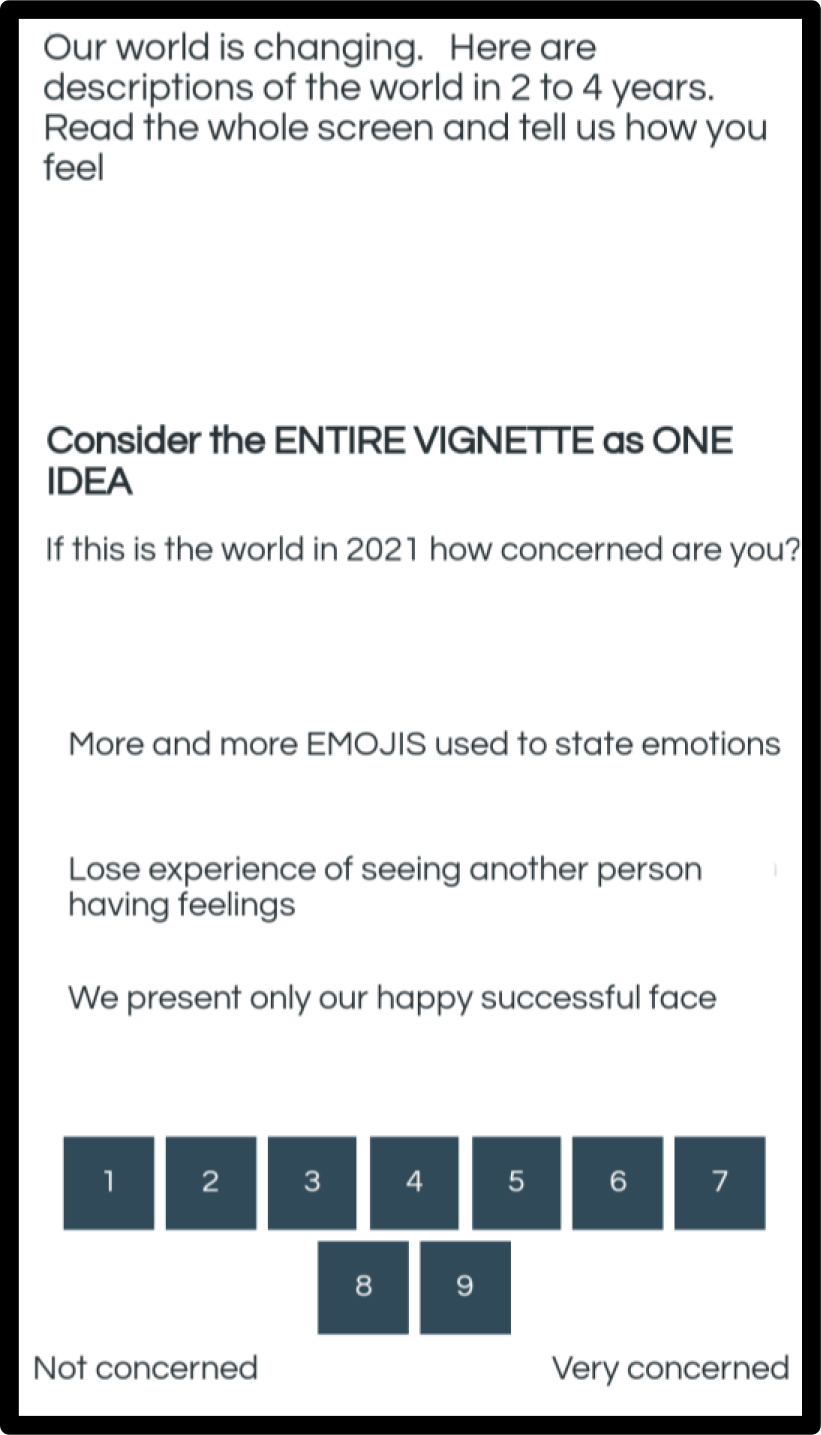
Figure 1. Example of a vignette as it appears on the screen of a smartphone.
Figure 1 shows a very simple format, easy to use. The introduction to the topic appears on the top of the figure. This introduction never changes from screen to screen. The only change is the content of the vignette, information that the respondent is instructed to consider as one, and only one idea. The respondent reads, or more realistically skims, the set of vignettes, and selects an answer. The screen immediately changes to the next vignette, reducing the onerous nature of the interview.
The respondent also provides answers to age (year born), gender, and a third question dealing with attitudes or behaviors towards the topic. For this study, the third question was phrased as follows:
Choose who you want to be in one year
1 = smartphone for fun and calling
2 = smartphone for calls only
3 = smartphone primarily for fun
4 = no addiction to a smartphone
5 = Not applicable
The information collected about the respondent, age, gender, and the third question (Choose who you want to be) allows the researcher to divide the respondents by who they say they ARE, what they say they DO, or what they say they BELIEVE, respectively.
The actual experience and the response measures
The study was set up on an APP (BimiLeap), which required the construction of the study in a simple format, beginning with study name, then the selection of four questions which ‘tell a story’ (see Table 1), creation of four answers for each question, and a rating scale. The information, once entered in the APP was sent to the e-panel recruiters, specializing in these studies, and affiliated with the APP (Luc.id, Inc.) There were no respondent qualifications, other than an approximate equal distribution of genders.
The respondents were selected by Luc.id, and then invited to participate. Working with Luc.id ensured that the entire study with 25 respondents could be done within the space of less than one hour, with a full report three minutes after the close of the study.
The respondents participated, the study was closed, and the data were analyzed.
The computer program measured two things:
- Rating the vignette – The direct cognitive response. The rating reveals the conscious degree of concern with what was being read on the screen [11].
- Response time – The cognitive load. The response time covaries with the effort was being expended to ‘process’ the information, with response time [13].
The computer program first measured the response time, in seconds, between the time that the vignette appeared on the screen, and the time that the respondent rated the vignette. Response times of 10 seconds or longer were converted to 10 seconds, based upon previous experience with response times, showing that only a small proportion of response times were longer than 9 seconds, and of these, most were 15 seconds or longer. We surmise that the respondent was otherwise engaged for a moment while participating, and thus we truncated the range of response times to 0–9 seconds.
The ratings on the 9-point scale were converted to a binary scaling by bisecting the scale into two regions. Ratings of 1–6 were converted to 0, and ratings of 7–9 were converted to 100, respectively. A small random number (<10–5) was added to each converted number. The rationale for the binary conversion is that for most studies of this kind, it is easier to understand binary data (no/yes) than to understand scalar data. One does not know what the scale points mean. This analysis produces only a slight loss of information at the top and the bottom of the rating scale. Figure 2 shows a scatterplot of average ratings from each of the 50 respondents. Each filled circle corresponds to the average from one respondent, the average based on the ratings of the 24 vignettes (abscissa), or the average based on the binary transformed value for the 24 vignettes (ordinate.)
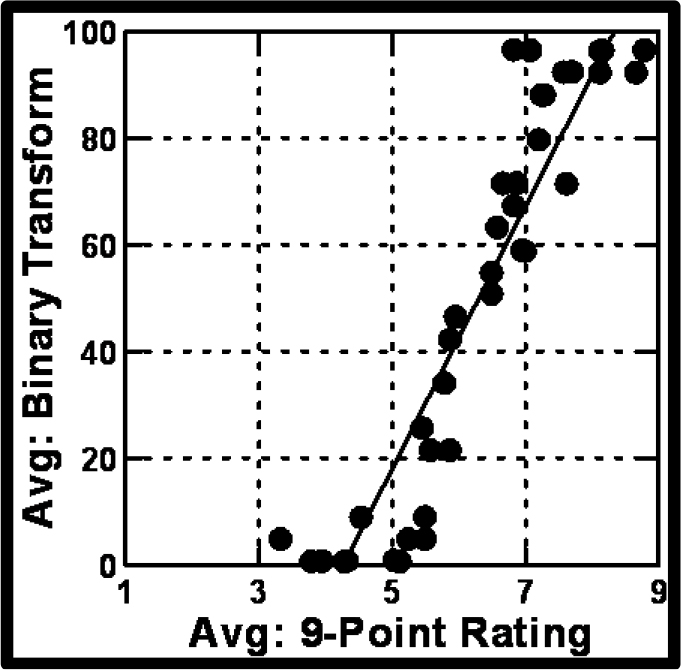
Figure 2. Scatterplot of average ratings from each of the 50 respondents, based on the 9-point rating (abscissa) or the binary transformed rating (ordinate). Each filled circle corresponds to one respondent.
Morphology – Patterns of Responses
The first analysis concerns the distribution of responses for the ratings of concern, based on the 1–9 scale, and the response times. The results appear in Figure 3. The density plot combines the data from all 50 respondents, each respondent evaluating 24 vignettes, bringing the total number of data points to 50 × 24 or 1,200.
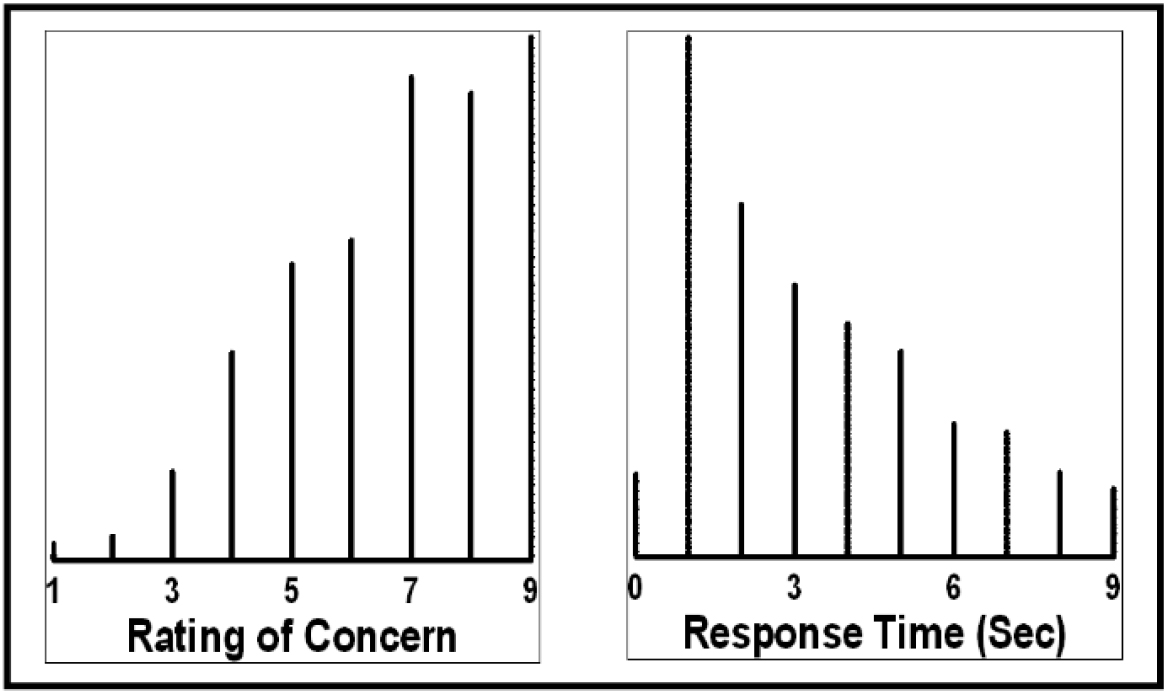
Figure 3. Distribution of ratings of concern, and distribution of response times. The distribution emerges from responses to the 1200 vignettes.
Figure 3 suggests a range of levels of concern across the individual vignettes, as well as a range of response times. As noted above, response times greater than 9 seconds were automatically transformed to 9 seconds because most of the responses take no more than 7–8 seconds. Longer responses MAY indicate deeper thought, but it is more likely that these longer times signal that the respondent was in some way interrupted.
An analysis of average ratings across the 50 respondents shows dramatic person-to-person differences. There are respondents who, on the average are only modestly concerned with the loss of empathy, whether the concern is measured on the original 9-point scale, or on the binary transformed scale. There are also respondents who rate the vignettes very quickly, faster than three seconds on average, and in contrast, respondents who rate the vignettes very slowly, on average taking six seconds or longer to rate a vignette. Figure 4 shows the distribution of these averages.
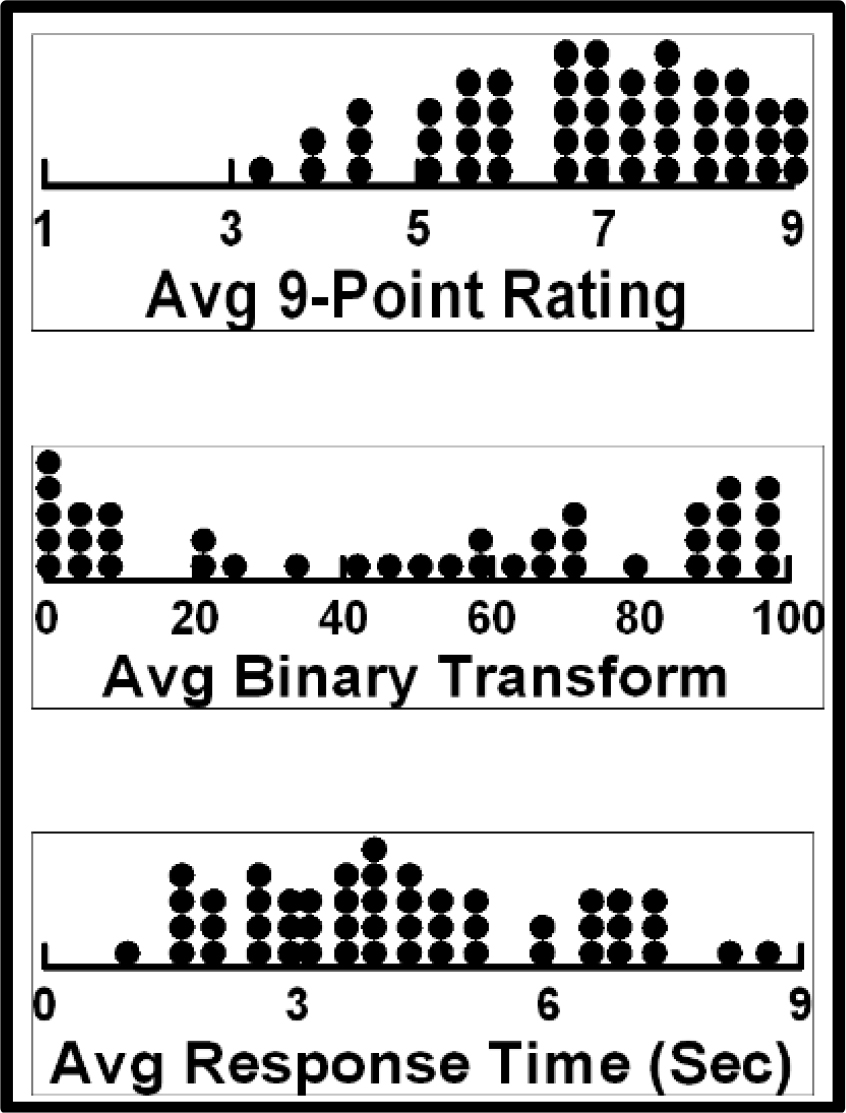
Figure 4. Distribution of average patterns of responses. Each filled circle corresponds to the average response of one of the 50 respondents, each respondent evaluating 24 vignettes.
The final analysis of the morphology of responses concerns the questions whether those who are more concerned, on average, respond more quickly. The answer to this question is NO, at least for the data on empathy. Figure 5A shows a scatterplot, with each filled circle corresponding to one of the 50 respondents. The plot suggests a random relation between the degree of concern manifested by the average rating (after transformation to binary) shown on the abscissa, and the average response time in seconds shown on the ordinate.
It is important to note that up to now we have looked at the data in terms of what economists called a ‘cross-sectional’ analysis. That is, we have not looked deeply at the composition of the vignettes. Rather, we have searched for emergent patterns from ‘different but complete’ representatives of a domain. What we mean by ‘different but complete’ is that each of the respondents is a separate, measurable entity. We do not know what that entity comprises. We are simply interested in discovering some type of explainable regularity, a pattern, emerging when we plot different measures taken on the same set of entities. We are searching for an unplanned, possibly happenstance regularity of nature, without necessarily doing the experiment to create the possibility of discovering that regularity.
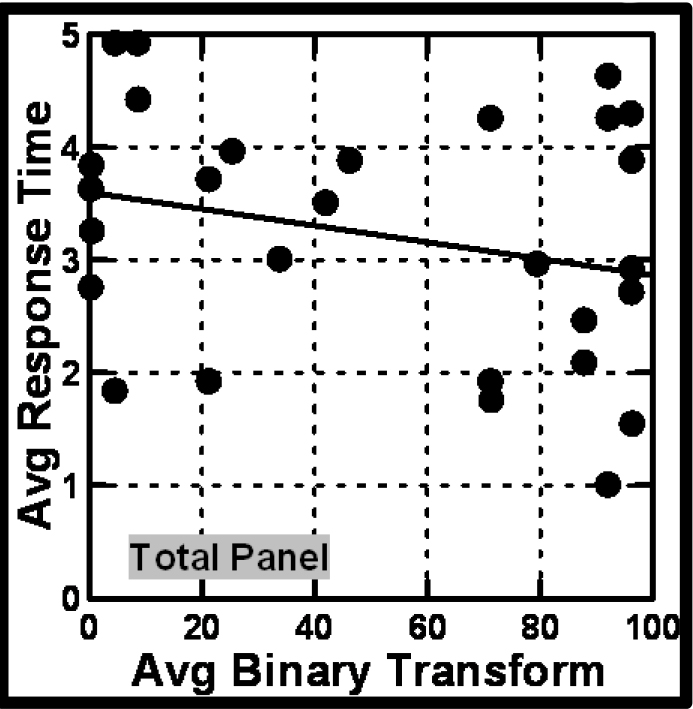
Figure 5A. Relation between average response time (ordinate) and average degree of concern (binary transform, abscissa). The straight line is the estimated best fit. Each filled circle corresponds to one of the 50 respondents.
Deep Analysis – Relating the elements (answers) to the binary ratings
The basic ‘project’ of Mind Genomics is to discover the ‘algebra of the mind.’ Mind Genomics does so by experiments. Rather than relying on cross-sectional analysis of already-completed test stimuli, with the hope that a pattern emerges, and the further hope that the pattern can be explained, Mind Genomics creates the conditions for finding a meaningful pattern. Mind Genomics does so by systematically creating combinations of ideas (the answers), presenting these combinations of known composition to respondents, obtaining ratings, and deconstructing the response to the part-worth contribution of the components.
The contribution of experimental design cannot be sufficiently lauded. Experimental design allows us to create MANY possible combinations, test each one, and combine the data into one analysis. The strategy, as explained below, forces the emergence of a meaningful pattern just by the very nature of how the elements are combined. Mind Genomics does not look for patterns as much as finds the patterns, and perhaps even cavalierly expressed, ‘trips over the abundant patterns.’ It is the task of Mind Genomics to record these patterns which so easily emerge, and then to label the patterns, and move on to understanding more about these discoveries.
The data from the experimentally designed vignettes allows for analysis by standard statistical methods, specifically OLS (ordinary least-squares) regression and then cluster analyses. The former, OLS regression, relates the presence/absence of the 16 elements to the rating, or more correctly to the binary transformed rating (0/100). The latter, cluster analysis, allows the discovery of groups of respondents showing similar patterns of coefficients from the OLS regression. These groups, called clusters or segments, represent like-minded individuals, who show similar patterns of responses to the test elements. They become Mind-Sets in the language of Mind Genomics.
We begin with the OLS regression. The inputs are the independent variables and the dependent variable. There are 16 independent variables, one for each of the 16 elements shown in Table 1.
Table 2, top, shows the composition of six of the vignettes, in terms of the specific elements. The regression analysis cannot deal with this type of data. We transform the data to binary, creating first a set of 16 new variables (A1-D4). The variables take on the value 0 when the element is absent from the vignette, and they take on the value 1 when the element is present in the vignette. These are called ‘dummy variables,’ because they have only two values, 0 or 1. They convey no other information other than absent or present, respectively.
The dependent variable for the OLS regression is the binary transformed rating, namely 0 or 100. We add a small random number during the transformation to ensure that the 0 or 100 become a more variable set of numbers. This strategy of adding a very small random number ensures that we can use OLS regression for respondents who limit their ratings to the lower part of the scale (1–6, all transformed to 0), or who limit their ratings to the higher part of the scale (7–9, all transformed to 100.) The very slight variation in the ratings suffices to protect against a ‘crash’ of the regression program due to the problem of ‘no variation in the dependent variable.’
When we run the OLS regression we obtain output as shown in Table 3. The OLS regression uses all 1200 observations or cases as input. The number 1200 comes from the 50 respondents, each of whom evaluated 24 vignettes, totally 1200. Although the experimental design allows us to run OLS on the data of each respondent, we choose to combine all the relevant data together, and run one OLS model, the so-called Grand Model.
Table 3. Performance of the elements, based on the total panel, and the binary transformed rating. Each number shows the contribution to the likelihood of saying concerned (rating 7–9.) The elements are sorted in descending order of coefficient.
|
Coeff |
t-stat |
p-value |
||
|
Additive constant |
54.02 |
6.96 |
0.00 |
|
|
A4 |
We are isolated from personal expressions of feeling because of smartphones |
6.51 |
1.37 |
0.17 |
|
A3 |
Fewer long and detailed expressions of feelings |
6.15 |
1.30 |
0.19 |
|
B4 |
Texting causes misinterpretation of many feelings by others |
4.63 |
0.97 |
0.33 |
|
B1 |
Far less talking with each other at meals |
4.42 |
0.92 |
0.36 |
|
A1 |
More and more EMOJIS used to state emotions |
3.65 |
0.77 |
0.44 |
|
D4 |
Everything we write and do is permanent trackable and for sale |
3.39 |
0.72 |
0.40 |
|
D3 |
The small screen creates posture problems. eye problems |
2.99 |
0.64 |
0.53 |
|
A2 |
Type short abbreviations to express feelings |
2.63 |
0.56 |
0.58 |
|
B2 |
Lose experience of seeing another person having feelings |
2.15 |
0.46 |
0.65 |
|
D1 |
We are developing a need for instant feedback |
0.75 |
0.16 |
0.87 |
|
C1 |
We believe EMOJIS say it all |
0.20 |
0.04 |
0.97 |
|
C2 |
We talk less and text a lot |
0.17 |
0.04 |
0.97 |
|
D2 |
Our language skills are changing |
-0.03 |
-0.01 |
1.00 |
|
B3 |
Lose patience with others if they are not ALWAYS ON |
-0.30 |
-0.06 |
0.95 |
|
C4 |
We feel alone because others seem so happy and successful |
-0.43 |
-0.09 |
0.93 |
|
C3 |
We present only our happy successful face |
-0.95 |
-0.20 |
0.84 |
The Grand Model is expressed by the simple linear equation: Binary Rating = k0 + k1(A1) … k16 (D4)
Table 3 shows the following parameters
- The additive constant, k0, which is the estimate value of the binary rating in the absence of elements. It can be interpreted as a baseline, namely the likelihood or probability that a response will be ‘YES’ (rating 7–9), in the absence of elements. Of course, all the vignettes comprised 2–4 elements, by design, so the additive constant is a purely computed parameter.
- The coefficients, k1-k16 value in the model. A coefficient tells us the incremental percent (positive coefficient) or the decremental percent (negative coefficient) of responses being ‘YES’ when the element is incorporated into the vignette. We look for reasonably high positive elements, those around 7.51 or higher, which, from many studies, appears to correspond to meaningful behavior of other sorts, such as buying an item when the rating scale is likelihood to buy.
- The t-stat or t-statistic, showing the ratio of the coefficient to the standard error of the coefficient. We want a high ratio, to indicate to us that the coefficient differs from 0. The t-stat may be likened to a measure of signal/noise. The t-stats for the total panel are relatively low, suggesting that the coefficients, even the high ones, are based on results with a great deal of noise or intrinsic variability. For example, element A4, ‘We are isolated from personal expressions of feeling because of smartphones,’ with a coefficient of 6.51 may really result from dramatically different points of view, some strongly positive, and others strongly negative. We would like to see t-statistics which are very high, suggesting that they are based on a lot of agreement, not just the result of a ‘tug of war’ between dramatically different points of view.
- The p-value is the probability that the coefficient comes from a sampling distribution with a true value of 0, rather than what we observe. We always look for low p-values. That is, we always look for low probabilities. When we have a high probability, it means that the coefficient may look different from 0 (e.g., be 3 or 4, or -1 or -5), but the reality could be that the true value of the coefficient is closer to 0.
- The data we see in Table 3 do not simply provide us with numbers. They allow us to get a sense of the underlying structure of the mind as the mind comes to grips with these statements about the smartphone and empathy.
- We begin with the additive constant, which tells us the expected percent of times that we will observe a rating of 7–9 when we talk about ‘concern’ but don’t talk about anything specifically other than the general introduction to the problem. Our coefficient is 54.02, meaning that in the absence of elements, a purely theoretical situation but a good baseline, about half the responses will be ‘I am concerned,’ i.e., a rating of 7–9.
- Each element either adds or subtracts a percent of responses about concern. For example, when we incorporate element A4 (We are isolated from personal expressions of feeling because of smartphones), our coefficient is 6.51. This means that an additional 6.51% of the responses will turn from indifferent/unconcerned (rating of 1–6) to concern (rating 7–9.) A vignette with this one element is expected to generate a percent of ‘concerned’ responses equal to the sum of the additive constant and this single element, or 54.02 + 6.51 = 60.53.
- Not every element drives concern. Some elements drive no concern, and some even reduce concern. Here are the elements which actually have little impact.
Our language skills are changing
Lose patience with others if they are not ALWAYS ON
We feel alone because others seem so happy and successful
We present only our happy successful face
- We can compose new combinations, and estimate the reactions to these combinations, by summing the additive constant and the individual coefficients of the elements being incorporated. We must be careful to limit the number of elements to a maximum of four, and preferably combine elements from the different silos or questions in Table 1, not from the same silo.
Building a Model for Response-Time
When a respondent evaluates a test vignette, the respondent must read the vignette, whether slowly or quickly, following which the respondent presses one key to assign the rating. The time between the appearance of the vignette and the response can be deconstructed by OLS regression into the contributions of the component elements. The independent variables are the presence/absence of the 16 elements, and the dependent variable is the response-time, the time between appearance of the vignette and the rating of that vignette.
We follow the same procedure as we did for the ratings, namely put all the data together into one database, and build a single model. The model is written similarly to the equation above, relating the binary transformed response to the presence/absence of elements. The only difference is that there is no additive constant. The ingoing hypothesis is that in the absence of elements the response time is defined to be 0. The following equation expresses the model:
Response Time = k1(A1) + k2(A2) … + k16(D4)
Table 4 suggests a small range of responses for the individual elements, with the fastest response given to A1, because of the lowest coefficient, and the slowest response given to D4, because of the highest coefficient. A1 is a simple fact. D4 is a more frightening proposition, forcing people to stop a bit, if only to think of the implications of being tracked.
Table 4. Response times to the elements based on the total panel. Each number (coeff) shows the estimated number of seconds required to read and process the information in the vignette.
|
Element |
Coeff. |
t-stat |
|
|
A1 |
More and more EMOJIS used to state emotions |
0.98 |
3.50 |
|
A2 |
Type short abbreviations to express feelings |
1.01 |
3.62 |
|
C1 |
We believe EMOJIS say it all |
1.06 |
3.80 |
|
D2 |
Our language skills are changing |
1.09 |
3.84 |
|
D1 |
We are developing a need for instant feedback |
1.12 |
4.02 |
|
B4 |
Texting causes misinterpretation of many feelings by others |
1.13 |
4.11 |
|
A3 |
Fewer long and detailed expressions of feelings |
1.16 |
4.12 |
|
B2 |
Lose experience of seeing another person having feelings |
1.16 |
4.20 |
|
B1 |
Far less talking with each other at meals |
1.25 |
4.61 |
|
B3 |
Lose patience with others if they are not ALWAYS ON |
1.29 |
4.74 |
|
C4 |
We feel alone because others seem so happy and successful |
1.33 |
4.72 |
|
C3 |
We present only our happy successful face |
1.33 |
4.85 |
|
A4 |
We are isolated from personal expressions of feeling because of smartphones |
1.34 |
4.82 |
|
D3 |
The small screen creates posture problems. eye problems |
1.37 |
4.83 |
|
C2 |
We talk less and text a lot |
1.63 |
5.82 |
|
D4 |
Everything we write and do is permanent trackable and for sale |
1.73 |
6.19 |
Do we respond faster or slower to elements which concern us?
Now that we have deconstructed the vignettes into the contribution of the elements towards making the respondent concerned, as well as the time need to process the elements (response time), we can begin to understand the dynamics of concern. The first question is whether there is a clear relation between response time for the element and concern about the element? We look at the relation based upon responses to the elements, rather than response patterns by different individuals, as we had done in Figure 4.
Figure 5B shows the scatterplot. Each of the filled circles corresponds to one of the 16 coefficients. It is clear from Figure 5B that there is virtually no relation between response time and concern, when we look at the pattern generated by the total panel for the 16 individual elements.
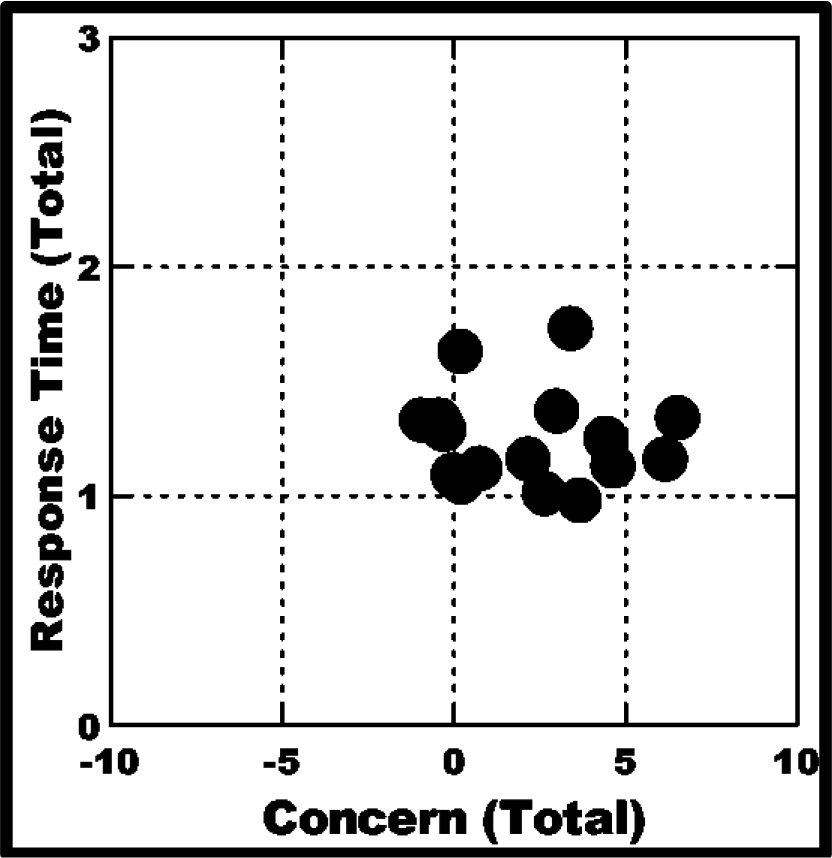
Figure 5B. Relation between the response time (ordinate) and concern (abscissa) for the total panel. Each filled circle corresponds to one of the 16 elements.
Patterns Emerging from Subgroups
The initial analysis of the results suggested both that the respondents could differentiate the elements when we consider their coefficients for both transformed binary ratings (concern), and for response time. Some elements drive concern, some do not. Yet, there is a sense that combining the respondents into one group and creating a model for that group may mask differences among the elements in terms of which drive concern, and which are responded to slowly versus quickly.
As an example of the group-to-group differences that one can find, consider two elements, the first being the strongest performing for the total panel (A4: We are isolated from personal expressions of feelings because of smartphones), and the second being virtually irrelevant for the total panel (C2: We talk less and text a lot.) The results of a group-to-group analysis appear in Table 5.
Table 5. Example of how the same element may be judged dramatically differently by respondents in different subgroups.
|
Element A4 |
Coefficient |
t-stat |
p-Value |
|
TOTAL |
6.51 |
1.37 |
0.17 |
|
GENDER = Male |
7.34 |
1.07 |
0.29 |
|
GENDER = Female |
5.47 |
0.83 |
0.40 |
|
AGE = 18–25 |
-1.28 |
-0.08 |
0.94 |
|
AGE = 26–39 |
6.38 |
0.64 |
0.52 |
|
AGE = 40+ |
7.85 |
1.35 |
0.18 |
|
BIN = 2A (Segmented on coefficients from Binary Transform) |
13.28 |
2.02 |
0.04 |
|
BIN = 2B (Segmented on coefficients from Binary Transform) |
-0.26 |
-0.04 |
0.97 |
|
TIME = 2C (Segmented on coefficients from Response Time) |
7.05 |
1.05 |
0.30 |
|
TIME = 2D (Segmented on coefficients from Response Time) |
5.50 |
0.83 |
0.41 |
|
Element C2 |
Coefficient |
t-stat |
p-Value |
|
TOTAL |
0.17 |
0.04 |
0.97 |
|
GENDER = Male |
1.54 |
0.22 |
0.82 |
|
GENDER = Female |
-1.48 |
-0.23 |
0.82 |
|
AGE = 18–25 |
-6.81 |
-0.43 |
0.67 |
|
AGE = 26–39 |
8.14 |
0.83 |
0.41 |
|
AGE= 40+ |
-0.79 |
-0.14 |
0.89 |
|
BIN = 2A (Segmented on coefficients from Binary Transform) |
-2.62 |
-0.40 |
0.69 |
|
BIN = 2B (Segmented on coefficients from Binary Transform) |
4.06 |
0.59 |
0.55 |
|
TIME = 2C (Segmented on coefficients from Response Time) |
-9.25 |
-1.38 |
0.17 |
|
TIME= 2D (Segmented on coefficients from Response Time) |
8.63 |
1.30 |
0.19 |
Our groups are the following:
- Total
- Gender – Male vs Female
- Age – 18–25; 26–39, 40+
- Two mind-sets based upon patterns of binary coefficients (2A, 2B)
- Two mind-sets based upon patterns of response time (2C, 2D)
The coefficients for an element different by group, sometimes only by a little, sometimes by a lot. Just because an element performs well for the total panel does not mean that it will always perform well when we look at subgroups. This is especially the case for Mind-Set segments based upon similar patterns of coefficients, with the coefficients coming either from the binary transform of concern (2A vs 2B) or coming from the response time (2C vs 2D.)
Table 6. Key differences by gender
|
|
|
Male |
Female |
|
Concern – Women are more generally concerned than are men. Men are concerned about the loss of detailed expression of feelings |
|||
|
Additive constant |
47 |
62 |
|
|
A3 |
Fewer long and detailed expressions of feelings |
8 |
3 |
|
Response Time – Men react more quickly than do women |
|||
|
B4 |
Texting causes misinterpretation of many feelings by others |
0.6 |
1.6 |
|
A1 |
More and more EMOJIS used to state emotions |
0.8 |
1.1 |
|
C1 |
We believe EMOJIS say it all |
0.9 |
1.2 |
|
A3 |
Fewer long and detailed expressions of feelings |
0.9 |
1.4 |
|
B1 |
Far less talking with each other at meals |
1.0 |
1.6 |
|
A2 |
Type short abbreviations to express feelings |
1.0 |
1.0 |
|
B3 |
Lose patience with others if they are not ALWAYS ON |
1.0 |
1.7 |
|
D1 |
We are developing a need for instant feedback |
1.0 |
1.3 |
Table 7. Key differences by age group
|
|
Age 18–25 |
Age 26–39 |
Age 40+ |
|
|
Concern – The youngest respondents are most concerned at a basic level. |
||||
|
Additive constant |
75 |
32 |
59 |
|
|
A3 |
Fewer long and detailed expressions of feelings |
21 |
13 |
1 |
|
C1 |
We believe EMOJIS say it all |
12 |
10 |
-4 |
|
C3 |
We present only our happy successful face |
-5 |
15 |
-5 |
|
D4 |
Everything we write and do is permanent trackable and for sale |
-31 |
14 |
5 |
|
B4 |
Texting causes misinterpretation of many feelings by others |
-8 |
11 |
4 |
|
B1 |
Far less talking with each other at meals |
-6 |
11 |
2 |
|
A2 |
Type short abbreviations to express feelings |
-2 |
9 |
1 |
|
B3 |
Lose patience with others if they are not ALWAYS ON |
-5 |
9 |
-3 |
|
C2 |
We talk less and text a lot |
-7 |
8 |
-1 |
|
D3 |
The small screen creates posture problems. eye problems |
-15 |
8 |
4 |
|
A4 |
We are isolated from personal expressions of feeling because of smartphones |
-1 |
6 |
8 |
|
Response Time – The youngest respondents react most quickly. |
||||
|
B4 |
Texting causes misinterpretation of many feelings by others |
-0.5 |
1.2 |
1.3 |
|
A2 |
Type short abbreviations to express feelings |
-0.2 |
0.3 |
1.4 |
|
B3 |
Lose patience with others if they are not ALWAYS ON |
-0.2 |
0.9 |
1.7 |
|
B2 |
Lose experience of seeing another person having feelings |
0.1 |
1.4 |
1.2 |
|
B1 |
Far less talking with each other at meals |
0.3 |
1.5 |
1.3 |
|
C3 |
We present only our happy successful face |
0.4 |
1.4 |
1.5 |
|
C1 |
We believe EMOJIS say it all |
0.7 |
0.8 |
1.2 |
|
A3 |
Fewer long and detailed expressions of feelings |
1.3 |
0.5 |
1.3 |
|
A1 |
More and more EMOJIS used to state emotions |
1.7 |
0.8 |
1.0 |
|
D2 |
Our language skills are changing |
2.3 |
1.5 |
0.7 |
We now turn to listing the key differences by complementary subgroups. We look only at those elements which generate a coefficient of +8 or more for concern based upon the binary transform, or those elements which generate a response time less than 1.0 seconds.
Segmenting the Respondents on The Basis of the Pattern of Responses (Concern Versus Response-Time)
One of the hallmark features of Mind Genomics is the focus on Mind-Sets. A Mind-Set is defined as a way of thinking about a topic. Operationally the Mind-Set is defined as a set of mutually-consistent and compatible ideas which are held by an individual. Although the statement incorporates people, the Mind-Set is really a set of ideas, not the person. It is the person, the physical individual, who responds and manifests the Mind-Set. In this way Mind Genomics looks at the ideas first, and then who holds these ideas.
The Mind-Sets are developed by the statistical method of clustering [14] the underlying idea is that the thinking pattern of each person can be represented numerically by the pattern of the coefficients, whether the coefficients relate to the binary-transformed ratings of concern or relate to response time, respectively.
When we cluster the respondents based upon the binary-transformed ratings of concern, we look for a small number of mutually complementary groups of individuals who show different and interpretable patterns. That is, the strongest performing elements for each Mind-Set should ‘tell a story.’ This is the first criterion, ‘interpretability.’ The second criterion, parsimony, requires that we create as few Mind-Sets as possible. It is better to emerge with fewer, somewhat less precise, Mind-Sets, than more Mind-Sets, albeit one which are each more precise.
Table 8 shows us the two Mind-Sets emerging from segmenting or clustering the respondents using coefficients from the binary-transformed rating.
Table 8. The two Mind-Sets emerging from segmenting or clustering the respondents using coefficients from the binary-transformed rating.
|
BIN 2A |
BIN 2B |
||
|
Concern |
|||
|
Additive constant |
53 |
52 |
|
|
D4 |
Everything we write and do is permanent trackable and for sale |
14 |
-8 |
|
A4 |
We are isolated from personal expressions of feeling because of smartphones |
13 |
0 |
|
A3 |
Fewer long and detailed expressions of feelings |
11 |
4 |
|
A1 |
More and more EMOJIS used to state emotions |
10 |
-1 |
|
D3 |
The small screen creates posture problems. eye problems |
8 |
-4 |
|
D1 |
We are developing a need for instant feedback |
8 |
-7 |
|
B4 |
Texting causes misinterpretation of many feelings by others |
-4 |
15 |
|
B1 |
Far less talking with each other at meals |
-1 |
11 |
|
C1 |
We believe EMOJIS say it all |
-5 |
8 |
|
|
Response Time |
||
|
A1 |
More and more EMOJIS used to state emotions |
0.8 |
1.2 |
|
D2 |
Our language skills are changing |
0.8 |
1.3 |
|
D1 |
We are developing a need for instant feedback |
1.0 |
1.3 |
|
B4 |
Texting causes misinterpretation of many feelings by others |
1.6 |
0.6 |
|
A2 |
Type short abbreviations to express feelings |
1.4 |
0.6 |
|
B3 |
Lose patience with others if they are not ALWAYS ON |
1.6 |
1.0 |
Table 9 shows the two Mind-Sets emerging from clustering respondents using the coefficients from response time.
Table 9. The two Mind-Sets emerging from clustering respondents using the coefficients from response time.
|
|
|
TIME 2C |
TIME 2D |
|
Concern |
|||
|
Additive constant |
67 |
44 |
|
|
C2 |
We talk less and text a lot |
-9 |
9 |
|
C1 |
We believe EMOJIS say it all |
-8 |
8 |
|
Response Time |
|||
|
C1 |
We believe EMOJIS say it all |
0.5 |
1.6 |
|
B4 |
Texting causes misinterpretation of many feelings by others |
0.6 |
1.6 |
|
C4 |
We feel alone because others seem so happy and successful |
0.6 |
1.9 |
|
C3 |
We present only our happy successful face |
0.8 |
1.9 |
|
B2 |
Lose experience of seeing another person having feelings |
0.8 |
1.4 |
|
A1 |
More and more EMOJIS used to state emotions |
2.0 |
0.1 |
|
A3 |
Fewer long and detailed expressions of feelings |
2.1 |
0.3 |
|
A2 |
Type short abbreviations to express feelings |
1.5 |
0.6 |
|
A4 |
We are isolated from personal expressions of feeling because of smartphones |
2.1 |
0.7 |
|
D2 |
Our language skills are changing |
1.3 |
0.9 |
Do we Get Faster as we have More Experience with the Vignettes?
As respondents go through the experiment, looking at 24 vignettes and rating them, we can measure the average response time. For ease of analysis, we have broken up the data into the vignettes appearing in the first third, the second third, and the final third of the experiment, i.e., in sets of eight vignettes. Table 10 shows clearly that there is a large reduction in response time between the first eight vignettes, and the remaining vignettes.
The response time does not, however, quicken in a monotonic way, as the respondent goes through the experiment. There are three elements which show erratic behavior, with the response time actually increasing as we go from the middle of the experiment (vignettes 9–16) to the end of the experiment (vignettes 17–24). The common factor is the word ‘other.’
We feel alone because others seem so happy and successfulTexting causes misinterpretation of many feelings by others Far less talking with each other at meals
Finding Mind-Sets 2A and 2B (Concern) In the Population
The essence of Mind Genomics is the discovery of how people think about a topic, and, of course, the emergence of different ways of thinking about the same topic. Now that we have demonstrated at least two different mind-sets, the next issue is to explore how these mind-sets distribute in the population, and then discover co-variations of these mind-sets, whether in terms of who the people ARE, how the people THINK, and/or what the people DO. Can we discover new knowledge regarding these mind-sets, and if so how, when our basic science need be developed with only 25–50 people?
As noted before, discovering mind-sets is straightforward, and can be done easily and quickly with a small sample of people. That discovery is akin to discovering the primary colors. We do not need to sample thousands of objects to discover the primary colors. On the other hand, to relate membership in a mind-set to other aspects of the person (ARE, THINK, DO) requires that we assign people to one of the mind-sets, and then look for relations between these people whose mind-sets have been established and other aspects of the people.
We create a PVI, a personal viewpoint identifier, using the data in Table 9, but with the table expanded to show the coefficients of all 16 elements emerging from Mind-set 2A and Mind-set 2B, respectively. The PVI requires the respondent to rate six different ‘questions’ emerging from the data, with each question corresponding to one of the 16 elements. The questions are chosen from those elements which best differentiate between two mind-sets, or in the case of three or four mind-sets, the elements which best differentiate among the three or four mind-sets, respectively. In turn, the questions are answered on a binary scale. The underlying algorithm then assigns the respondent to one of the two (or when appropriate three/four) mind-sets. Figure 6 shows a worked example which is available at http://162.243.165.37:3838/TT08/.
Table 10. Change in the response time as the experiment proceeds.
|
|
|
Vig 1–8 |
Vig 9–16 |
Vig 17–24 |
|
D1 |
We are developing a need for instant feedback |
2.0 |
0.6 |
0.8 |
|
A4 |
We are isolated from personal expressions of feeling because of smartphones |
2.0 |
0.8 |
0.8 |
|
C4 |
We feel alone because others seem so happy and successful |
1.9 |
0.8 |
1.6 |
|
A3 |
Fewer long and detailed expressions of feelings |
1.8 |
0.9 |
1.0 |
|
B3 |
Lose patience with others if they are not ALWAYS ON |
1.8 |
0.9 |
0.7 |
|
B4 |
Texting causes misinterpretation of many feelings by others |
1.1 |
1.0 |
1.4 |
|
B1 |
Far less talking with each other at meals |
1.4 |
1.0 |
1.6 |
|
D4 |
Everything we write and do is permanent trackable and for sale |
3.0 |
1.4 |
0.5 |
|
C1 |
We believe EMOJIS say it all |
1.7 |
1.3 |
0.6 |
|
D2 |
Our language skills are changing |
1.7 |
1.2 |
0.6 |
|
A2 |
Type short abbreviations to express feelings |
1.5 |
1.1 |
0.7 |
|
C3 |
We present only our happy successful face |
1.8 |
1.5 |
0.7 |
|
A1 |
More and more EMOJIS used to state emotions |
1.2 |
1.0 |
0.8 |
|
D3 |
The small screen creates posture problems. eye problems |
2.0 |
1.0 |
0.8 |
|
B2 |
Lose experience of seeing another person having feelings |
1.3 |
1.1 |
1.0 |
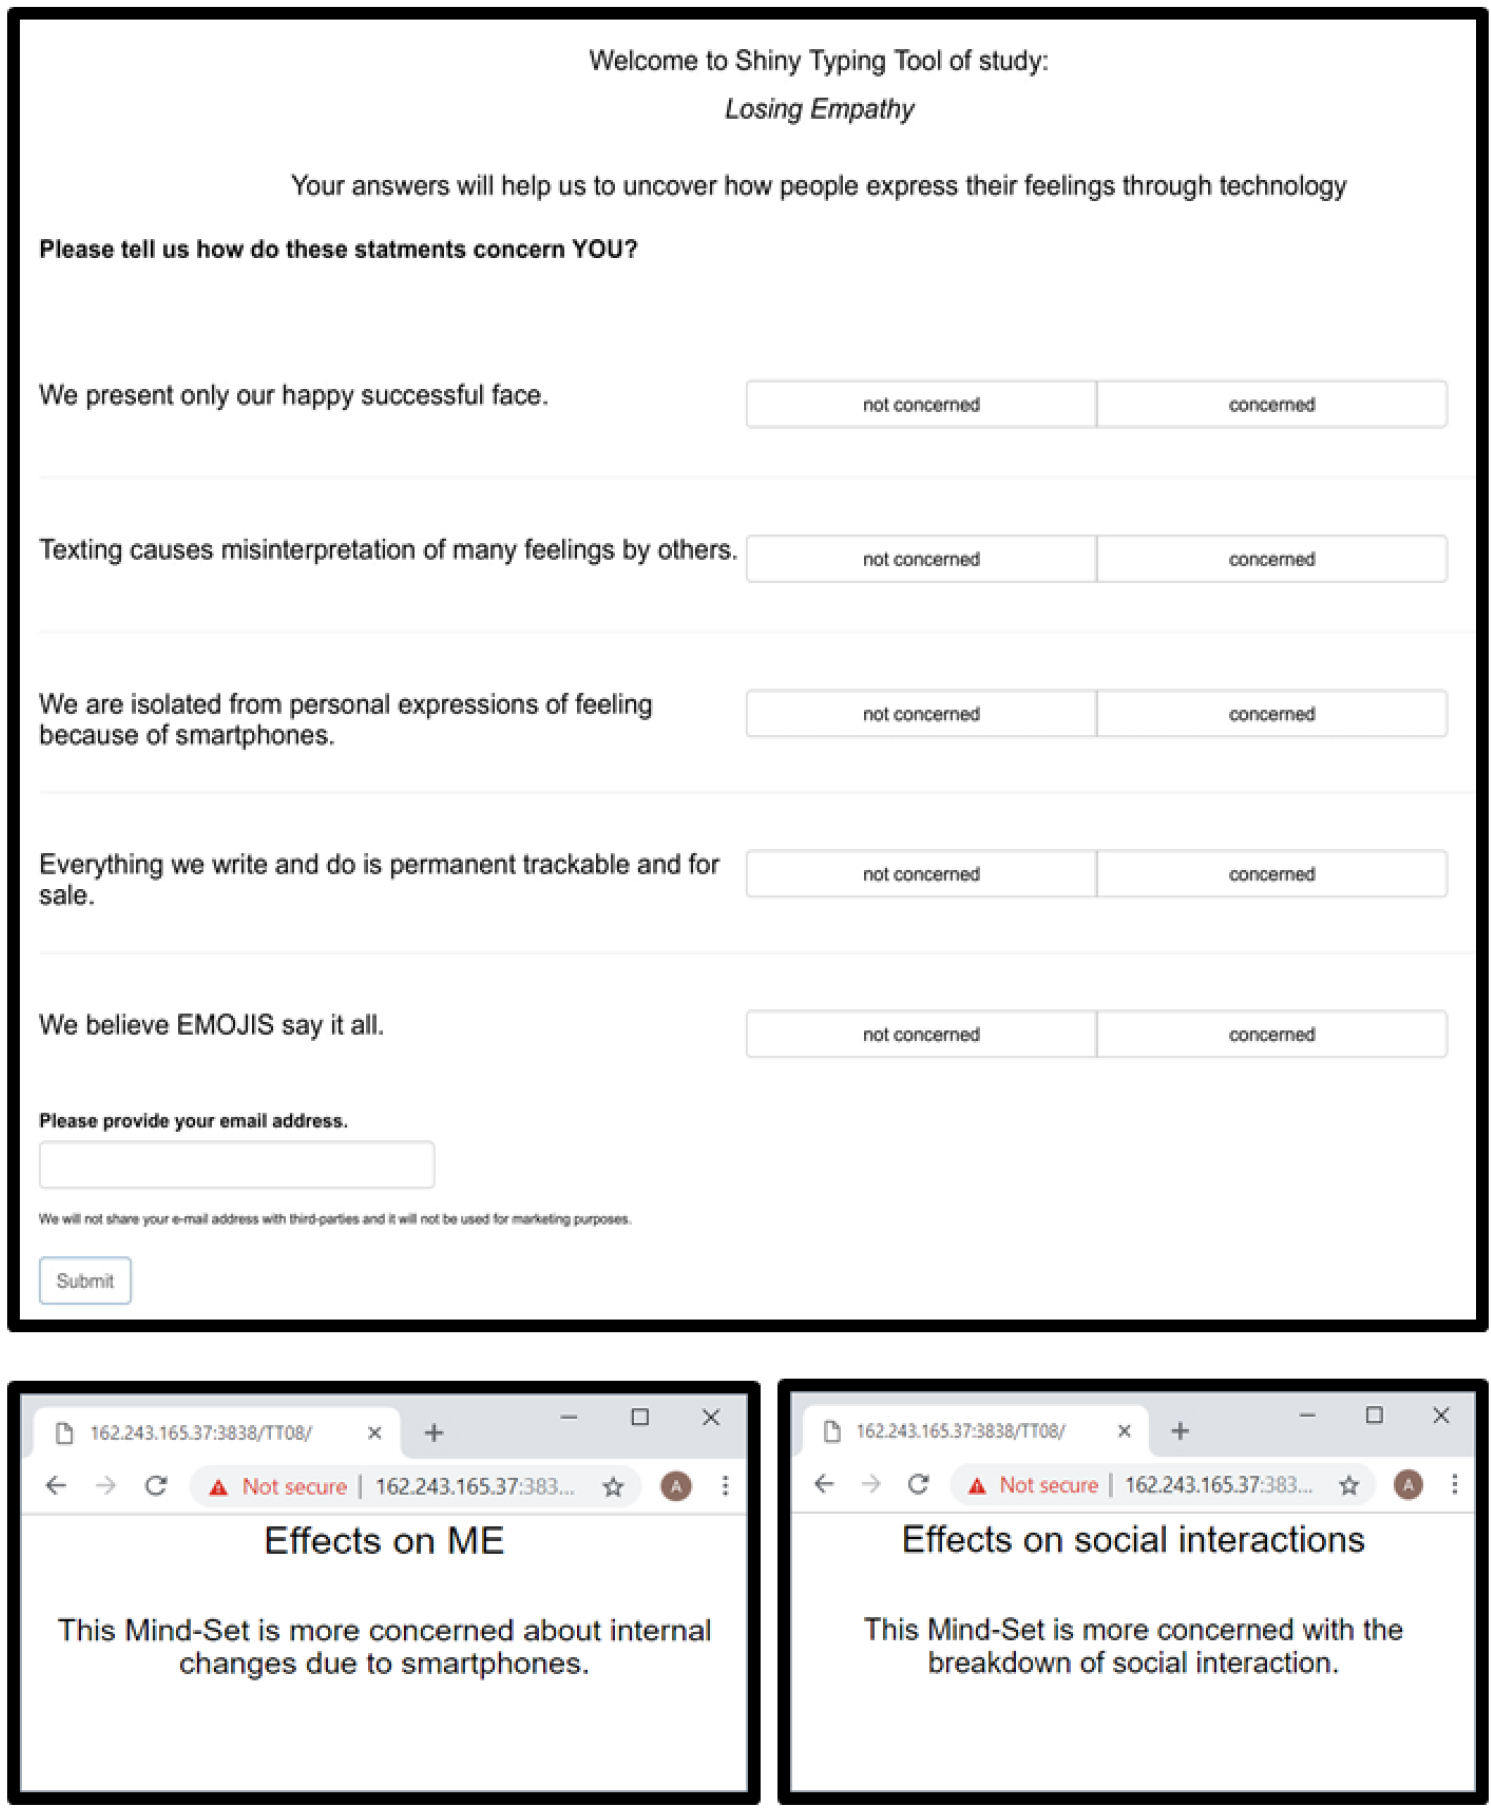
Figure 6. The PVI (Personal Viewpoint Identifier) and the feedback information about the respondent. The upper part shows the Welcome screen of the PVI with the five binary questions, while the bottom part presents the feedback to the two mind-sets.
Discussion
Looking at the two mind-set segments we learn that people in the first mind-set segment were concerned with the need to use smartphones for social interaction and for instant feedback from others. People in this segment stressed their concerns about one’s need to put on a carnival mask when presenting only a happy successful face [15]. This segment was also preoccupied with increasing trends of changing language skills, and the increasing lack of privacy because everything on the web is trackable.
People in the second mind-set segment expressed concerns regarding the effects of using smartphones to express emotions: less talking at meals, isolation from personal relationships, fewer expressions of feelings, losing patience more quickly, and creating or aggravating health issues. Even with the stated benefits of expressing more with less energy could not counteract the concern regarding the negative health effects was raised.
The most important outcome of this study is the support for previously raised concerns and a recommendation. This study supports previous studies which warned against compulsive use of smartphones and the difficulty to treat it [4,5]. We call work organizations to take responsibility and limit the use of smartphones in the evening for work purposes.
Acknowledgment
Attila Gere thanks the support of the Premium Postdoctoral Researcher Program of the Hungarian Academy of Sciences
References
- Park N, Lee H (2012) Social implications of smartphone use: Korean college students’ smartphone use and psychological well-being. Cyberpsychology, Behavior, and Social Networking 15: 491–497.
- Ohly S, Latour A (2014) Work-related smartphone use and well-being in the evening. Journal of Personnel Psychology 13: 174–183.
- Lee YK, Chang CT, Lin Y, Cheng ZH (2014) The dark side of smartphone usage: Psychological traits, compulsive behavior and technostress. Computers in human behavior 31: 373–383.
- Choi NY, Han EG (2006) Predictors of children’s and adolescents’ game addiction: Impulsivity, communication with parents and expectation about the internet games. Journal of Korean Home Management Association 24: 209–219.
- Kim H (2013) Exercise rehabilitation for smartphone addiction. Journal of exercise rehabilitation 9: 500.
- Kim K, Ryu E, Chon MY, Yeun EJ, Choi SY, et al. (2006) Internet addiction in Korean adolescents and its relation to depression and suicidal ideation: a questionnaire survey. International journal of nursing studies 43: 185–192.
- Young K, Pistner M, O’MARA JAMES, Buchanan J (1999) Cyber disorders: The mental health concern for the new millennium. CyberPsychology & Behavior 2: 475–479.
- Kim MO (2001) A study on the effects of family resilience of adoption of family of children with disabilities. Korean J Family Social Work 8: 9–39.
- Online news. Youth serious smartphone addiction. 2013. Available from http://www.kyeonggi.com/news/articleView.html?idxno=675154.
- Moskowitz HR, Gofman A, Beckley J, Ashman H (2006) Founding a new science: Mind genomics. Journal of sensory studies 21: 266–307.
- Green PE, Krieger AM, Wind Y (2001) Thirty years of conjoint analysis: Reflections and prospects. Interfaces 31: S56-S73.
- Gofman A, Moskowitz H (2010) Isomorphic permuted experimental designs and their application in conjoint analysis. Journal of Sensory Studies 25: 127–145.
- Brunken R, Plass JL, Leutner D (2003) Direct measurement of cognitive load in multimedia learning. Educational psychologist 38: 53–61.
- Jain AK, Murty MN, Flynn P (1999) Data clustering: a review. ACM computing surveys (CSUR) 31: 264–323.
- Bakhtin M (1984) Rabelais and his world (Vol. 341). Indiana University Press.
- Van Deursen AJ, Bolle CL, Hegner SM, Kommers PA (2015) Modeling habitual and addictive smartphone behavior: The role of smartphone usage types, emotional intelligence, social stress, self-regulation, age, and gender. Computers in human behavior 45: 411–420.