Introduction
Healthcare systems are under siege globally regarding technology adoption; the recent pandemic has only magnified the issues. Providers and patients alike look to new enabling technologies to establish real-time connectivity and capability for a growing range of remote telehealth solutions. The migration to new technology is not as seamless as clinicians and patients would like since the new workflows pose new responsibilities and barriers to adoption across the telehealth ecosystem. Technology-mediated workflows (integrated software and personal medical devices) are increasingly important in patient-centered healthcare; software-intense systems will become integral in prescribed treatment plans [1]. My research explored the path to ubiquitous adoption of technology-mediated workflows from historic roots in the CSCW domain to arrive at an expanded method for evaluating collaborative workflows. This new approach for workflow evaluation, the Collaborative Space – Analysis Framework (CS-AF), was then deployed in a telehealth empirical study of a hypertension exam workflow to evaluate the gains and gaps associated with a technology-mediated workflow enhancements. My findings indicate that technology alone is not the solution; rather, it is an integrated approach that establishes “relative advantage” for patients’ in their personal healthcare plans. Results suggest wider use of the CS-AF for future technology-mediated workflow evaluations in telehealth and other technology-rich domains.
Need for a Collaborative Evaluation Framework
The adoption of new technology has permeated every aspect of our personal and professional lives with the promise of performing work processes more efficiently and with greater capability. In 1984, the term, “computer-supported cooperative work,” (CSCW) was coined by Grudin [2:19] in order to focus on the “understanding of the way people work in groups with enabling technologies,” i.e., technology-mediated workflows. My research built on the core CSCW mission with an updated context for CSCW to include the seamless integration of the three key elements of infrastructure, interaction (i.e., collaboration), and informatics into a system aimed at improved efficiency and expanded capability. New technologies impact the way we function in our daily lives – both from a personal perspective as consumers and in our professional lives as knowledge workers. The integration of new technology into collaborative workflows introduces many variables of great concern to companies, organization, and individuals (e.g., costs of development, switching costs associated with migrating from the current workflow to a new technology-mediated workflow, and details of how the new workflow functions, compared to the current workflow). What processes should be avoided? What should be retained? What should be revised? How is user behavior associated with adoption of the new technology? Organizations have a difficult time determining the scope of a new technology initiatives, including how the capability and complexity of new technology will provide measurable benefit (i.e., relative advantage) in some quantified or qualified way, compared to the existing workflow (Figure 1).
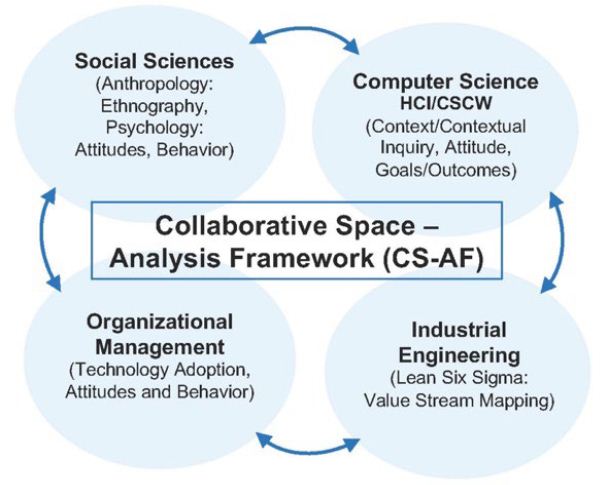
Figure 1: Cross-disciplinary domains incorporated into the CS-AF [3]
A need is apparent for a cross-disciplinary generalizable approach to evaluate a collaborative technology-mediated workflow that focuses on a specific task to be done in a specific workflow – a model that incorporates a view at the current approach, compared to the enhanced approach resulting from the new technology. My research incorporated collaborative evaluation metrics from Computer Science/Human Computer Interaction (CSCW/HCI), Behavioral Sciences, Organizational Management, and Industrial Engineering (IE) domains to formulate an evaluation model and methodology (Collaborative Space – Analytical Framework, CS-AF) and tests this framework with a comprehensive empirical study for hypertension exam workflow.
Collaborative Workflow Evaluation – Related Works
CSCW strives to incorporate a wide terrain of interdisciplinary interests, thus establishing a single generalizable model to evaluate “collaborative activities and their coordination” [4] has been difficult. Historically, CSCW tends to focus on qualitative research guided by frameworks with varying degrees of flexibility. Neal et al. suggest that there are three types of CSCW frameworks that emerge from CSCW research: methodology-oriented, conceptual, and concept-oriented. Each CSCW framework type has a valuable focus, but no single framework addresses the full range of CSCW needs [5,6]. To this day, CSCW and HCI continue with heightened interest to understand the obstacles and opportunities associated with integrating technology-mediated enhancements into existing workflows in order to promote a better collaborative experience [1]. Two important perspectives emerge: the evaluation and measurement of the impact that technology-mediated enhancements have on humans, both individually and collaboratively, and the impact that new technology has on the organization, which ultimately equates to a financial impact. The primary contributions of Weiser, one of the original authors of “ubiquitous computing,” is the promotion for ethnomethodologically-oriented ethnography, which “ … reveal[s] that it is not the setting of action that is the important element in design, but uncovering what people do in the setting and how they organize what they do” [7:399]. Goulden et al. posit the importance of ethnographic research in computer science [8]. Conducting ethnographic work practices research with a scientific methodology to observe the user of a workflow in the natural state, while incorporating the principles of reflexivity, was a complementary element of my research. This important contribution from the social sciences domain fortifies the methodology and goals of this research towards a generalizable model to observe and to analyze collaborative workflows in multiple domains [9]. The integration of reflexivity into ethnographic practice enables a closed-loop process for semi-structured field engagement, based on theoretical process that iteratively informs the next field engagement [10]. Peneff suggests that ethnographic researchers need to cope with the ad hoc nature of field settings by “formalizing tasks in a manner naturalistic enough that the human participant might engage as if it was a conversation with a trusted acquaintance” [11:520]. Computing systems from their inception purport a value proposition of efficiency, expanded capability, and collaborative integration for the benefit of both humans and the organization. Carroll defines the mission of HCI as “… understanding and creating software and other technology that people will want to use, will be able to use, and will find effective when used…We (CSCW) will most likely need to develop new concepts to help us understand collaboration in complex organizations” [12:514]. Weiseth et al. posit that organizations must “take action and make it possible for people to collaborate in effective ways” [13:242]. The researchers suggest that organizations must provide collaborative support in the form of organizational measures (collaborative best practices), services (collaborative process), and tools (collaborative methods) to enable technology-mediated workflow enhancements. Weiseth et al. introduced the Wheel of Collaboration Tools as a topology of collaborative functions in efforts to illuminate the important connection between the subtle day-to-day collaborative activities of workers and the integration of the “system” (infrastructure, content [information/informatics], and human-interface) for collaborative gain [13]. Neale, Carroll, and Rosson introduce the “Activity Awareness Model” and identified three historic issues associated with evaluating collaborative workflows: logistics of remote locations, complex number of variables, and the need to validate the re-engineered of future-state workflow [5]. “Few methods have been developed with creating engineering solutions in mind. It is possible, but researchers must be continually cognizant about how data collection and analysis methods will translate into design solutions” [5:114]. The re-engineered workflow needs to be examined in its natural setting in order to understand the collaborative impact of the technology-mediated enhancements and that this is the “central priority in CSCW evaluation.” In order to accomplish the goals of ubiquitous computing and deliver collaborative human-computer interactive systems, a comparative evaluation of incremental improvements made through each technology-mediated transformation is important [14]. Kellogg et al. posit that success in HCI comes from “immersive understanding of the ever-evolving tasks and artifacts” [15:84]. Millen et al. state that understanding the context of the user environment and interaction is increasingly recognized as a key to new product innovation and good product design [16]. A need is apparent for a generalizable approach to evaluate a collaborative technology-mediated workflow that focuses on a specific task to be done in a specific workflow – a model that incorporates a view at the current approach, compared to the enhanced approach as a result of the new technology. Arias et al. suggest that a shift to intended use or intended work vs. the computing system is necessary [17]. Baeza-Yates posits that future work should focus on the research method, the data collection, the data analysis, and the domain of study [18]. Plowman, Rogers, and Ramage add that designers might attend to the “work” of the setting, as well as the interactional methods or practices of the members as the work is being performed. The “job of work” in the “work of a setting” are the actions and interactions that inhabit and animate the work setting [19,20]. CSCW and HCI involve the integration of many unique disciplines; therefore, accurately framing the environment and conditions associated with the targeted cooperative work is necessary for a precise evaluation [16,21]. Millen states that “understanding the context of the user environment and interaction is increasingly recognized as a key to new product/service innovation and good product design” [16:285]. CSCW and HCI conceptual models help researchers formulate a framework to describe a particular context in focus [22]. Neale et al. posit activity awareness as an overarching concept to describe a comprehensive view of collaboration from the activity perspective [5,6]. The research of Neale et al. attempts to identify the relationship between important collaboration variables; contextual factors are foundational, and work coupling is assessed from loosely to tightly coupled, depending on the distributed nature of the work. The research posits that the more tightly coupled the work, the more cooperative and collaborative it needs to be in order to be effective. The research is intended as a “step in the direction of better approaches for evaluation of collaborative technologies” [5,6]. The Model of Coordinated Action (MoCA) is another conceptual model developed for framing the context of complex collaborative situations [23]. A new model is needed beyond the focus on work or technology to include rapidly increasing diversity of socio-technical configurations. The MoCA ties together the significant contextual dimension that have been covered in CSCW and HCI literature into one integrated contextual model. The MoCA provides a way to tie up many loose threads. It provides “conceptual parity to dimensions of coordinated action that are particularly salient for mapping profoundly socially dispersed and frequently changing coordinated actions” [23:184]. Lee and Paine suggest that this model provides a “common reference” for defining contextual settings, “similar to GPS coordinates” [23:191].
The primary focus of Davis’s TAM (Technology Assessment Model) and its wide-scale use is the parsimonious focus on two primary vectors used to evaluate adoption: Ease-of-Use (EU) and Perceived Usefulness (PU) [24]. At the most basic level, humans look for two resonating value propositions from new technology: an easy and more efficient way to perform an existing task, and/or opportunities for new features previously unavailable to them [24]. Davis et al. state that the “goal of the TAM is to be capable of explaining user behavior across a broad range of end-user computing technologies and user populations, while at the same time being both parsimonious and theoretically justified” [24:985]. The TAM is easy to understand and deploy, and it has been adapted by other researchers to include additional attributes that deliver complementary determinants [24]. The first modified version of the TAM was proposed in 2000, also by Davis and Venkatesh, to address two primary areas: (1) to introduce new determinants; to uncover social influences and “cognitive instrumental processes” and (2) to provide a view at specific time intervals that were meaningful to users associated with determining technology acceptance [25:187]. The notion of conducting a time view at key intervals of adoption has been a particular interest of mine. In TAM 2, Davis and Venkatesh evaluate three time-intervals (pre-implementation, one-month post-implementations, and three- month post-implementations); this approach provides a valid snapshot, yet it does not go far enough to establish a detailed quantitative baseline measure that can be easily compared in a complementary sense with the qualitative survey questions. It is my belief that there is an opportunity for improvement to the TAM with more a rigorous time-interval evaluation using the Industrial Engineering (IE) technique of Value Stream Mapping (VSM). VSM, combined with TAM and other components, will address limitations expressed with the TAM approach and introduce a much-needed task orientation to the evaluation. Specifically, this research incorporated the integration of the VSM approach used in Industrial Engineering to complement the evaluation breadth of the TAM. VSM incorporates quantitative time-series data into the analysis of workflow at the task-level which fortifies weakness identified with TAM and other less rigorous approaches. The TAM can also be extended to include the USE questionnaire developed by Lund 2001 [26] to uncover the relationship among Ease-of-Use, Perceived Usefulness, Satisfaction, and Ease of Learning. The USE questionnaire is used to gauge the user’s confidence in the system. The results of the USE analysis are represented in a four-quadrant radar chart. The percentage of positive reactions is based on the maximum percentage of positive feedback from the user experience. When the USE questionnaire is combined with traditional TAM questions and other evaluation metrics, such as Net PromoterÔ [27], a more comprehensive view of each user’s perspective toward the new technology can be identified and analyzed.
Health Information Technology (HIT) Related Works
The HIT domain, like many other collaborative workflow domains, is charged with the complex task of vetting the emerging needs of users (i.e., patients and practitioners) and of assessing opportunities for new technologies that might be integrated to deliver better efficiency, new capability, or both. The patient-centered healthcare approach assumes expanded participation and collaboration by doctors and patients, yet is riddled with gaps in the processes, technology, and human computer interaction (HCI) necessary for optimum workflow. Technology adoption opportunities in this space are complicated by the collision of consumer electronics technology with HIT. Wide-scale adoption of micro-health devices and Web surfing for health and wellness information are mainstream consumer-patient activities. Simultaneously, hospitals and practitioners strive for improved connectivity through patient-portals enabled through Electronic Health Records (EHR), integration of high-tech equipment, and mining of big data as means to advance services, while making them more patient-centered. The HIT domain is a complex domain with tremendous needs for constant evaluation and advancement with new technology. Patients actively seek more information on medical conditions, lifestyle information, treatment protocols, and natural versus prescription options, etc. Websites such as WebMD provide rich content that patients actively seek in an effort to reconcile various healthcare information options. Pew Research found that “53% of internet users 18-29 years old, and 71% of users 50-64 years old have gone online for health information” [28]. Further integration complexity is introduced for patients with the growing number of personalized microsensor devices available. Real-time patient data from non-clinical sources, such as microdevices, has potential to enhance patient-centered care, yet clinicians are not inclined to reference that data, since there is no standardization of the data nor of the interface. Estrin states that we need to capture and record our small data. “Systems capture data reported by clinicians and about clinical treatment (EHR), not patients’ day-to-day activities” [29:33]. The microdata from daily activities can be leveraged with other data to provide a 360-degree patient view. Winbladh et al. state that “patient-centered healthcare puts responsibility for important aspects of self-care and monitoring in patients’ hands, along with the tools and support they need to carry out that responsibility” [1:1]. Patients armed with rich content pose a unique collaborative problem for practitioners, who must now deal with the reconciliation of non-doctor-vetted content with patients. Research conducted by Dr. Helft, University of Indiana, found that “when a patient brings online health information to an appointment, the doctor spends about 10 extra minutes discussing it with them” [30]. Neel Chokshi, MD, the Director of the Sports Cardiology and Fitness Program at Penn Medicine’s research team, “we haven’t really told doctors how to use this information. Doctors weren’t trained on this in medical school” [31,32:2]. Collaboration is the fulcrum point for enabling optimized workflow in HIT systems. A complete understanding of collaboration is essential in order to refine certain aspects of the workflow that affect a streamlined process. Weir et al. provide a functional definition of collaboration as “the planned or spontaneous engagements that takes place between individuals or among teams of individuals, whether in-person or mediated by technology, where information is exchanged in some way (explicitly, i.e., verbally/written; or implicitly, i.e., through shared understanding of gestures, emotions, etc.), and often occur across different roles (i.e., physician and nurse) to deliver patient care” [33:64]. Skeels and Tan found that more collaborative communications across the “care setting” can provide a large impact on the quality of services for patients [34]. Successful integration of personalized health data with other meaningful data sources is an important HCI requirement for end-to-end HIT solutions. Eikey et al.’s systematic review of the role of collaboration in HIT over the past 25 years comprised a list of 943 articles with HIT collaboration references; the compilation was refined to 224 articles that were reviewed, analyzed, and, categorized [35]. Their study summaries a composite view into the key elements that affect collaboration in HIT with their Collaborative Space Model (CSM) (Figure 2).
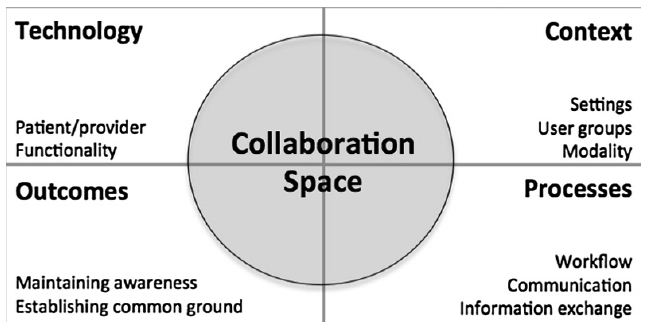
Figure 2: Eikey et al.’s HIT Collaborative Space Model [35]
The CSM illustrates a foundational view summarized by the researchers as a starting place for future investigation into the critical dynamics of collaboration in HIT. Although the CSM is a useful reference model for categorizing the various aspects of collaboration, based on a systematic HIT literature review, the model was not field tested, and does not cover attitude and behavior perspectives. Eikey et al. suggest that future research should “focus on the expanded context of collaboration to include patients and clinicians, and collaborative features required for HIT systems” [35:274]. This research builds on the observations of Eikey and others in the HIT domain, with the introduction of a cross-disciplinary evaluation framework (CS-AF) and field engagement methodology. Prior to conducting this hypertension exam workflow study, a complete pilot study was conducted in the graphic arts domain to test the CS-AF approach [36]. Increased focus and demand in telehealth has heightened the need for continuous monitoring and improvement to the doctor-patient collaborative workflows in telehealth. Piwek et al. posit that “moving forward, practitioners and researchers should try to work together and open a constructive dialogue on how to approach and accommodate these technological advances in a way that ensures wearable technology can become a valuable asset for health care in the 21st century [37]. In the research of consumers’ adoption of wearable technology, Kalantari et al. suggest that future research should test “demonstrability” (i.e., whether the outcome of using the device can be observed and communicated), mobility, and the experience of flow and immersion when using these devices [38]. The objective for this research was to utilize the CS-AF and methodology to evaluate doctor-patient collaborative workflow for hypertension by using a blood pressure device and a smartphone app that is common to doctors, and most importantly, by incorporating doctors and their patients in this empirical study. This research and empirical study included the documentation and analysis of the current hypertension workflow for a set of patients and two medical doctors using the CS-AF, the development and integration of a technology-mediated workflow that would be introduced to the same set of users, and the analysis of both the current and technology-enabled workflows using the CS-AF.
Current-state Workflow: Hypertension (Blood Pressure) Exam
The current or baseline hypertension (i.e., blood pressure) exam workflow incorporates a clinician and outpatients needing their blood pressure (BP) measured (i.e., a current-state workflow). One dilemma associated with hypertension treatment is the obtaining of timely and accurate patient BP readings. The current workflow requires patients to visit their doctor’s office for a BP reading. This current-state workflow process is time-consuming and riddled with issues affecting the accuracy of readings (time-of-day fluctuations, “white-coat hypertension”, food consumption or hours of sleep) [39]. From a doctor’s perspective, there is no current way to view and analyze patient-introduced microdevice BP data in the context of their standard practice and workflow. Their only way of collecting patient BP data is an office visit, a time-consuming and prohibitive practice when close monitoring of hypertension patients happens on a more frequent basis. The American Heart Association’s protocol is: take two BP readings first thing in the morning (before food or medication), one minute apart, then averaged, followed by two readings at the end of the day (before bed), one minute apart, then averaged. The a.m. and p.m. averages are then averaged for the daily BP reading [40,41]. This would be impossible in an in-office setting. Patient reading of BP data, while extremely valuable (i.e., timely and accurate) when compared to in-office BP data, is not well-integrated within the doctors’ standard workflow, nor does it provide real-time visibility or opportunities for doctors to collaborate with patients. This research included an empirical study of 50 hypertension patients, assigned as “matched pairs” by gender and age bands. The matched pairs were evaluated on the current state BP exam workflow for hypertension, introduced an alternative workflow: “technology-mediated” or “manual workflow” (control group). A second evaluation to determine the gains and gaps between the two pre- and post-hypertension exam workflows was also conducted. This research introduced the Collaborative Space-Analysis Framework (CS-AF) and methodology as means to measure and evaluate alternative workflows (technology-mediated and manual), compared with a baseline workflow, through a cross-disciplinary set of evaluation metrics. The technology-mediated workflow designed for this study attempts to address the problems identified in the current-state workflow with the development of a custom-designed Apple/Android smartphone app (Wise&Well) integrated with the Omron BP Monitor to facilitate a remote asynchronous hypertension exam telehealth workflow.
Collborative Space – Analyis Framework (CS-AF) Model and Methodology
Collaborative Space – Analysis Framework
The CS-AF methodology is utilized onsite where work gets done.
It comprises a carefully integrated set of cross-disciplinary components that have been purposefully selected to enhance the view that any one single approach has on its own and to integrate the complementary attributes that each of these best-in-class models generates. The CS-AF’s five areas of investigation are Context, Process, Technology, Attitude and Behavior, and Outcomes.
CS-AF: Context Determinants
The Model of Coordinated Action (MoCA) was developed for framing the context of complex collaborative situations [42]. The seven dimensions of MoCA (Synchronicity, Distribution, Scale, Number of Communities of Practice, Nascence, Planned Permanence, and Turnover) provide researchers, developers, and designers with a vocabulary and range of concepts that can be used to tease apart the aspects of a coordinated action that make them easy or hard to design for” [42:191]. Using the MoCA as a standard component of the CS-AF fortifies the overall framework with a practical and structured approach to capturing the workflow context.
CS-AF: Process Determinants
The IE workflow analysis method of Value Stream Mapping (VSM) has been incorporated into the CS-AF [43], [44,45]. VSM incorporates a hierarchical task analysis technique to uncover a quantitative view of the workflow from a cycle-time perspective (by task) and qualitative measures of the information quality at each workflow juncture.
For the empirical study conducted for this research, logical workflow steps were defined. The research engaged users with semi-structured observation, and structured and unstructured questions associated with each step in the workflow and the overall workflow experience. [45-50].
CS-AF: Technology Determinants
The Technology Acceptance Model (TAM) introduces two crucial constructs aimed to uncover user perspectives related to the adoption of technology. Does the technology enhance the workflow and deliver a more useful and easier to use solution? Davis et al. believed that the two determinants, Perceived Usefulness (PU – enhancement of performance) and Perceived Ease of Use (PEU – freedom from effort), are the essential elements of technology acceptance, and when coupled with a view of the user’s attitude toward using the technology, provide a parsimonious and functional model that can deliver a meaningful evaluation of technology adoption [51]. The survey approach used in empirical studies for the original TAM can be complemented with Lund’s USE questionnaire [52]. When TAM survey questions surrounding PU and PEU are complemented with two other determinants (Satisfaction and Ease-of-Learning), a more comprehensive evaluation of the collaborative experience can be collected, analyzed, and compared. The CS-AF also integrates the TAM approach with the USE questionnaire, represented in a 4-facet radar chart that provides the researcher with a visual representation of each facet simultaneously [52].
CS-AF: Attitude & Behavior Determinants
Establishing a baseline view of the workflow from several vantage points, then capturing an updated view of the same workflow from the same metrics for new technology-mediated improvements enables a meaningful comparison and respects the research principles suggested by Ajzen et al. [53]. They establish four different elements from which attitudinal and behavior entities may be evaluated: “the action (work task), the target at which the action is directed, the context in which the action is performed, and the time at which it is performed” [emphasis theirs] [53,54]. These four elements have been incorporated into the CS-AF. The original TAM includes evaluation of Attitude Towards Using and Behavioral Intent to Use determinants adapted from Ajzen, et al. [53,54]. In order to collect an expanded assessment of the user’s perspective towards the workflow, the baseline TAM attitude and behavior constructs are complemented in the CS-AF by additional semi-structured qualitative questions. CS-AF also incorporates the Net Promoter ScoreÔ (NPS) [55] in attempts to further understand the Attitude determinant [51]. It measures how likely users are to promote the product to others in their circle of influence.
CS-AF: Outcomes Determinants
Critics of the TAM believe that putting too much weight on external variables and behavior intentions, and not enough on user goals in the acceptance and adoption of technology, is a limitation of the TAM [56,57]. The CS-AF incorporates a provision to evaluate user goals leveraging CSCW/HCI concepts in awareness and goals setting established in the Activity Awareness Model [56,58]. The five elements of the CS-AF (Context, Process, Technology, Attitude and Behavior, and Outcomes) are integrated with a field survey and statistical evaluation methodology for empirical studies of collaborative workflows (Figure 3).
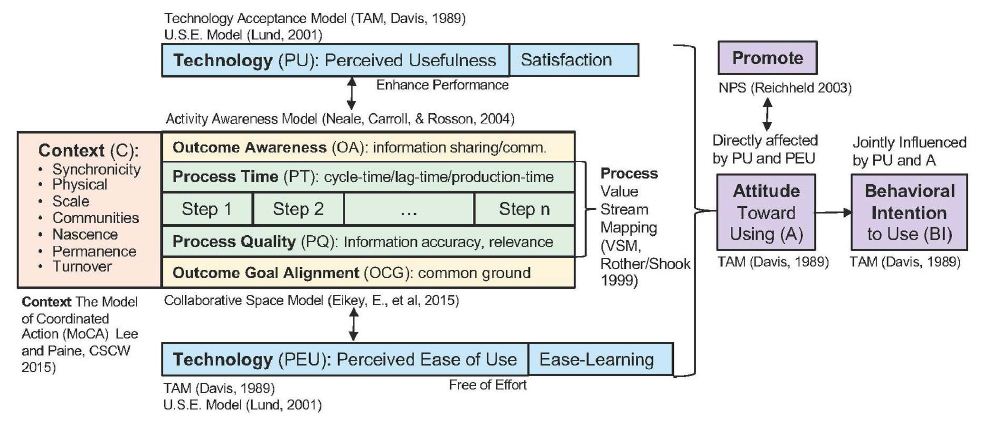
Figure 3: Collaborative Space – Analysis Framework [3]
CS-AF Field-Engagement Methodology
All information was collected on-site through detailed workflow audits and semi-structured interviews following the CS-AF survey instrument with the participants in the workflow. The research also requires a development and implementation phase whereby the technology-mediated enhancements are integrated into the workflow. Following the transformation of the collaborative workflow, the same participants are re-evaluated using the same CS-AF survey instrument and procedures. When all the data for both the current-state and technology-mediated collaborative workflows are collected, the two workflow scenarios are evaluated and analyzed, and a summary perspective is derived. The CS-AF methodology includes five sequential steps [36] (Figure 4).
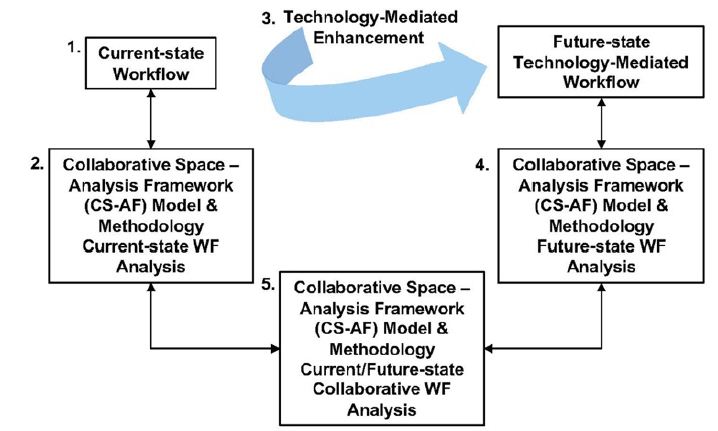
Figure 4: Bondy’s CS-AF Field Study Methodology [3]
Field Trial Step 1
Immersive discovery in the target domain. Ethnographic analysis of the target workflow, including contextual inquiry, work-task analysis, use-case modeling was conducted to determine the specific workflow steps and existing user requirements. From this immersive discovery, the CS-AF survey instrument is adjusted to represent the specific steps for the targeted workflow. The hypertension exam workflow included five workflow steps (Pre-Visit, Registration, Exam, Treatment, and Post-Visit).
Field Trial Step 2
Baseline evaluation (all 50 test participants) using the CS-AF survey instrument for the current-state in-office BP exam workflow.
Field Trial Step 3
Participants randomly assigned to two groups that incorporate the alternate workflows to be evaluated.
Group 1: Manual BP exam workflow (control group)
Group 2: Technology-mediated BP exam workflow
Field Trial Step 4
All test participants (both Group 1 and Group 2) conducting a second CS-AF evaluation survey using the same CS-AF survey instrument as was used for the baseline.
Field Trial Step 5
Systematic analysis of the survey data recorded from the two surveys, including a comparison of the between and within groups across each of the determinants.
CS-AF Statistical Analysis Methodology
The CS-AF survey instrument is an integrated set of qualitative statements ranked by participants using a 7-point Likert scale (from 1- Extremely Easy through 7 – Extremely Difficult) for the five major areas of investigation (Context, Process, Technology, Attitudes & Behaviors, and Outcomes). The survey instrument incorporates single-response statements such as “How easy-to-use is the technology that is incorporated in each step of the ‘at home’ manual BP exam workflow to you?.” For this research, with validation of a normal distribution, a parametric repeat measures ANOVA (rANOVA) was run across five workflow stages for each group. When rANOVA within and between groups analysis generates significant p-values <0.05, subsequent 2-sample matched-pairs t-test was used to analyze whether there is statistical evidence that the mean difference between paired observations on a particular outcome is significantly different from zero for specific group-to-group analysis at the determinate or dependent variable level.
CS-AF Statistical Basis and Analysis Procedure
The CS-AF survey data was collected for both the pre- and post- workflow trials for Group 1 and Group 2, and the following analysis (as shown in Figure 4 and described in more detail in Section 3.1.1) was conducted using the CS-AF survey data (Figure 5).
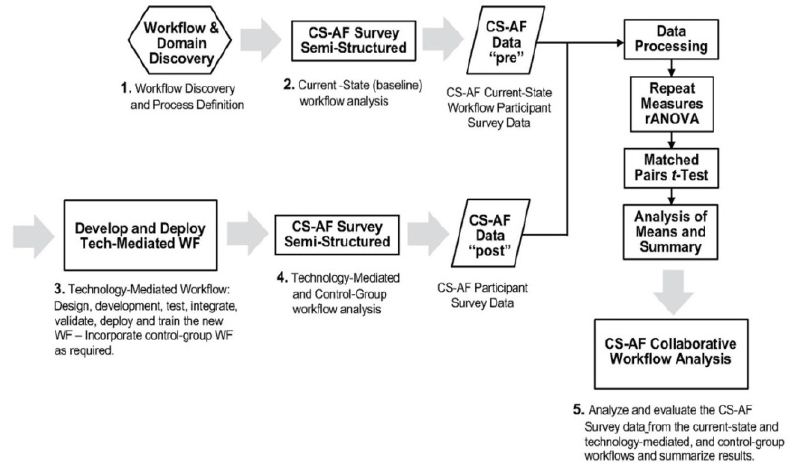
Figure 5: CS-AF statistical analysis process [3]
Empirical Study: Pre-Post-Hypertension Exam Workflow
The baseline (current-state) workflow analysis of 50 hypertension test participants (selected on age/gender) was conducted using the CS-AF survey instrument, followed by a random selection of one participant from each pair to the manual workflow (control group) and one to the technology-mediated workflow. The field engagement was completed via a second survey of all participants, enabling a thorough evaluation, comparison, and analysis of the current-state workflow, compared to the alternative workflows using the CS-AF survey instrument (baseline workflow vs. the manual and technology-mediated workflows).
CS-AF Field Methodology (Survey Instrument and Test Protocol)
The CS-AF survey instrument incorporated 104 (7-point) Likert-scale questions, 20 quantitative time-series questions, and 15 subjective questions across the five components of the CS-AF. The CS-AF survey questions are revised for any empirical study to reflect the unique steps in the workflow; the exact same survey is used for the pre-/post-surveys. All participants were trained on the survey and associated workflow technology via remote video sessions for each group, and responded to the CS-AF surveys via an online digital survey platform.
The target sample size was 50 participants – 25 matched-pairs, matched on gender and 1 of 6 age bands. Of the 80 participants who were recruited, 50 were selected; all 50 participants completed the study. The hypertension exam workflow study included a baseline evaluation and survey of the current in-doctor’s-office blood pressure (BP) exam by all 50 test participants. Participants were randomly divided into two groups based on their specific matched-pairs (described above). The participants in the manual workflow group (Group 1 – control group) were assigned a wrist-cuff blood pressure device. Those in the technology group (Group 2) were assigned a Bluetooth wireless bicep-cuff blood pressure device and a blood pressure app (iOS/Android) developed specifically for this study. The clinician team involved in the study participated with patients directly during the baseline BP exam workflow and remotely through the app (BP alerts and doctor push messages) for the technology-mediated workflow, and with limited interaction for the manual wrist-cuff workflow. All test participants attended a training session on specific test protocol and operational use of the systems they were provided. All 50 test participants conducted twice-daily BP readings per the American Heart Association’s BP reading protocol [41]: two in the am (1 minute apart) and two in the pm (1 minute apart). All BP data was averaged for each day based on those four BP readings. Participants from Group 1 and 2 completed a second CS-AF survey (identical to the first), following a three-week trial period. The CS-AF survey data was analyzed within groups and between groups. The hypertension exam workflow survey dataset comprised the analysis of 10,400 Likert-scale questions, time-series data, and 1500 subjective responses.
Sample Size and Participants
The sample-size determination for the two-sample, paired t-test is estimated by the following process, resulting in a sample-size of approximately 25 pairs.
- Type I error rate alpha = 0.05 (default value in most studies)
- The least power of the test wanted to achieve (=70%)
- Effect size (here, for example, = 0.5, for a pilot study to estimate this effect size)
- Standard deviation of the change in the outcome (for example, = 1; a pilot study can be used to estimate this parameter).
To conduct a matched-pair t-test based on age and gender, 25 pairs of male and female patients were needed. A minimum of four male and four female hypertension patients from each of the six age bands were selected for this study; there was a minimum of 25 pairs or 50 patient-participants. Within each pair, subjects were randomly assigned to two groups (Group 1: manual workflow and Group 2: technology-mediated workflow). Based on the data, a paired test could be performed to evaluate the response values between the baseline workflow of two groups and their respective manual workflow vs. technology-mediated workflow. The hypothesis examined the difference of the observation means between two groups. If the assumption of a normal distribution of the differences was unjustified, a non-parametric paired two-sample test (Wilcoxon matched-pairs signed-ranks test) would be performed [59-64]. Following the initial data collection for the current-state BP exam workflow using the CS-AF survey instrument and training on the manual or technology-mediated workflows, respectively, test participants conducted twice-daily readings (two per interval) for a three-week period following a consistent BP measurement procedure. The three-week test period duration was followed to adequately accommodate a complete technology adoption-cycle (introduction, highly motivated use, through acceptance, and tailing-off of use) [65,66].
Baseline – Current-state Hypertension (BP) Exam Workflow
For the current-state (in-office) hypertension workflow, the completed preliminary field work involved shadowing and recording the specific sequential steps as a silent observer. Care was taken for this preliminary analysis to observe the natural setting and hypertension reading process in an obstructed manner with no interactions with the administrative staff, patient, nor clinician. The discrete workflow steps identified for the hypertension exam workflow were defined as a result of the initial field analysis and were reviewed for completeness with the doctors participating in this study.
This current-state hypertension exam workflow process established for this empirical study followed these steps:
- Pre-Visit: Patient or Doctor determines the need for an in-office BP reading and schedules the appointment with the administrative staff.
- Registration: For the appointment, the patient arrives at the doctor’s office and checks-in at the registration desk. Following check-in, the patient waits for a clinician to conduct the BP exam.
- Exam: The clinician leads the patient to the examination room and conducts the BP exam. After completing the BP exam, the clinician advises the doctor that the exam is complete.
- Treatment: The doctor enters the examination room, greats the patient, reviews the BP exam results, and discusses the results and possible follow-up treatment plan with the patient.
- Post-Visit: The doctor updates the patient’s electronic health record, and patient checks out with the administrative staff, leaves the office, and completes any follow-up treatment prescribed by the doctor (e.g., self-treatment; follow-up visits with the doctor, lab, or specialists) (Figure 6).
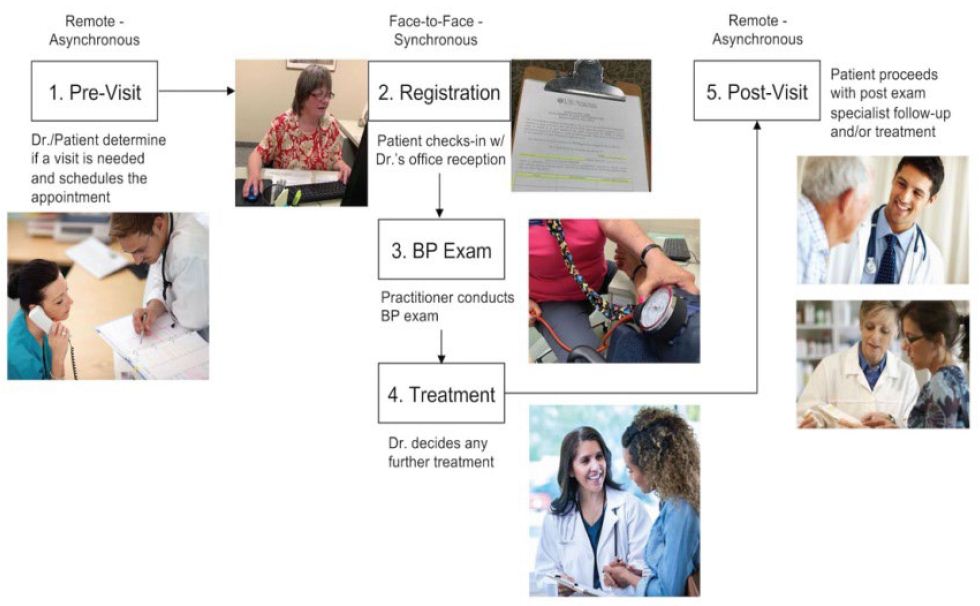
Figure 6: Current-state (baseline) Hypertension Exam Workflow
Manual Workflow (Control Group)
The manual hypertension BP exam workflow was used to establish the control group for the field trial (Group 1). Patients enrolled into the manual BP workflow group received a personal wrist-cuff BP monitor device, along with instructions and a daily BP log form to manually record daily BP readings. Test participants enrolled into the manual BP exam workflow followed a daily BP exam workflow; all BP readings performed on the wrist-cuff BP monitor were recorded manually on the log form that provided to each participant. Test participants conducted two a.m. BP readings, then took those the values and divided them by two, then wrote that a.m. average on the form; those participants completed the exact same procedure for the two p.m. BP readings. Manual BP test participants (Group 1) received an online video training session, accompanied by a printed instructional manual that describes the daily procedure to be followed for the manual BP workflow process (Figure 7).
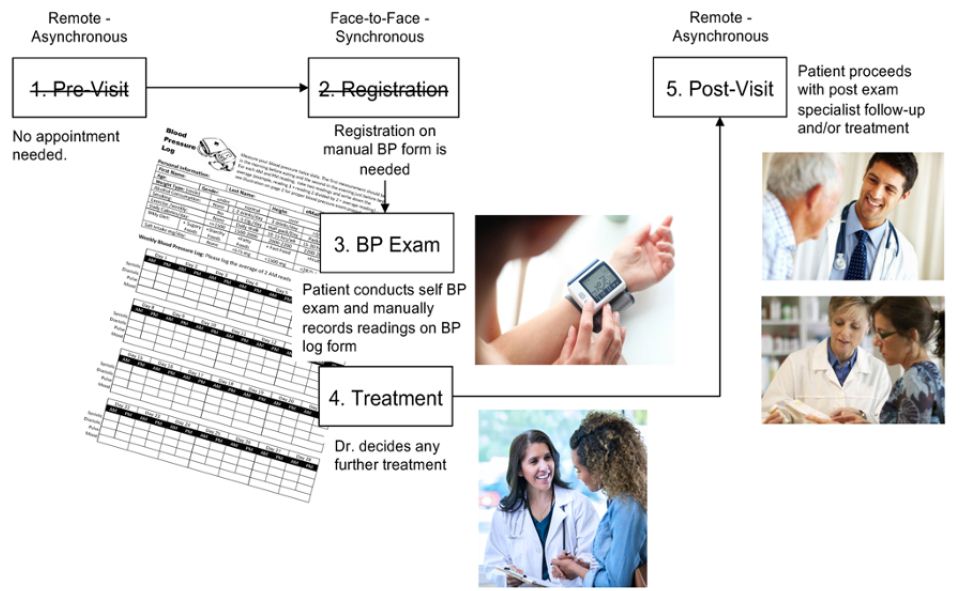
Figure 7: Manual BP Exam Workflow (Group 1)
Technology-Mediated Workflow
The technology-mediated BP exam workflow development goals are to enable a more streamlined and collaborative workflow that addresses both the needs of the doctor and those of the patient together in an integrated experience. The Wise & Well Blood Pressure Monitor (WW-BPM) was designed to facilitate the timely and accurate BP reading, and the communication of patient BP data in real time to the patient’s doctor in a collaborative application that enables doctor-patient interaction. The WW-BPM user interface allows users to monitor the statistics of their BP readings. To provide a more accurate representation of the patient’s true BP, the readings are averaged daily. The application also delivers this BP data and notices to the doctors when patients’ BP readings are elevated beyond an acceptable range. Based on their specific health profile, patients also received wellness data associated with hypertension accelerators (e.g., smoking, salt intake, diet, exercise, weight, and alcohol consumption). To facilitate future informatics portraying the functional use of the system, the application incorporated a database of transactions that can be further monitored and analyzed. Technology introduced in this research (Omron BP monitor and the Wise & Well BP Monitor (WW-BPM) that is integrated with the patient’s doctor) reflected in the technology-mediated workflow to follow, as shown in Figure 8. A complete Design Verification test and Usability Test was conducted for the technology-mediated workflow prior to formal engagement with test participants (Figure 8).
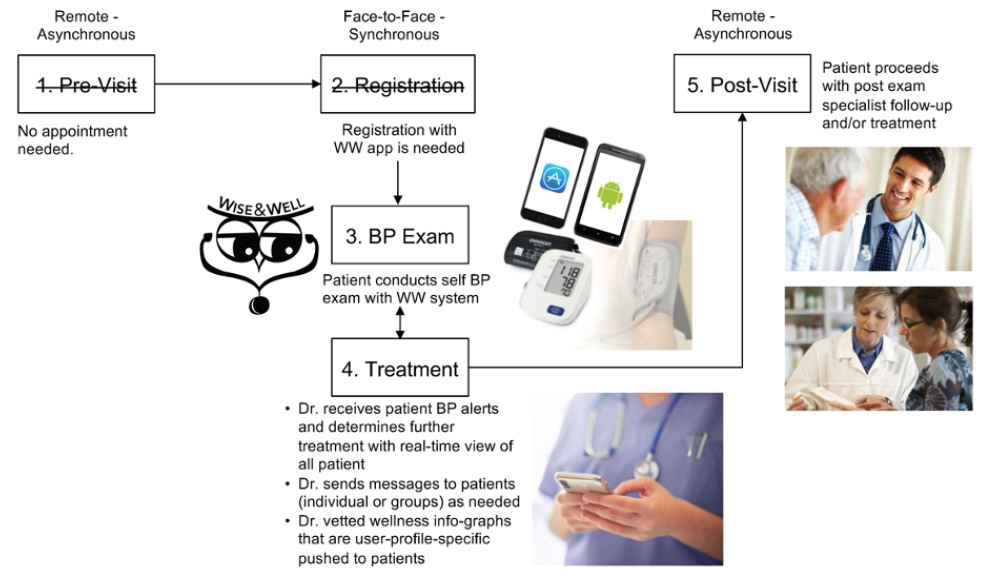
Figure 8: Technology -Mediated BP Exam Workflow (Group 2)
Results and Analysis
The CS-AF Summary Scorecard incorporates summary ratings of each workflow evaluated with metrics from the CS-AF, including a color-coded visualization of the progress of each key metric toward the ultimate goal of a highly adopted solution by participants across all facets of the CS-AF (Context, Process, Technology, Attitude and Behavior, and Outcomes). The rANOVA was incorporated to compare mean values for each CS-AF determinant within and between groups. When statistically significant change in mean values occurred (p-value <0.05), further pair-wise t-test analysis was conducted to compare means at the workflow stage-level; positive and negative changes in mean values were recorded as a method for evaluating the gains and gaps between the workflows tested. This statistical approach proved to be a valid and replicable method for evaluating the workflows studied. From subjective questions across the five sections of the survey, participants expressed further details regarding each CS-AF aspect in question. Results were collected and analyzed to determine significant themes that might complement or contradict the statistical findings from the Likert-scale survey mean-data previously analyzed via rANOVA and paired t-test.
Within Group 1 Summary Analysis
The Context for the manual BP exam workflow, compared with the respective baseline, indicates an expected shift to a remote asynchronous workflow, which is indicative of a self-exam context. This manual workflow has transformed to become more distributed across more locations, with fewer participants and communities of practice, somewhat more developing and short-term in nature, and with less turnover than for the baseline workflow. There were no surprises with these results; Group 1 responded as predicted. CS-AF reveals a marked improvement in the Process times of the manual workflow, compared with the baseline, as participants recorded dramatic time reduction and overall workflow optimization. The enabling of the manual workflow to conduct the BP exam at home and on their own was the primary reason for the time optimization. However, the manual solution required recording of BP data by hand and no contact with clinicians, which translated to minimal impact of the relevance and importance of the BP information obtained versus the baseline. From a technology adoption perspective, participants did not view the manual BP exam process (device and procedure) to be particularly “useful” or “easy to use”. In fact, participants actually felt the process was less useful and easy to use than the traditional in-office BP exam. Further exploration using the USE model did show participants to be more satisfied with the manual BP workflow, yet felt that the workflow as not as easy to learn, compared with the baseline. Attitude and Behavior proved to be difficult metrics to advance regarding the manual workflow; in every instance, all responses (other than the NPS metric) decreased from an already low level recorded for the baseline workflow. The results indicate a serious need for a much more comprehensive solution that motivates participants’ “attitude toward use” and “intent to use” the manual workflows which are required for successful adoption. The NPS advanced from a negative-state (Detractor) to a neutral-state (Passive), which was a significant advance, yet more opportunity exists for improvement here. Group 1 participants also felt that there was less “awareness” of their goals amongst clinicians in the manual workflow, compared with the baseline, and “information quality” was only enhanced by their own efforts to record manual BP readings. These factors form the Group 1 participants’ opinion that there was a decrease in goal alignment, indicating a belief that they were isolated with their BP data and there was no collaborative exchange with clinicians during the process.
Within Group 2 Summary Analysis
The Context for the technology-mediated BP exam workflow, compared with the baseline, indicates a shift to a remote asynchronous workflow, as hypothesized, which is indicative of a self-exam context. This technology-mediated workflow has transformed to become more distributed across more locations, with fewer participants and communities of practice, somewhat more developing and short-term in nature, and with less turnover than for the baseline workflow. There we no surprises with these results; Group 2 responded as predicted. CS-AF reveals a marked improvement in the Process times of the technology-mediated workflow, compared with the baseline, as participants recorded dramatic time reduction and overall workflow optimization, as hypothesized. The fact that the technology-mediated workflow enabled participants to conduct the BP exam at home and on their own was the primary reason. The technology-mediated solution automated the recording of BP data and enabled real-time visibility of all participants’ BP data with clinicians. Clinicians also had the option to send personal notes to participants; all received a series of time-sequenced info graphs segmented to be relevant to their specific profile in the form of a push notification of proactive information. These features translated to only a slight positive movement on the relevance and importance of the BP information obtained for the technology-mediated workflow, versus the baseline. From a technology adoption perspective, participants did not view the technology-mediated BP exam workflow (Wise&Well and Omron device) to be significantly “useful” or “easy to use”, compared with the baseline. Group 2 participants recorded a slight improvement in all areas of the workflow, except for Stage 3 (BP exam), which was rated less useful and easy to use than the traditional in-office BP exam. Further exploration using the USE model did show participants to be more satisfied with the technology-mediated BP workflow, yet they felt that the workflow was not as easy to learn, compared with the baseline. Similar to results from Group 1, Attitude and Behavior also proved to be difficult metrics to advance regarding the technology-mediated workflow; all responses (other than the NPS metric) decreased from an already low level recorded for the baseline workflow for Group 2. The results indicate a serious need for a much more comprehensive solution that motivates participants’ “attitude toward use” and “intent to use” the technology-mediated workflows for successful adoption. The NPS advanced from a negative-state (Detractor) to a neutral-state (Passive); this was a significant advance; yet more opportunity exists for improvement towards the promotability of the solution. Group 2 participants also felt that there was less “awareness” of their goals amongst clinicians for the first three stages of the workflow in the technology-mediated workflow, compared with the baseline. There was, however, a slight increase awareness, information quality and goal alignment for Stages 4 and 5, including a significant increase in goal alignment for Stage 4 of the tech-mediated workflow. The data reflects an improvement in the areas of treatment and post-exam, indicating that Group 2 participants felt more empowered and informed regarding their BP than did the participants in the baseline workflow. This is a small move in the positive direction, yet there remains a large gap in the front-end part of the workflow and the exam itself to more tightly integrate the collaborative efforts of patients with clinicians. Telehealth technologist will need to investigate ways to improve the collaborative workflow between patients and clinicians during remote self-care exams to positively impact the goal alignment of patients and more beneficial outcomes.
Between Group 1 and Group 2 Summary Analysis
Analysis between Group 1-Manual Workflow and Group 2-Technology-Mediated Workflow participants indicates similar results. Both of the workflows proved to be successful regarding process times; in fact, Group 1’s manual workflow was the most optimized in all stages of the workflow except for Stage 3 (the BP Exam). The data reflects the simplicity of the manual wrist-cuff workflow as more optimized for all stages except the BP Exam since all BP data was recorded manually, in comparison to the more automated readings of the technology-mediated workflow. Group 1 participants did not have any complex technology to contend with, other than the simple wrist-cuff device itself. The tech-mediated workflow also scored better in the areas of information relevance and importance than did Group 1, indicating the graph-plots of real-time BP information, info graphs, alerts, and doctor messages slightly improved the quality of the information from the manual workflow. Technology adoption determinants rated lower than hypothesized for both workflows; yet, the technology-mediated solution proved slightly more “useful” than the manual solution for the first three stages of the workflow where the results flipped for Stages 4 and 5. Participants from both groups indicated that technology could improve usefulness; however, the lowest rating for this variable was in Stage 3, indicating participants’ perspective that technology could be more impactful in the front- and back-ends of the respective workflows. Group 1 participants rated the manual workflow to be “easier to use” than Group 2 participants rated their respective workflow. The manual solution was reported to be easier to use, compared with tech-mediated solution; however, Group 2 participants reported a higher rating for technology’s ability to improve the ease of use, most significantly in the front-end process (stages 1, 2). Both groups agreed that the BP exam workflow would be more beneficial with automation for the registration and appointment scheduling aspects of the workflow. Group 1 participants were overall more satisfied with the manual workflow than Group 2 participants were with the tech-mediated workflow. Both groups found the “ease of learning” for the alternative workflow to be difficult, with a surprising, slight advantage in ease-of-learning to Group 2. Both groups rated variables for Attitude and Behavior for the alternative workflows evaluated as low overall for all stages. Group 2 scored slightly higher for all but Stage 5 for “attitude toward using” and for “intent to use”. Group 2 was also slightly higher than Group 1 for all stages but Stage 2. This data indicates a slightly improved attitude and behavioral intent of Group 2 participants to the technology-mediated workflow than to the manual workflow. However, of all the metrics incorporated in the CS-AF, the attitude and behavior determinates were overall the lowest score reported. This underscores the tremendous importance of attitude and behavior on adoption in collaborative workflow and a target area for further discussion. The comparison of Outcomes between groups indicated a similar reaction by participants for “awareness” and “information quality”, with lower scores from their respective baseline workflows in Stages 1, 2, and 3, and some minor improvements in Stages 4 and 5. These low scores indicate a lack of collaborative connection with clinicians in the alternative workflow. Participants stated that they would like more interaction and access to clinicians during the exam process to ask real-time questions and obtain support as needed. Regarding “goal alignment”, Group 1 reported lower scores for the first four stages of the manual workflow and a slight increase in Stage 5. Group 2 reported a slight increase in goal alignment for Stages 1, 4, and 5, with a Stage 4 increase being significant, compared with the baseline. Both groups reported that the problem areas in the workflow associated with goal alignment are primarily in the front-end process (pre-visit, register). This data confirms other CS-AF data and subjective comments from participants that clinicians seem detached from their specific goals in the baseline workflow; this theme extends further in the alternate workflow, since being remote is a further disconnect from clinicians that is already problematic. Further effort is needed in the goal alignment and communication for patients to be satisfied with the remote nature of telehealth self-exams.
Discussion
The hypertension exam study (the collaborative BP exam workflow) proved to be valuable for testing the capability of the CS-AF and its expanded analysis methodology to investigate collaborative technology-mediated workflows. A variety of themes emerged from the study regarding the learnings and limitations derived from the CS-AF approach and the data that was analyzed.
Theme 1: Capture the Context
The context of the workflow in its current state is an essential reference point to secure future evaluations and comparisons. Barrett et al. posit that understanding the context for telehealth is an essential aspect of evidenced-based research and is critical to refinement of the applications in this space [39]. The CS-AF integrates “context determinants” from the MoCA (Synchronicity, Physical Distribution, Participants, Communities of Practice, Nascence, Planned Permanence, Turnover) because it ties together the context-centric construct from Ajzen with significant contextual dimension from CSCW and HCI literature into one integrated contextual model. The MoCA provides a way to tie up many loose threads related to context. More specifically, the researchers posit that the model provides “conceptual parity to dimensions of coordinated action that are particularly salient for mapping profoundly socially dispersed and frequently changing coordinated actions” [42:184]. Lee and Paine suggest that this model provides a “common reference” for defining contextual settings, “similar to GPS coordinates” [42:191] (Figure 9-10).
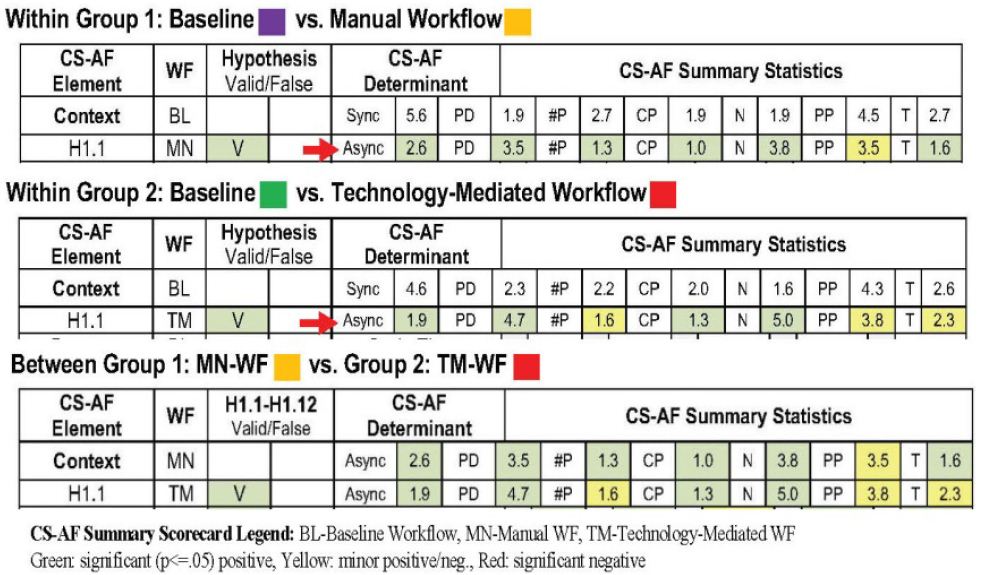
Figure 9: CS-AF Context Scorecard [3]
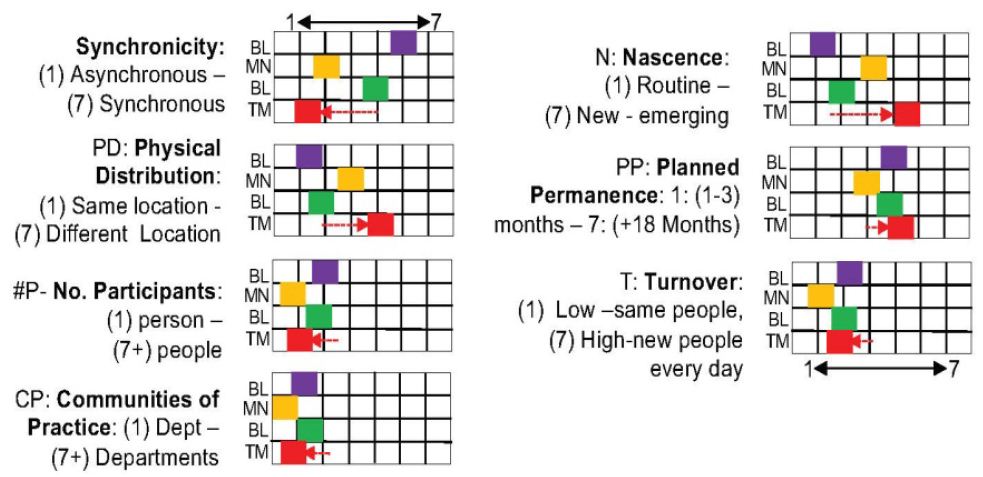
Figure 10: CS-AF–MoCA [cite] Context determinants [3]
Theme 2: A Holistic “Task-focused” View is Needed
This study underscored the importance of an end-to-end view of the workflow and participants’ perspectives at each workflow stage. Early examples of the TAM in field research incorporated data point intervals at various times pre- and post-technology-mediated implementation; however, in most instances, the TAM approach lacks the pre- and post-technology-mediated implementation view at the task level necessary to pinpoint where in the workflow the gain and gaps exist. Yousafzai et al. posit that the “lack of task-focus in evaluating technology” with the TAM has led to some mixed results. They further suggest that an opportunity to incorporate usage models for the TAM may strengthen predictability, yet caution is needed to manage model complexity [67], [68]. The CS-AF approach leads the evaluation effort down the path of a holistic view of the workflow taking into account all five aspects of the CS-AF for the entire workflow experience. The CS-AF integrates the practice of Value Stream Mapping (VSM) into the evaluation to collect and analyze quantitative time data for each step of the targeted workflow that are weakly defined in the TAM [67,68]. Incorporating VSM into the CS-AF established a common language and procedural methodology for characterizing the BP exam workflow in a quantitative manner; each step in the workflow was measured for both the baseline and alternative workflow. By identifying each significant step in the workflow, and collecting time and quality data, a value stream map was created, indicating the cycle/lag time for the workflow and identifying all quality issues throughout the BP exam process. This approach confirms the important role of “task and technology” stated by adoption experts Brown, Dennis, and Venkatesh [69] in research on technology adoption. Incorporating VSM with the CS-AF proved to be a valuable guiding focus for this study and was instrumental in uncovering specific gains and gaps for the workflow evaluated with formal measurement and analysis at the task-level often invisible to developers (Figure 11).
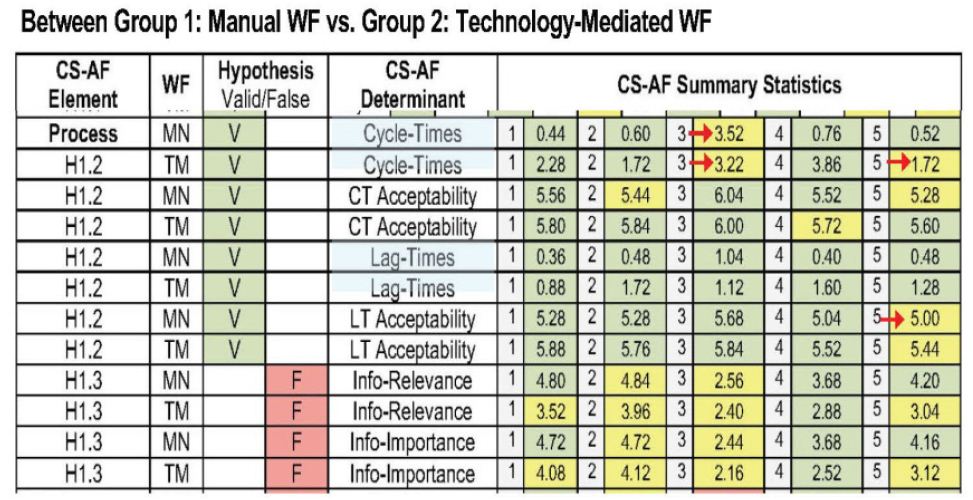
Figure 11: CS-AF Scorecard Process determinants [3]
Theme 3: Time Equals Money, but is not the Only Answer
Further value of collecting and analyzing task data using the CS-AF approach is evidenced in the potential use of process times for financial analysis of technology adoption. Although financial analysis is outside the scope of this research, collection of the task-time data enables further cost-effectiveness analysis (CEA) analysis, if necessary. Woertman et al. posit that CEA is an integral part of technology adoption assessments globally in health care [70]. Their research underscores the importance of calculating the cost associated with a current process and evaluating the financial benefit of the new innovation. Most management metrics associated with CEA are derived from process times and are calculated as efficiency gains or gaps. This research identified specific time comparisons between the baseline workflow, then alternative workflows at the task level. Participants across the board were pleased with the optimization of the alternative workflows; however, even with a marked improvement in time, participants did not feel the solutions were more “useful,” and their attitude and behavioral “intent to use” was actually reduced, compared with the baseline workflows. The data underscore the importance of process time and identifies that, although time-optimization is crucial, it is far from being the only key to collaborative workflow adoption. It essential that technology solutions providers realize that time optimization is just the beginning of creating a successful collaborative workflow (Figure 12).
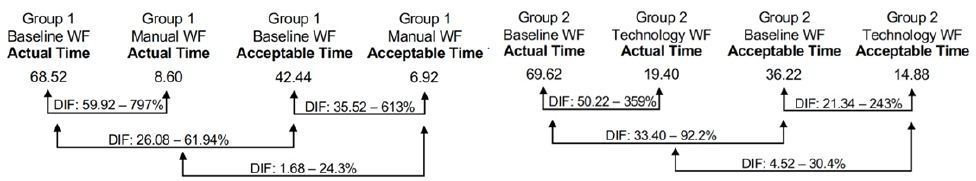
Figure 12: CS-AF Process Times: VSM time series analysis [3]
Theme 4: Technology is not a Substitute for 1:1 Communication
The CS-AF captured an important assessment of information quality across the stages in the workflows evaluated. The data showed a large gap in the expectations of participants regarding communication with clinicians during the telehealth experience. Group 2 participants were exposed to a variety of “automated” communications options in the technology-mediated workflow, including graph-plots of real-time BP information, info graphs, alerts, and doctor messages; yet these technology enhancement only showed a slight improvement in the quality of the information from the baseline and manual workflow. The collaborative information flow is under-supported for telehealth. Practitioners are not trained for, or equipped to, support a growing network of remote asynchronous patients, and the technology is not designed for real-time in-app support and communications. As growth in telehealth continues, expanded capability and resources are needed in the area of patient facilitators. In a study of the role of patient-site facilitators in tele-audiology, Coco et al. identified gaps with the number of facilitators in support of the growing telehealth demand and the associated training to equip these individual with the knowledge needed to successfully support remote telehealth patients [71] (Figure 13).
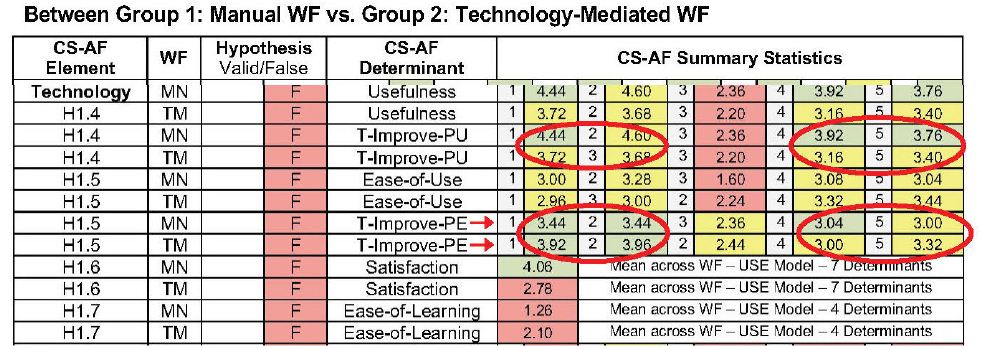
Figure 13: CS-AF Scorecard – Technology determinants [3]
Telehealth patients also bear some responsibility for the connection and flow of quality information in the workflow. Juin-Ming Tsai et al., in their research of “acceptance and resistance of telehealth” research, suggest that “… individuals should establish the concept of healthy self-management and disease prevention. Only when the public is more aware of self-health management can they fully benefit from telehealth services” [72:9]. The migration to self-health requires added commitment of patients towards the information and processes associated with telehealth. Until patients’ attitude and behaviors are accepting of this added responsibility, telehealth adoption will be challenged, regardless of the technology available and the support of patient-site facilitators. The distinct requirement for quality information exchange across telehealth workflows puts further demands on both providers and patients for timely communications, monitoring, and support.
Theme 5: Technology that is Easy to Use, is not Always Adopted
The integration of TAM determinates for “usefulness” and “ease of use” within the CS-AF uncovered interesting results associated with collaborative workflow adoption in telehealth. This research reveals the complexity of technology-mediated innovation and the synchronization of the features with users’ propensity to adopt. Adoption researchers have shown that Perceived Usefulness has a significant impact on technology adoption and Ease of Use is less of a determinate for adoption (Juin-Ming, et al., 2019, Chen & Hsiao, 2012; Cheng, 2012; Cresswell & Sheikh, 2012; Despont-Gros et al., 2005; Kim & Chang, 2006; King & He, 2006; McGinn et al., 2011; Melas et al., 2011; Morton & Wiedenbeck, 2009; Yusof et al., 2008). Juin-Ming et al.’s research states, “Telehealth has a close connection with individual health. Therefore, a user-friendly interface is not the first priority. In other words, as long as telehealth can improve users’ quality of life and provide better healthcare service, users will be more likely to try the functions that it provides” [72:7]. They further state that developers should focus on Perceived Usefulness to help patients find the practical integration path to incorporating the technology-mediated solution into their health management plans. “Therefore, individuals should establish the concept of healthy self-management and disease prevention” [72:9]. Developing an easy-to-understand user experience is an important aspect of the solution; however, the research shows the solution needs to be determined as a useful and viable solution with practical use on a daily basis for patients to increase their intention to use. Obviously, there is also a direct connect between users’ attitudes and behavior, and their perception that the technology-mediated workflow will be a useful experience. The important point verified in this study is that user perception on Ease of Use and Perceived Usefulness both scored lower than were hypothesized; the reason was not necessarily the user interface, but likely the misalignment on the complete solution with the integrated way that users would like to experience telehealth. Both the provider facilitation and personal health management come into play as adoption enablers (Figure 14).
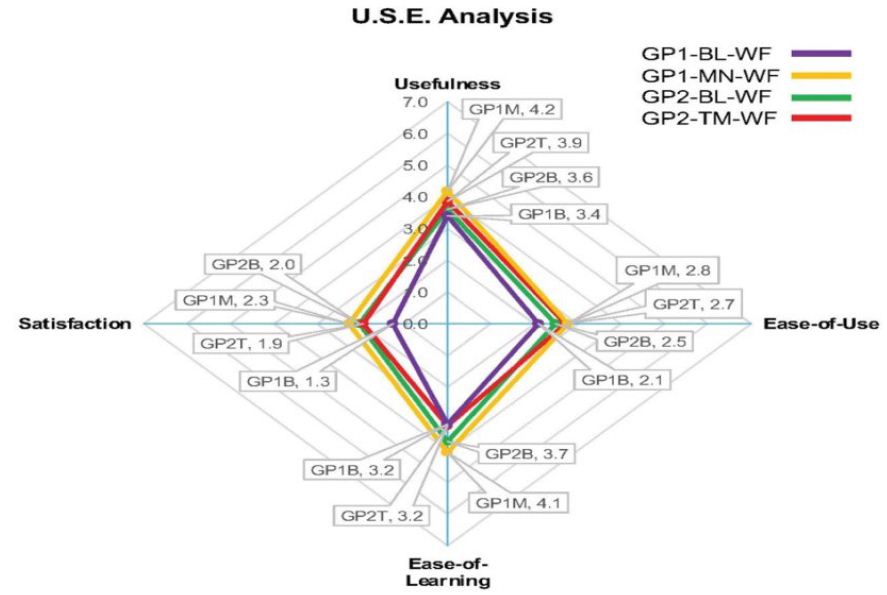
Figure 14: CS-AF – USE (Lund) Technology Acceptance determinants [3]
Theme 6: Relative Advantage Drives Attitude and Behavior to Adopt
Ajzen et al.’s research found a high correlation between attitude and behavior, specifically when there was both a direct correspondence between attitude and behavior [53]. A key omission of the Eikey, et. al theoretical Collaborative Space Model (CSM) for health information technology . The researchers suggest that “to predict behavior from attitude, the investigator has to ensure high correspondence between at least the target and action elements of the measures he employs” [54:188]. The CS-AF evaluates both behavior and attitude across the five stages of the BP exam workflow. The data reveal a more negative “attitude towards”, and “behavioral intent to use” the alternative workflows from the baseline workflows measured. Participants were not convinced that the alternate solution provided enough of a relative advantage to deem it as “useful” enough to shift their beliefs (Figure 15).
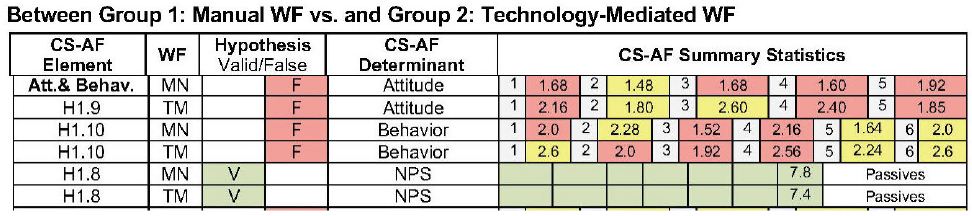
Figure 15: CS-AF Attitude and Behavior Scorecard [3]
This is an important understanding uncovered by other researchers in telehealth technology adoption. Zanaboni and Wootton’s research [73] builds off of Rogers’ Diffusion of Innovations research to investigate how adoption occurs in telehealth. The research finds that, of the five Rogers attributes for adoption (relative advantage, compatibility, trialability, observability, and complexity), relative advantage is the key determinant effecting attitude and behavior to adopt in telehealth [73:2]. The importance of helping users identify with the “advantages” of the technology-mediated workflow is the crucial determinant of the speed of adoption of technology in healthcare, as reported by Greenhalgh et al. [74] and Scott, et al. [75].
Theme 7: Goal Alignment Requires Group Alignment
As large populations shift to telehealth, “awareness” and “common ground”, instinctive in the face-to-face setting, may be overlooked in remote asynchronous telehealth workflows. Reddy et al. posit that “awareness” is not as natural, and breaks-downs occur in technology-mediated telehealth workflows [76:269]. Furthermore, technology-mediated telehealth solutions can disrupt the traditional approach that healthcare providers have toward establishing common ground, or shared goals, amongst their patients [77] (Figure 16).
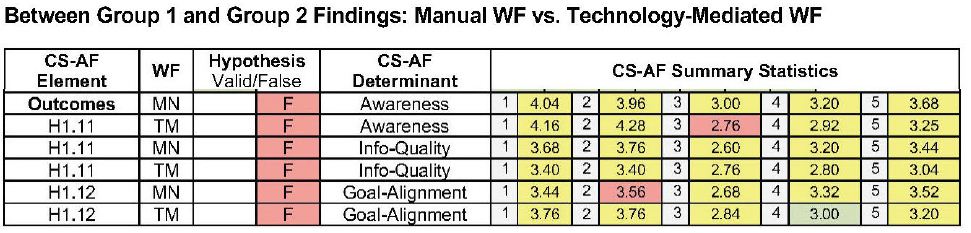
Figure 16: CS-AF Outcomes Scorecard [3]
The CS-AF incorporates determinants for evaluating both awareness and goal alignment across the stages in the BP exam workflow. The results of the analysis showed a slight positive movement in goal alignment and awareness with the technology-mediated solutions, yet the progress in this area was still not acceptable. Much more emphasis is needed to deliver holistic solutions for telehealth that allow patients to feel as connected toward their goals in a remote context as they feel in the face-to-face setting. Eikey et al. state that “HIT needs to be designed to support specific processes of collaborative care delivery and integrate the collaborative workflows of different healthcare professionals [35:270]. Whitten and Mackert suggest that providers have an integral role in the deployment of telehealth solutions, including the use of project managers and remote-care facilitators to show overall provider awareness and to establish dependable common ground with remote patients for telehealth to be adopted widescale [78:517-521].
Limitations
Incorporating more participants for a longer period of time, with perhaps multiple check points, would provide a long-term view and potentially more information. Because of the COVID pandemic, all semi-structured sessions were covered via video conference, creating somewhat of a communications barrier regarding typical interactivity that would happen in a face-to-face setting. Self-reporting of BP exam timing could pose some inconsistency in reporting; however, the baseline data was similar between the two independent groups for BP exam timings. In retrospect, there were too many subjective questions (15 total) for 50 participants across 2 surveys (1500 responses). The analysis was cumbersome and time-consuming, yet the themes extracted were complementary to the statistical analysis of the survey questions. Expanded support from the clinician team for the alternate workflow experiences would be more beneficial to participants. The support for the alternative workflow was delivered by this researcher and, although responsive, may not have been excepted, as well, had the support come from the same clinical team.
Implications for Healthcare Providers
For the provider-clinician community to be successful with telehealth, it must be viewed as an entire new implementation paradigm, complementary with on-site care system, yet with a different set of objectives, leadership, and sponsorship. Practitioners need to understand that technologies are moving at a faster rate than the medical system’s ability to incorporate new capability into their operations. The pace of technology will not slow; it is more likely to accelerate. Practitioners must establish permanent operational processes for continuous technology adoption, ensuring that a pipeline of new technologies at various stages of maturity are properly vetted, prototyped, and integrated into the telehealth system. Practitioners incorporating telehealth services must learn to redefine the context of a “patient” and the support mechanisms that will empower patients to be successful in their remote and asynchronous environments. Clinicians will need to establish new teams, including remote-care facilitators, project managers, and technical support specialists that are properly trained and assigned to the charter of telehealth delivery [79].
Proper protocols and technology infrastructure are needed to allow the telehealth solutions to be led by a structured deployment system that anticipates all possible threats. Sanders et al.’s research on barriers to participation adoption found that some telehealth patients expressed concern with being “dependent” on technology [78]. Greenhalgh et al. reported findings that telecare users had concerns about security and that there was a “perception of surveillance” [74]. Practitioners will need to understand that many of telehealth users are elderly and may have sight, hearing, and dexterity issues, amongst the typical anxiety concerns evidenced in this demographic’s perception of new technology [72,80].
Implications for Patients
Telehealth users have a responsibility to establish their own health plan in a manner the improves their own attitude to use, then adopt telehealth solutions and advocate for their specific healthcare plan with the practitioner community. Telehealth users should spend the time to define a formal healthcare plan in a manner the fleshes out the ambiguity for themselves and provides a formal reference for providers to better understand their specific healthcare needs. Equally as important is the need for future telehealth users to have a technology-adoption mindset. Patients need to know that there is a learning curve associated with technology and assume that there will be start-up difficulty, but work to overcome these barriers with a mindset that the upside use of the technology far outweighs the hurdles to establishing a new norm. Bem’s research in self-perception theory states that when individuals rely on their past behavior as a guiding force towards new adoption, they wrongfully position themselves to poorly perceive the relative advantage of the new technology [80]. Davis, the originator of the TAM, states that individuals accept a technology to the extent that they believe it will meet their needs; when users shift their mindset to include the cost of adoption, they are more accepting of a delay in relative advantage to accommodate the learning curve [51].
Implications for Developers
Developers of telehealth technology can benefit from this research by shifting attention to the functional use of the technology in the field with real patients through iterative agile development involving lead users. Since the telehealth ecosystem is just now formulating, real insight into the unmet needs of patient will be found by working directly with patients that have an interest in adopting telehealth; they can be spokespeople for their community needs [81,82]. Developers need to comprehend the findings in this study associated with the subtle migration of non-adopters to adopters and realize that the primary motivator is a relative advantage that triggers attitude towards use and behavioral intent to use, which feeds perceived usefulness of the technology-mediated solution for new telehealth users [73-75]. Developers will also need to explore the technology’s future space and contemplate new systems design platforms that integrate a variety of telehealth solutions into a common patient dashboard, so that patients can quickly habituate with a user experience paradigm. This approach will allow patients to gain additional relative advantage by adding in additional telehealth capability into an already familiar framework that they are comfortable with [43,83]. Developers will need to explore new ways to collaborate with the practitioner community during each stage in the product development lifecycle. Yen and Bakken advocate an extended development lifecycle with emphasis on the front-end part of the process and iterative in nature with lead users [83,84]. The telehealth development community is not as established as other sectors, such as consumer electronics and business software solutions. Developers need to investigate best practices in more mature sectors and incorporate those development lifecycle practices into their standard operating procedures to ensure predictability [85,86].
Implications for Researchers
This builds off of the historic CSCW research in collaborative workflows to introduce the CS-AF as replicable approach for evaluating workflows with the aim at workflow improvements. The research expands on the future research directives suggested by Eikey et al.’s comprehensive review of collaboration in HIT by expanding on their summary view of the space and need for “field investigation methods”, including the key omission of attitude and behavior measures [35]. The research successfully incorporated a select set of cross-disciplinary elements in efforts to obtain a comprehensive view of the collaborative workflows. The research objectives of the CS-AF addressed not only the those identified by Eikey, but it also addressed directives from a host of HCI/CSCW researchers, such as Grudin and Weiser, amongst others, that challenge researchers to continue to refine approaches to engage in immersive discovery on the specific tasks at the point where work is done. “We (CSCW) will most likely need to develop new concepts to help us understand collaboration in complex organizations” [58:514]. Rojas et al. conducted a literature review of process evaluation techniques in healthcare (examining 74 papers), to determine reoccurring approaches; they concluded that, “Efforts should be made to ensure that there are tools or solutions in place which are straightforward to apply, without the need of detailed knowledge of the tools, algorithms or techniques relating to the process mining field. In addition, new methodologies should emerge, which use reference models and be able to consider the most frequently posed questions by healthcare experts” [86:234]. Bringing the expertise of CSCW researchers to the telehealth domain in a collaborative effort with HIT professionals and the use of the CS-AF will undoubtedly facilitate a comprehensive view of the workflow. The CS-AF field engagement methodology and cross-disciplinary survey instrument provide a functional methodology for researchers to design, conduct, and statistically evaluate subsequent collaborative workflows, enabling a clear visibility to the gains and gaps of each workflow iteration.
Keywords
Telehealth, Ubiquitous collaboration, Workflow, Technology-mediated, Adoption
CCS Concepts: Ubiquitous Computing, Telehealth, Doctor-Patient Collaboration, Human-Centered Computing, Applied Computing, Health Informatics, Health Information Technology
References
- Winbladh K, Ziv H, Richardson DJ (2011) Evolving requirements in patient-centered software, in Proceedings of the 3rd Workshop on Software Engineering in Health Care, Honolulu, HI, May 22-23.
- Grudin J (1994) Computer-Supported cooperative work: History and focus. Computer 27 (5): 19-26.
- Bondy, Christopher (2021) A Framework for Evaluating Technology-Mediated Collaborative Workflow. Thesis. Rochester Institute of Technology.
- Ackerman M (2000) The intellectual challenge of CSCW: The gap between social requirements and technical feasibility. Human-Computer Interaction 15 (2): 179-203.
- Neale DC, Carroll JM, Rosson MB (2004) Evaluating computer-supported cooperative work: Models and frameworks, in Proceedings of Conference on Computer Supported Cooperative Work.
- Neale DC, Hobby L, Carroll JM, Rosson MB (2004) “A laboratory method for studying activity awareness,” in Proceedings of 3rd Nordic Conference on Human-Computer Interaction 1: 313-322.
- Weiser M (1996) Ubiquitous Computing.
- Goulden M, Greiffenhagen C, Crowcroft J, McAuley D, Mortier R, et al. (2017) Wild interdisciplinarity: Ethnography and computer science. International Journal of Social Research Methodology 20(2): 137-150.
- Blomberg J, Karasti H (2013) Reflections on 25 Years of Ethnography in CSCW. The Journal of Collaborative Computing and Work Practices 22: 373-423.
- Clough PT (1992) Poststructuralism and postmodernism: The desire for criticism. Theory and Society 21: 543-552.
- Peneff J (1988) The observers observed: French survey researchers at work. Social Problems 35: 520-535.
- Carroll J (2002) Human-Computer Interaction in the New Millennium. New York: ACM Press.
- Weiseth PE, Munkvold BE, Tvedte B, Larsen S (2006) “The wheel of collaboration tools: A typology for analysis within a holistic framework,” in Proceedings of the 20th Anniversary Conference of Computer Supported Cooperative Work. pg: 239-248.
- Norman DA (2011) Living with Complexity. Cambridge, Mass: MIT Press.
- Carroll JM, Kellogg WA, Rosson MB (1991) “The Task-Artifact Cycle” In Carroll JM (eds) Designing Interaction: Psychology at the Human-Computer Interface. New York: Cambridge University Press.
- Millen D (2000) Strategies for HCI Field Research. Red Bank, NJ: AT&T Labs-Research.
- Arias E, Eden H, Fischer G, Gorman A (2000) Transcending the individual human mind: Creating shared understanding through collaborative design. Transactions on Computer-Human Interaction 7(1): 84-113.
- Baeza-yates, Pino JA (1997) A First Step to Formally Evaluate. In Proceedings of the International ACM SIGGROUP on Supporting Group Work: The Integration Challenge, Phoenix, Arizona.
- Plowman L, Rogers Y, Ramage M, (1996) “What are workplace studies for?” in Proceedings of the Fourth European Conference on Computer Supported Cooperative Work, Stockholm, Sweden, April.
- Workman M (2004) Performance and perceived effectiveness in computer-based and computer-aided education: Do cognitive styles make a difference. Computers in Human Behavior 20(4): 517-534.
- Baecker RM, eds (1995) Readings in Human-Computer Interaction: Toward the Year 2000. Burlington, Massachusetts: Morgan Kaufmann Publishers.
- The Encyclopedia of Human-Computer Interaction (2nd ed.) 2009 “Human computer interaction: Brief introduction” Interaction Design Foundation.
- Lee CP, Paine D (2015) From the matrix to a model of coordinated action (MoCA) in Proceedings of the18th ACM Conference on Computer Supported Cooperative Work and Social Computing.
- Davis RF (1989) Perceived usefulness, perceived ease of use, and user acceptance of information technology. MIS Quarterly 13.
- Venkatesh V, Morris M, Davis G, Davis F (2003) User acceptance of information technology: Toward a unified view. MIS Quarterly 27(3): 425-47.
- Lund AM (2001) Measuring usability with the USE questionnaire. Usability Interface. 8(2): 3-6.
- Reichheld FF (2006) “The microeconomics of customer relationships. MIT Sloan Management Review 47: 73-78.
- Fox S, Rainie L (2002) Vital Decisions: A Pew Internet Health Report. Pew Research Center: Internet and Technology 22.
- Estrin (2014) Small data, where n=me. Communications of the ACM 57(4): 32-34.
- Helft PR, Hlubocky F, Daugherty CK (2003) “American oncologists’ views of internet use by cancer patients: A mail survey of American society of clinical oncology members. Journal of Clinical Oncology 21. [crossref]
- Chokshi NP (2018) Loss‐Framed financial incentives and personalized goal‐setting to increase physical activity among ischemic heart disease patients using wearable devices: The ACTIVE REWARD randomized trial. The Journal of the American Heart Association 13. [crossref]
- Brown D (2019) Doctors say most metrics provided by your Apple Watch, Fitbit aren’t helpful to them. USA TODAY.
- Weir CR, Hammond KW, Embi PJ, Efthimiadis EN, Thielke SM, et al. (2011) An exploration of the impact of computerized patient documentation on clinical collaboration. International Journal of Medical Informatics 80 (8): e62–e71. [crossref]
- Skeels MM, Tan D (2010) “Identifying opportunities for inpatient-centric technology,” presented at International Health Informatics Symposium (IHI’10) Arlington, Virginia, November 11-12,.
- Eikey E, Reddy M, Kuziemsky C (2015) Examining the role of collaboration in studies of health information technologies in biomedical informatics: A systematic review of 25 years of research. Journal of Biomedical Informatics 57: 263-277. [crossref]
- Bondy, Christopher (2018) Exploring the association between current state and future state technology-mediated collaborative workflow: Graphic communications workflow technical association of the graphic arts. Presented at The Annual TAGA Convention, Washington, D.C., March 19.
- Piwek l, Ellis D, Andrews S, Joinson A (2016) The Rise of consumer health wearables: Promises and barriers. PLOS Medicine 13(2). [crossref]
- Kalantari M (2016) Consumers adoption of wearable technologies: Literature review, synthesis, and future research agenda. International Journal of Technology Marketing. 12(3): 274-307.
- Rothwell P (2010) Limitations of the usual blood-pressure hypothesis and importance of variability, instability, and episodic hypertension. The Lancet 375(9718): 938-948. [crossref]
- Ogedegbe G, Pickering T (2010) Principles and techniques of blood pressure measurement. Cardiology Clinics 28(4): 571-586. [crossref]
- American Heart Association recommended blood pressure levels (2018) 501.
- Lee CP, Paine D (2015) “From the matrix to a model of coordinated action (MoCA)” in Proceedings of the18th ACM Conference on Computer Supported Cooperative Work and Social Computin,.
- Bondy C (2017) “Understanding critical barriers that impact collaborative doctor-patient workflow,” presented at The 2017 IEEE International Conference on Biomedical and Health Informatics, Orlando, Florida.
- Musat D, Rodríguez P (2010) Value Stream Mapping integration in Software Product Lines PROFES ’10 Copenhague, Denmark.
- Rother M (2009) Learning to See: Value Stream Mapping to Add Value and Eliminate MUDA. Boston, MA: Lean Enterprise Institute, Inc.
- Shoua W, Wang J, Wu P, Wang X, Chong HY (2017) A cross-sector review on the use of value stream mapping. International Journal of Production Research 55(13): 3906-3928.
- Snee RD (2010) Lean Six Sigma: Getting better all the time. International Journal of Lean Six Sigma 1 (1): 9-29.
- Haizatul S, Ramian R (2015) Patient Process Flow Improvement: Value Stream Mapping. Journal of Management Research 7(2).
- Roth N, Franchetti M (2010) Process improvement for printing operations through the DMAIC Lean Six Sigma approach: A case study from Northwest Ohio, USA. International Journal of Lean Six Sigma 1(2): 119-133.
- Acharyulu GVRK (2014) Supply chain management practices in printing industry. Operations and Supply Chain Management 7(2): 39-45.
- Davis RF (1989) Perceived usefulness, perceived ease of use, and user acceptance of information technology. MIS Quarterly 13(3).
- Lund AM (2001) Measuring usability with the USE questionnaire. Usability Interface 8(2): 3-6,.
- Ajzen I (1991) The Theory of Planned Behavior. Organizational Behavior and Human Decision Processes 50(2): 179-211.
- Ajzen J, Fishbein M (1977) Attitude-Behavior relations: A theoretical analysis and review of empirical research. Psychological Bulletin 84(5): 888-918.
- Reichheld FF (2006) The microeconomics of customer relationships. MIT Sloan Management Review 47: 73-78.
- Oliveira T, Oliveira Martins (2010) Literature review of information technology adoption models at firm level. Revista de Administração 45(1): 110-121.
- Samaradiwakara GDMN (2014) Comparison of existing technology acceptance theories and models to suggest a well improved theory/model. International Technical Sciences Journal 1(1).
- Neale DC, Carroll JM, Rosson MB (2004) “Evaluating computer-supported cooperative work: Models and frameworks,” in Proceedings of Conference on Computer Supported Cooperative Work.
- Divine G, Norton HJ, Hunt R MD, Dienemann J (2013) Review of Analysis and Sample Size Calculation Considerations for Wilcoxon Tests. Anesthesia and Analgesia 117(3): 699-710.
- Minitab Blog Editor, “Best way to analyze Likert item data: Two sample t-test versus Mann-Whitney” The Minitab Blog.
- Wilcoxon F (1945) Individual comparisons by ranking methods. Biometrics Bulletin 1(6): 80-83.
- Meek GE, Ozgur C, Kenneth D (2007) Comparison of the t vs. Wilcoxon Signed-Rank Test for Likert scale data and small samples. Journal of Modern Applied Statistical Methods 6(1).
- Salkind NJ (2020) Repeated Measures Design. SAGE Research Methods,
- Glen S, ANOVA test: Definition, types, examples.” Com: Elementary Statistics for the Rest of Us!.
- Brandao ARD (2016) Factors influencing long-term adoption of wearable activity trackers. RIT Scholar Works.
- Barrett D, Thorpe J, Goodwin N (2015) “Examining perspectives on telecare: Factors influencing adoption, implementation, and usage. Smart Homecare Technology and TeleHealth 3: 1-8.
- Yousafzai S, Foxall S, G., and J. (2007) “Technology acceptance: A meta‐analysis of the TAM: Part 1”, Journal of Modelling in Management 2(3): 251-280.
- Yousafzai S, Gordon RF, John GP (2007) Technology acceptance: A meta‐analysis of the TAM: Part 2. Journal of Modelling in Management 2(3): 281-304.
- Brown SA, Dennis AR, Venkatesh V (2010) Predicting collaboration technology use: Integrating technology adoption and collaboration research. Journal of Management Information Systems 27(2): 9-53.
- Woertman WH, Van De Wetering G, Adang EMM (2014) Cost-effectiveness on a local level: Whether and when to adopt a new technology. Medical Decision Making 34(3): 379-386. [crossref]
- Coco L, Davidson A, Marrone N (2020) The role of patient-site facilitators in tele-audiology: A scoping review. American Journal of Audiology 29: 661-675. [crossref]
- Tsai JM, Cheng MJ, Tsai HH, Hung SW, Chen YK, et al., (2019) Acceptance and resistance of telehealth: The perspective of dual-factor concepts in technology adoption. International Journal of Information Management 49: 34-44.
- Zanaboni P, Wootton R (2012) Adoption of Telemedicine: From pilot stage to routine delivery,” BMC Medical Informatics and Decision Making 12(1). [crossref]
- Greenhalgh T, Robert G, Macfarlane F, Bate P, Kyriakidou O (2004) “Diffusion of innovations in service organizations: Systematic review and recommendations,” Milbank Quarterly 82(4): 581-692. [crossref]
- Scott SD, Plotnikoff RC, Karunamuni N, Bize R, Rodgers W (2008) Factors influencing the adoption of an innovation: An examination of the uptake of the Canadian Heart Health Kit (HHK). Implementation Science 3(41).
- Reddy MC, Shabot MM, Bradner E (2008) Evaluating collaborative features of critical care systems: A methodological study of information technology in surgical intensive care units. Journal of Biomedical Informatics 41: 479-487. [crossref]
- Weir CR, Hammond KW, Embi PJ, Efthimiadis EN, Thielke SM, et al. (2011) An exploration of the impact of computerized patient documentation on clinical collaboration. International Journal of Medical Informatics. 80: e62–e71. [crossref]
- Whitten PS, Mackert MS (2005) Addressing telehealth’s foremost barrier: Provider as initial gatekeeper. International Journal of Technology Assessment in Healthcare 21(4): 517-521,
- Abdullah F, Ward R (2016) Developing a General Extended Technology Acceptance Model for E-Learning (GETAMEL) by analyzing commonly used external factors. Computers in Human Interaction 56.
- Bem DD (1972) Self-Perception Theory, In Berkowitz L (eds) Advances in Experimental Social Psychology. New York: Academic Press.
- von Hippel E, Thomke S, Sonnack M (1999) Creating breakthroughs at 3M. Harvard Business Review 79: (5): 3-9.
- Jalil S, Myers T, Atkinson I, Soden M (2019) Complementing a clinical trial with human-computer interaction: Patients’ user experience with telehealth. JMIR Human Factors 6(2).
- Yen PY, Bakken S (2012) Review of health information technology usability study methodologies. Journal of the American Medical Informatics Association 19(3): 413-422.
- Bondy C, Rahill J, Povio ML (2007) Immersion & iteration: Leading edge approaches for early stage product planning,” Masters’ Project, Product Development, Rochester Institute of Technology, Rochester, NY.
- Dorsey E, Topol E (2016) State of Telehealth. The New England Journal of Medicine 375(2): 154-161.
- Eric Rojas, Jorge Munoz-Gama, Marcos Sepúlveda, Daniel Capurro (2016) Process mining in healthcare: A literature review. Journal of Biomedical Informatics 61: 224-236. [crossref]