Abstract
AI created a resource bank of statements about what a doctor might say to a child in order to deal with the child’s obesity. After the AI generated messages were developed, 16 of the messages (elements) were selected and combined into vignettes according to an underlying experimental design, whose specific combinations differed for each ‘respondent’. Each set of 24 vignettes comprised a stand-alone set of combinations and were evaluated by AI prompted to act as a specific person in the medical world (receptionist, doctor with 10 years of experience, nurse practitioner). Deconstruction of the ratings by regression showed the contribution of each AI created message to the rating scale. The coefficients ‘made sense’ when the regression was done according to ‘WHO’ the AI was defined to be. Further clustering the coefficients across the respondents revealed two clearly different mind-sets. The systematic approach using AI as both the provider of ideas and the evaluator of these ideas presents a new vista for learning about how to communicate with people, using technology to dramatically accelerate and fine-tune that learning.
Introduction
It is hard to overestimate the excitement with which AI, artificial intelligence, has been greeted and adopted, especially since the introduction of Chat GPT, and associated technology [1]. One can scarcely read of any topic of huma endeavor without one or another pundit bringing up the impact of AI for that field. This paper looks at the potential of AI to synthesize ‘respondents’, with the goal of accelerating the learning of professionals who want to learn to counsel people in nutritional health. The use of synthesized people, personas, is not new, and has been a topic of interest for some decades now [2-4]. What is new is the vision of moving beyond personas derived from large scale studies to one-off studies created entirely by synthetic means.
This paper combines AI with Mind Genomics to develop a new system for training and education. The underlying vision is to accelerate knowledge development by having the AI provide topic-relevant ideas (Idea Coach in Mind Genomics), and then ‘personas’ created by artificial intelligence, based upon combinations of features of the way people think, who the people are etc.. The raw material for these personas come from ‘self-profiling classification questions’ that a researcher might ask a human respondent. In short, the paper presents a Mind Genomics study, with the materials, from beginning end under the control of the machine, not the researcher. All the researcher does is select ideas at the very start of the study, these ideas later being tested in the study itself.
The process of Mind Genomics begins with a series of questions, those questions telling a story, and then for each question provide four different answers. The actual experiment consists of combining these answers into small combinations of 2-4 answers, at most one answer from a question, but often no answer from a question. The 24 combinations, called vignettes, are evaluated by respondents. Each respondent evaluates a set of 24 different vignettes, the uniqueness of the sets of 24 vignettes ensured by a permutation algorithm [5]. The analysis, done by OLS, ordinary least squares regression, shows through the coefficients of a linear equation the degree to which the 16 elements, viz., answers to the question, drive the respondent’s rating.
During the evolution of Mind Genomics, a process taking place for more than 30 years, since its introduction in 1993 [6-8], the consistently hardest part of any effort, basic research or applied research, was developing the questions, and to a far lesser degree coming up with the answers to the questions. More than one study ended up being aborted simply because the researcher could not generate the four questions which tell the story. Once the four questions were developed, for the most part, researchers were able to push through to the four answer for that question. A solution to the issue of frustration in the creation of questions and answers emerged with the incorporation of AI into the process.
A third problem, motivating people, respondents, to participate, proved to be simple to solve because of the emergence of companies which provided paid panelists. Money solved the problem of participation, if not motivation. This paper will deal with the introduction of synthesized respondents, to reduce cost, and to facilitate new types of systematized investigations not possible before.
Mind Genomics requires systematized thinking about a topic, an ability that all too often needs to be learned through coaching. It was to provide this coaching that the original AI was introduced in mind-year, 2023, in the form of Idea Coach. This paper focuses on the further introduction of AI ‘synthesized respondents’, in an effort to make the Mind Genomics process a streamlined one, from beginning to end, appropriate for teaching as well as for practical application.
Explicating the Process-Part 1-Setting Up the Study Using AI
Figure 1 (Panel A) shows the request by the Mind Genomics set-up ‘template’ for the four questions, each to be addressed by four answers. It is the development of these four questions which become a difficult hurdle. The creation of the Idea Coach allows this topic to be addressed. Figure 1 (Panel B) shows the rectangle where the researcher can write out the question. The question posed to AI through Idea Coach is very simple: I am a doctor treating obesity in children. How do I talk to the children to make them understand. One could further fine-tune the Idea Coach by telling it to explicate the question in discussion form, as well as to provide questions of length 15 words or less, and questions understandable to a 12-year-old. Those statements become part of the query. The actual process is made as simple as possible so that the effort focuses on the topic.

Figure 1: The templated screens requesting the researcher to provide four questions. Panel A shows the request for four questions which tell a story Panel B shows the rectangle inside which the researcher can describe the topic, and from which the Idea Coach returns with 15 questions. The actual text of the request is: I am a doctor treating obesity in children. How do I talk to the children to make them understand?
The actual short description appears as the topic in Table 1. The Idea Coach was run three times to generate a reservoir of questions. The Idea Coach is typically run 5-10 times, providing information which ends up teaching the researcher. The Idea Coach is also run several times for each of the four questions. The combination of different sets of 15 questions for a topic description and different sets of 15 answers for each question provides a unique resource booklet on the topic. Each iteration in Idea Coach lasts about 20 seconds, so that in five minutes one can produce 15 sets of 15 questions each. In the end, only four questions will be chosen.
The results from the first 15 questions appear in Table 1. The questions emerging from the AI embedded in Idea Coach are easily understood by a human being.
Table 1: Questions emerging from the Idea Coach which address the topic. The topic is provided by the researcher

After the researcher receives the various sets of 15 questions, the next task is for the researcher to provide four questions. These questions can be taken from those suggested by the AI, either ‘as is’ or edited to tailor the ‘language’ and ‘style’ of the answer. The researcher may also contribute questions. Quite often the questions shown in Table 1 have to be modified, not so much for the respondent who never sees the questions, but rather for the AI to provide the proper format of the answer.
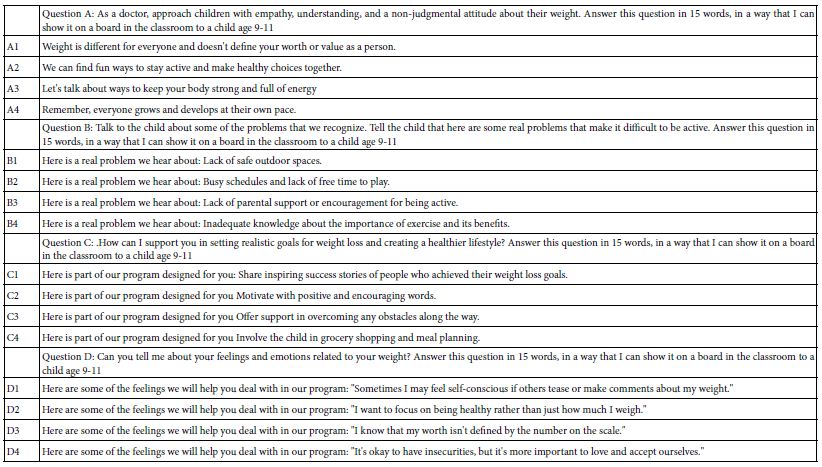
Table 2 shows the modified question, edited by the researcher, and submitted to the Idea Coach. In turn, for each question in Table 2, Idea Coach returned with sets of 15 answers, formatted in the way request by the researcher. Table 2 also shows the four answers to each question, these answers having been returned by AI (Mind Genomics’ Idea Coach), and then slightly edited to make them flow more easily. The rationale was to generate answers that could be given to the Idea Coach programmed to act as a human respondent.
Table 2: The four questions and the four answers to each question. The questions and the answers were edited slightly to make them understandable to human beings, but the language and meaning was maintained.
Running the Study and Preparing the Data for Regression Modeling and for Clustering
Following the creation of the edited answers, the Mind Genomics platform was instructed to run a study with 301 synthetic respondents. The program was instructed to create a panel comprising approximately equal numbers of the three types of synthetic respondents defined by their job (receptionist, doctor with 10-years-experience, nurse practitioner). Then the Mind Genomics program presented 24 vignettes to the synthetic respondent, defining WHO the respondent is, defining the SCALE (Table 3), and then one vignette at a time to the AI ‘respondent’ with the request to rate the vignette on the two-sided scale by choosing one rating point. This means that the AI had to consider the vignette from the complex of how the patient would feel and how the doctor would feel. The Mind Genomics platform recorded the information about the respondent, the vignette, the rating, and the time elapsed for the synthesized respondent to rate the vignette.
Table 3: The preliminary question for assignment into respondent job (top) and then the ‘two-sided rating scale (bottom).

Once the data was collected for a ‘respondent’ the AI returned the raw data to the Mind Genomics platform to create the database shown as an Excel file in Figure 2. Each respondent generates 24 rows of data, one row for each of the 24 vignettes. Figure 2 is divided into several sections, representing different aspects of the data and of the analysis. As we follow the structure of the file, we must keep in mind that as the data is being transferred to the database, there are preparatory transformations occurring in ‘real time,’ these transformation necessary for the analysis.
- Row-for the entire database. There are 301 respondents, each with 24 rows of data, generating 7224 rows, each row corresponding to a specific respondent and a specific vignette.
- Study and panelist number.
- The AI assignment of the respondent to one of three groups (receptionist, doctor with 10-years-experience, nurse practitioner by the membership of the synthesized respondent into one of two mind-sets, and then into one of three mind-sets.
- Columns showing test order and ‘half’ defined as 1 for test order 1-12, and 2 for test order 13-24, respectively.
- The 16 elements, A1-D4, coded as ‘1’ when present in the vignette, coded as ‘0’ when absent from the vignette.
- Rating, new variables R54x (patient motivated), R12x (patient not motivated), R52x (medical person feels the right thing was said), R41x (medical person thinks the wrong things were said), R3x (cannot answer), and RT (response time to the nearest 10th of a second. The new variables were created by adding the appropriate variables. In no case does the creation of a new variable produce any number other than 0 or 1. After these variables were created a vanishingly small random number was added to each new variable (viz., R54x, R12x, R52x, R41x, R3) to ensure that these newly created variables possessed minimal variability as required for analysis by regression.

Figure 2: Example of database showing the actual information generated by the AI, and the set of responses to each vignette.
Using Regression Modeling to Link the 16 Elements to the Newly Created Binary Variables
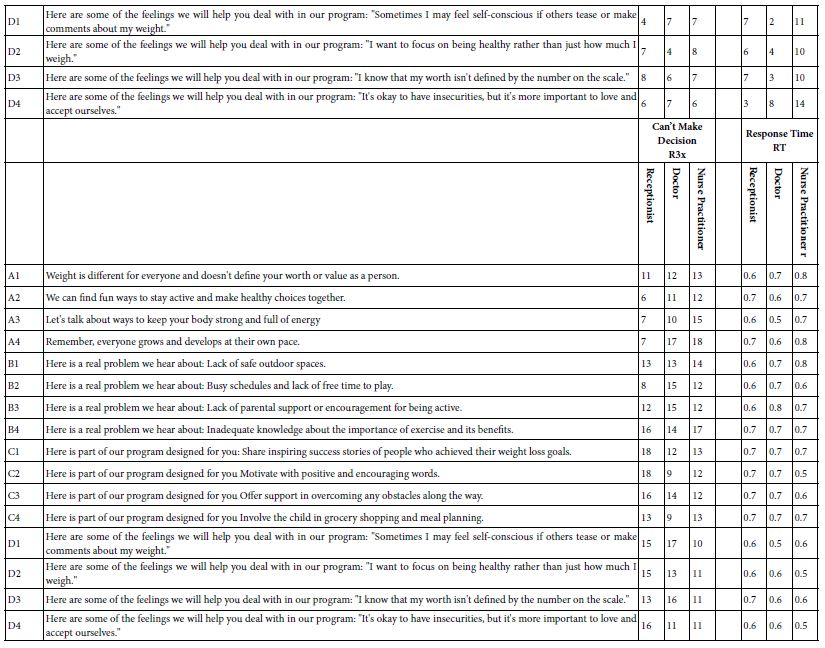
The first analysis looks at the average ratings of the newly created binary variables (e.g., R54x, Patient Motivated). The question is whether the instruction to the AI to assume a certain persona (e.g., receptionist) has an effect on the average ratings across all the vignettes in which the AI assumed that it was a ‘receptionist’. Table 4 shows that the average ratings for a specific binary variable are quite similar across the three different ‘AI personas’. Our first conclusion leaves us with the concern that AI may not be able to perform the task in a way which makes sense.
Table 4: Average rating for five binary variables and ‘response time’ for three respondent personas created by AI and set to the task of rating the vignette. The data come from the averages of the newly created binary variables. Each average comes from approximately 2400 numbers, assuming that each synthesized persona comprised 100 respondents, each respondent evaluating 24 vignettes.

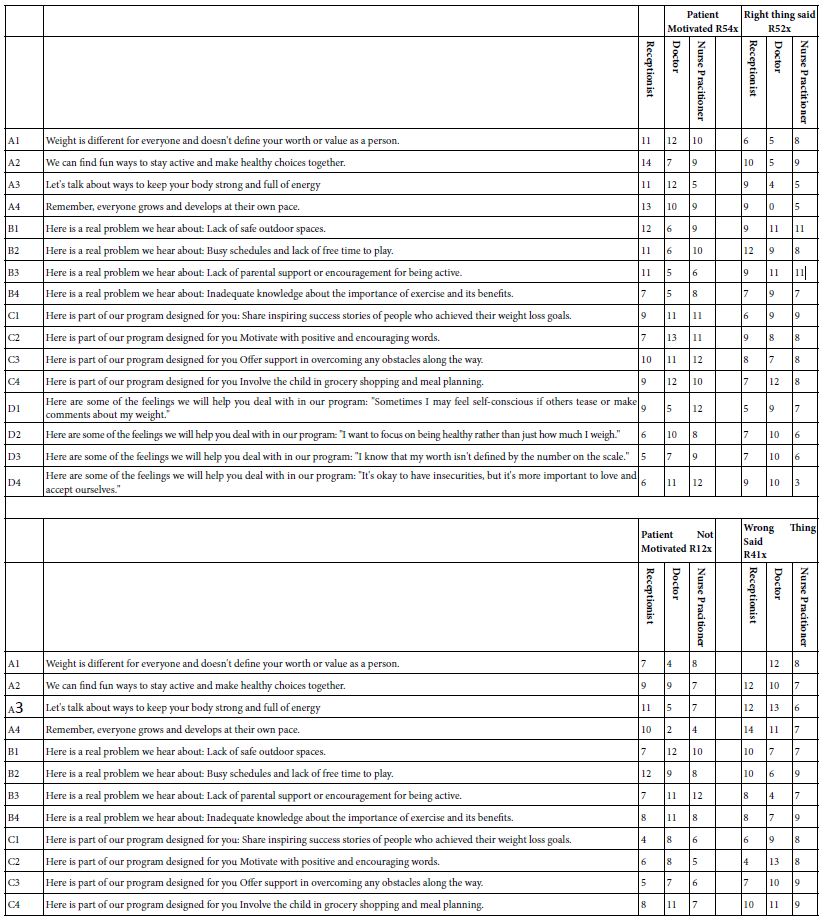
The final analysis for this first run used OLS (ordinary least squares regression, to relate the 16 elements to the binary transformer rating. The equation is: Transformed Binary Variable=k1(A1) + k2(A2) + … k16(D4). That is, the regression model uses the data to show how the presence or absence of the element drives the binary variable. The least-squares regression can be run for the total panel, and for all respondents defined by the AI synthesizer as being ‘receptionist,’ ‘doctor with 10-years-experience’, or nurse practitioner.
Table 5 shows the regression coefficients, computed as if the ratings and therefore the binary variables (e.g., R54x) came from people. Relevant coefficients are shown in shaded cells. There may be a number of stories within the data, but no simple organizing principle. Experience with ratings generated by people produce the same story, namely some strong performers but not many, and stories that could be told, but seem too isolated.
Table 5: Regression coefficients for the key groups (receptionist, doctor with 10-years-experience, and nurse practitioner. The regression coefficients were estimated by OLS regression based upon the ratings of the vignette assigned by artificial intelligence.
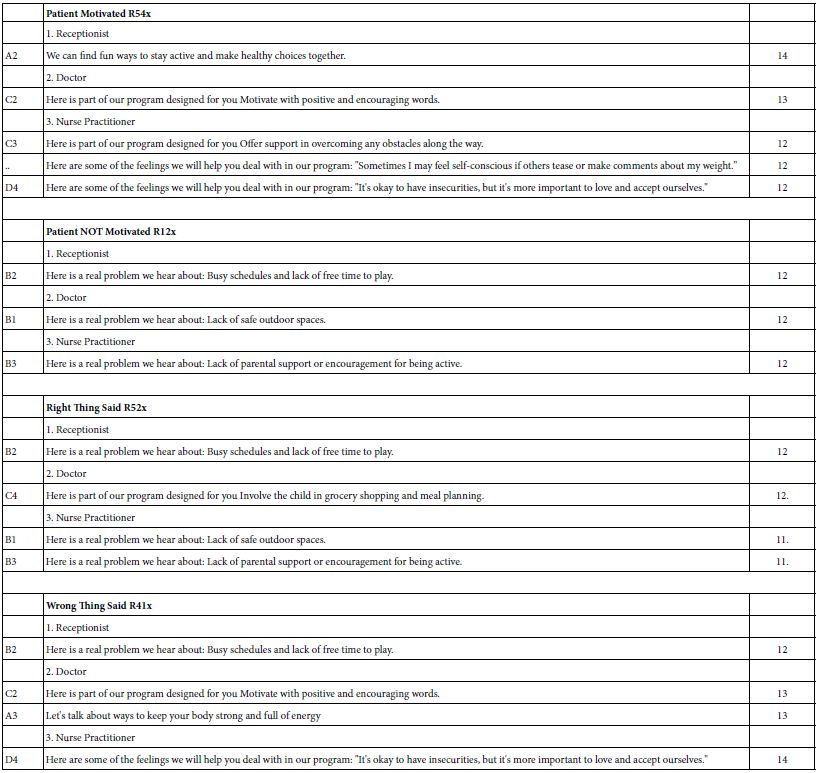
A better way to look for ‘humanness’ in the data may be to search for strong-performing elements for each. As a further step, one might present these strong performing elements to others, and ask them how they feel about the motivating power of the elements, or how they feel about the elements in terms of want might be expected from someone in the medical profession. As a first approximation, there are no strong surprises in Table 6, which shows the strongest elements for each newly created binary variable (e.g., R54x, Patient Motivated), when the AI took on three of the personas.
Table 6: Strongest performing elements for three AI personas (receptionist, doctor, nurse practitioner) on four newly created binary variables.
The final set of analyses, clustering, divides the respondents into mutually exclusive and exhaustive groups, called ‘clusters’ by statisticians, ‘segments’ by consumer researchers, and ‘mind-sets’ in the language of Mind Genomics. The underlying notion, foundational for Mind Genomics, is that ‘people’ differ systematically in the way they make decisions about the world of the everyday. The plethora of different products, services, even layouts of towns and the styles of houses and their decorations clearly announce these differences in judgment. Rather than considering this person-to-person variability to be an unwanted secondary factor, noise, in an otherwise simple world, Mind Genomics looks for organizing principles, so-called mind-sets. These mind-sets are derived empirically from a study of the differences among people in how those people evaluate the world of the everyday, at the granular level, not the 20,000-foot level. A variety of papers have been published on the use of Mind Genomics to identify these mind-sets in various situations and for various products.
The question for this study is whether mind-sets can be uncovered when we deal with synthetic respondents. The process to discover these mind-sets will certainly work with the data generated by AI because the input data needed to create the mind-sets is simply the set of coefficients, one per respondent, as shown in Table 5, specifically in this study for coefficients where R54x (patient motivated) is the dependent variable.
The process for creating mind-sets follows strict mathematical rules. The clustering is totally insensitive to the ‘meaning’ of the elements and does not care from where the coefficients came Mind-sets emerge after the researcher develops the equation for each of synthesized respondent, puts the data into a matrix of 301 rows (one row for each synthesized respondent, 16 columns (one column for each of the 16 coefficients from regression). The k-means clustering program [9] then creates groups of synthesized respondents whose patterns are similar across the 16 coefficients.
The process of creating the mind-sets is straightforward, using clustering. The process follows these steps:
- Create the basic equation for each respondent: R54x=k1A1 + k2A2 … k16 The equation has 16 coefficients, estimated from the 24 cases generated for each synthetic respondent.
- Estimate the ‘distance’ or ‘dissimilarity’ between each pair of the 301 respondents by computing the Pearson Correlation (R). Then create the new distance parameter, (1-R). The value (1-R) is 0 when the two sets of coefficients are parallel, meaning that the two items, our synthetic respondents, show identical patterns. The value (1-R) is 2 when the two sets of coefficients are opposite.
- Use clustering to assign respondents to one of two clusters, or later one of three clusters. The criterion is that the variability within a cluster should be ‘small’ because the respondents show similar patterns of coefficients. In contrast, the variability across the centroids of the clusters should be large because the clusters are different groups.
- Once the respondents are assigned to the appropriate cluster (which of the two clusters, which of the three clusters), recompute the equation using the data from all respondents in a cluster.
Table 7 shows the performance of the elements for the Total Panel, for the two mind-sets, and for the three mind-sets. Just looking at the Table shows a number of shaded cells with coefficients of 21 or higher. High coefficients by themselves do not suffice, however. Rather, the coefficients must ‘tell a story’, and allow for interpretation.
The first clustering creating two mind-sets produces easily interpreted mind-sets.
Table 7: Coefficients emerging from clustering the 301 synthetic respondents into two mind-sets and then three mind-sets, based on the pattern of the coefficients for R54x (Motivates).
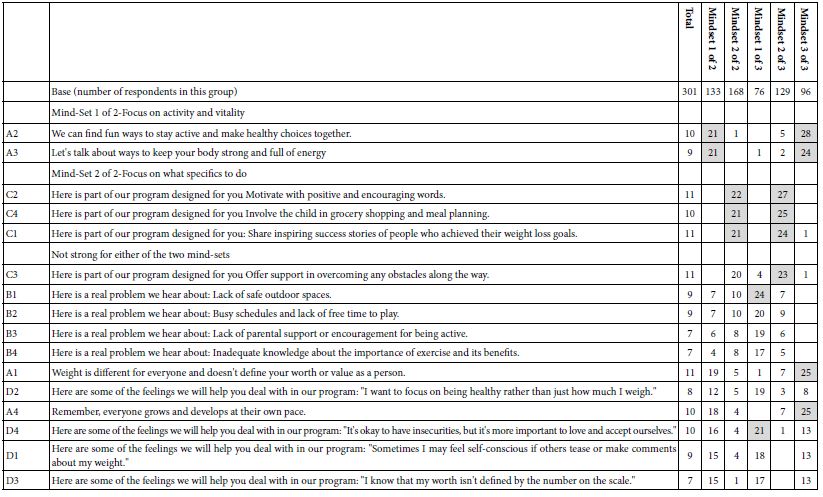
Mind-Set 1 of 2-Focus on Activity and Vitality
We can find fun ways to stay active and make healthy choices together.
Let’s talk about ways to keep your body strong and full of energy
Mind-Set 2 of 2-Focus on What Specifics to Do
Here is part of our program designed for you Motivate with positive and encouraging words.
Here is part of our program designed for you Involve the child in grocery shopping and meal planning.
Here is part of our program designed for you: Share inspiring success stories of people who achieved their weight loss goals.
In contrast, the three mind-set-solution produces elements with higher coefficients, but the underlying pattern is hard to interpret.
Our final analysis considers the performance of the elements using the IDT, Index of Divergent Thought [10]. The IDT attempts to quantify the degree to which the clustering generates truly different groups of people based upon the coefficients. Table 8 shows the computations. Optimal levels of the IDT are found in the range of 70-75. Higher values of the IDT (e.g., 80 or higher) mean that there are many high coefficients but not dramatically patterns of coefficients across the mind-sets Lower values of the IDT (e.g., 60 or lower) mean that there are many low coefficients, and once again the pattern of differences in coefficients across mind-sets is simply not dramatic.
For this study, and for others not reported here, the pattern of low values for the IDT continues to emerge when we deal with synthetic respondents. Here it is 47. Simply stated, the synthetic respondents may ‘work’ but do not yet produce dramatically stronger performance. As a starting point, however, it is gratifying to see that initial exploration into the AI does produce interpretable mind-sets.
Table 8: Calculation of the IDT, Index of Divergent Thought, for the synthesized data. The IDT is based on clustering coefficients estimated for R54x, patient is motivated.

Discussion and Conclusions
The emerging interest in AI generated respondents, so-called synthetic respondents, provides a new area of opportunity for the equally emerging science of Mind Genomics. As shown here, it is straightforward to craft a series of prompts to AI for a specific topic, these prompts being a description of ‘WHO’ the person is (our three medical professionals), how the person is to ‘JUDGE’ (the rating scale), and finally ‘WHAT’ the person is to judge (the vignette).
The Mind Genomics task is difficult for people. It presents combinations of elements which may or may not fit together, but which at least do not contradict each other. Yet, human beings can do it. What is remarkable is that AI can do the task, perhaps not as well as people because of the lower coefficients, but nonetheless AI can do the job.
What is most remarkable is that AI with synthetic respondents can deal with the two-sided scale, one side for motivating or not motivating the patient, the second side for the right versus the wrong thing said.
‘Looking to the meaning of the data, we can focus on both the philosophical issue of the ‘Turing Test’ and the use of the approach to create a body of knowledge for teaching. The issue of the Turing Test is a well known one in philosophy. Quite simply, can we create a test which to figure out whether a machine is a machine or a human being. The data here suggest that the Mind Genomics process can be reasonably mimicked by a machine, with the answers ‘making sense.’
Following quickly on the heels of the foregoing question is whether or not the Mind Genomics system can be engineering to become a teaching/learning system, wherein we design the persona to have a variety of emotional and other issues, and then evaluate the response of alternative descriptions of treatments. The sheer number of papers dealing with this issue of learning about interactions between groups of people is heartening [11-13]. This second avenue is likely to be the one more interesting, and ultimately more fruitful to researchers, to philosophers and to society alike.
Acknowledgment
The senior author, HRM, dedicates this paper to the memory of a mentor whom he never met, but who was instrumental in his thinking since 1965. The mentor is the late Harvard University professor, Anthony Gervin Oettinger of blessed memory, who laid the foundation of HRM’s interest in artificial intelligence. It was Professor Oettinger who planted the seeds of this paper almost six decades ago, in his offer to have the author participate in the 1960’s Harvard project, TACT, Technical Aids to Creative Thought. Thank you Tony. This paper is for you.
References
- Dave T, Athaluri SA, Singh S (2023) ChatGPT in medicine: an overview of its applications, advantages, limitations, future prospects, and ethical considerations. Frontiers in Artificial Intelligence 6: p.1169595. [crossref]
- Campbell RT, Hudson CM (1985) Synthetic cohorts from panel surveys: An approach to studying rare events. Research on Aging 7: 81-93. [crossref]
- Dang HAH, Dabalen AL (2019) Is poverty in Africa mostly chronic or transient? Evidence from synthetic panel data. The Journal of Development Studies 55: 1527-1547.
- Dang HAH, Lanjouw PF (2018) Poverty dynamics in India between 2004 and 2012: Insights from longitudinal analysis using synthetic panel data. Economic Development and Cultural Change 67: 131-170.
- Gofman A, Moskowitz H (2010) Isomorphic permuted experimental designs and their application in conjoint analysis. Journal of Sensory Studies 25: 127-145.
- Moskowitz HR (2012) ‘Mind genomics’: The experimental, inductive science of the ordinary, and its application to aspects of food and feeding. Physiology & Behavior 107: 606-613.
- Moskowitz HR, Gofman A (2007) Selling Blue Elephants: How to Make New Products That People Want Before They Even Know They Want Them. Pearson Education.
- Moskowitz HR, Martin D (1993) How Computer Aided Design and Presentation of Concepts Speeds up the Product Development Process. Proceedings of the ESOMAR Congress Copenhagen.
- Likas A, Vlassis N, Verbeek JJ (2003) The global k-means clustering algorithm. Pattern Recognition 36: 451-461. [crossref]
- Todri A, Papajorgji P, Moskowitz H, Scalera F (2020) Perceptions regarding distance learning in higher education, smoothing the transition. Contemporary Educational Technology 13: p.ep287.
- Berry DC, Michas IC, Gillie T, Forster M (1997) What do patients want to know about their medicines, and what do doctors want to tell them?: A comparative study. Psychology and Health 12: 467-480.
- Collins J, Farrall E, Turnbull DA, Hetzel DJ, Holtmann G, et al. (2009) Do we know what patients want? The doctor-patient communication gap in functional gastrointestinal disorders. Clinical Gastroenterology and Hepatology 7: 1252-1254. [crossref]
- Kay M, Mitchell G, Clavarino A (2010) What do doctors want? A consultation method when the patient is a doctor. Australian Journal of Primary Health 16: 52-59. [crossref]