DOI: 10.31038/AFS.2022415
Abstract
An investigation was carried out at three selected stations in Salimpur sea beach in the Bay of Bengal, Chittagong, with special reference to abundance, composition, and a taxonomic group of zooplankton. Samples were collected from three stations these are ship-breaking yard, Salimpur mangrove forest area, fishery ghat Salimpur during monsoon (15/10/2019), and post-monsoon (15/01/2020). A total of 7 groups of zooplankton were identified. Copepods were the most important constituents of the zooplankton in all areas. Copepods accounted for 30.71%, 32.81%, 34.05% during monsoon and 25.75%, 25.96%, 27.31% during post-monsoon of the total zooplankton population. The other dominant constituents were Fish larvae (20.71%), Shrimp larvae (20.18%), Crab larvae (16.84%), sagitta (5.14%) which are the maximum of the total zooplankton population. The minimum density of Copepod is (55.89 ind/m3) and the maximum density is (71.84ind/m3) recorded in January. During October this transverse into (65.64 ind/m3) in minimum and (101.94 ind/m3) in maximum. The high density of copepods shows a significant relationship between zooplankton and the environmental condition that work as an indicator of pollution.
Keywords
Zooplankton; Mangrove; Post-monsoon; Abundance; Biodiversity
Introduction
Zooplankton is microscopic animals that act as primary and secondary links in the food webs of all aquatic ecosystems. They feed on phytoplankton which directly provides a food source for larval vertebrates and invertebrates as well as related to the growth of juvenile and larger fish. Zooplankton is a marine microorganism with a swimming pool against major currents. Though limited in their ability to swim, they move day and night at intervals of hundreds of feet. They prefer to feed at night on the surface of the water and successfully feed on phytoplankton, which is why they are called living organisms. They tend to represent important interactions between the parasitic particles and large grazers [1]. In the tropics lead to fish production from human exploitation. Natural marine life is linked to the abundance of zooplankton and biodiversity. The viability of pelagic marine fish directly or indirectly depends on the discovery of zooplankton. In aquatic waters, zooplankton is used as an indicator of physiological, chemical, and biological processes due to its widespread distribution, small size, and rapid growth rates [2], high density, short life span, ecological diversity, of various types and tolerances of stress [3]. In food webs, organisms of the zooplankton represent a link from autochthonous material to higher trophic levels, e.g. juvenile riverine fish, which use backwaters as feeding grounds [4].
FAO’s survey report (1985) stated that Bangladesh’s tidal areas are rich in zooplankton. The abundance of zooplankton and its ecosystems in Bangladesh’s coast and harbors is rarely studied. [5] studied zooplankton in the northeastern part of the Bangladesh coast and found 18 genera and 18 species. [6] observed the macro-zooplankter of the continental shelf in the Bay of Bengal and reported on the occurrence and distribution of 18 calanoid copies. [7] recorded occasional variations of zooplankton in coastal waters in the southeastern part of Bangladesh. The major groups of zooplankton are copepods, Decapoda, Chaetognatha, cladocerans and fish, and shellfish. Zooplankton diversity of the saltwater area of the Bakkhali river, Cox’s Bazar, Bangladesh was also studied by [8]. The coastal area contains sensitive land and aquatic areas, such as mangrove forests, wetlands, and wet flats. On the shores of Sitakunda in the Chittagong region, the northeastern part of the Bay of Bengal is located near the Sandwip Chanel, which has wave particles, shipwrecks, and a community of fishermen and an important source of fishery resources. The purpose of this study is to provide more information on the quantity and structure of the zooplankton community in the coastal waters of Salimpur coast, north of the city of Chittagong, currently involved in coastal shipping operations.
As an important link in the conversion of energy from producers to consumers, free-living zooplanktonic organisms are a fundamental element of the aquatic environment. Organic zooplanktonic organisms are indicators of water quality bio due to their growth and distribution are closely related to natural boundaries. Zooplankton communities are often used as important tools to find changes in water quality and to assess the health of rural aquatic bodies.
The Zooplankton site is a group of different heterotrophic species that consume phytoplankton that stimulate nutrients through their metabolism and transfer energy to higher trophic levels (Deborah et al, 2010). Zooplanktons are playing a significant role in the ecosystem, as they are the second-largest food chain in the world. They play a key role in the transfer of power within their environment. They are found in the pelagic area of lakes, lakes, rivers, and the sea where light enters. Zooplankton releases much organic matter, which dissolves and converts into the biomass of various bacteria. The zooplankton community is made up of major and second-largest consumers. They provide a direct link between early producers and high trophic levels as almost all fish depend on zooplankton for food during their caterpillar phase, while other fish continue to consume zooplankton throughout their lives (Madin et al. 2001).
The purpose of this study is to provide more information on the quantity and structure of the zooplankton community in the coastal waters of Salimpur coast, north of the city of Chittagong, currently involved in coastal shipping operations, to identify critical issues affecting the potential of zooplankton community structures, and to provide a monitoring tool to improve the water quality of water for future studies.
Objectives of the Study
- To identify and get an account of the zooplankton community of the Salimpur coast.
- To determine the abundance and distribution of zooplankton along with some Physico-chemical parameters of the study area.
The Study Area
Zooplankton collection and finding the quantity of zooplankton assigned to be 3 areas selected. The stations were a Salimpur ship-breaking yard, the Salimpur mangrove area, and the Salimpur fishery ghat area.
Station 1: Sampling station 1 is Salimpur ship breaking yard. It is a polluted area with heavy metal and oil pollution.
Station 2: This station is salimpur mangrove forest area, highly vegetation with biologically enhanced site.
Station 3: Sampling station 3 is fishery ghat of salimpur.
Geological position of three stations (Figure 1 and Table 1).
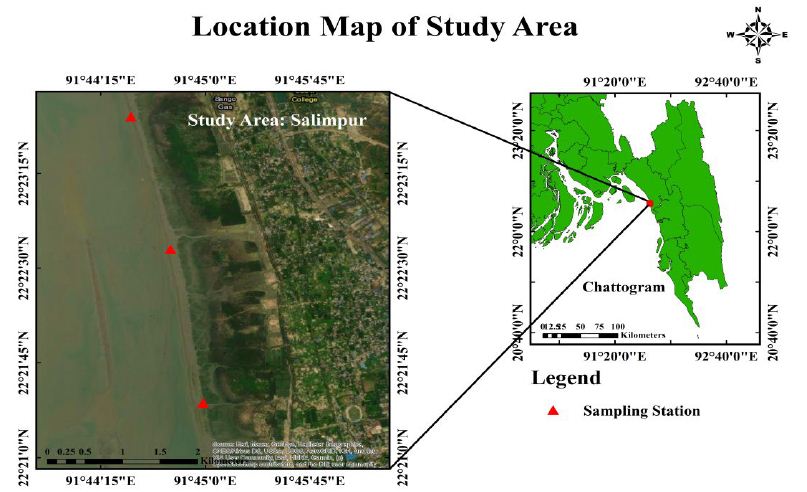
Figure 1: Study area
Table 1: GPS location of the study area
|
Station No. |
GPS Coordinate |
| 01. | 22°21ʹ26ʺ N, 91°44ʹ59ʺ E |
| 02. | 22°22ʹ39ʺ N, 91°44ʹ45ʺ E |
| 03. | 22°23ʹ42ʺ N, 91°44ʹ28ʺ E |
Methods and Materials
Sampling Period
- In Post Monsoon (October 15)
- In monsoon (January 15)
Investigation in Salimpur was carried out during Post Monsoon (October) and Monsoon (January) periods. Samples are collected from three selected stations. All samples were taken during high tide.
The sample was collected from three stations Salimpur sea beach. From post-monsoon October 15 2019 to winter 15 January 2020, two sampling data were collected. In this data collection, 3 stations were under data collection. All samples were taken during high tide. We have used mechanized boats to collect samples and to measure the other parameters of seawater like water temperature, water pH, water salinity, water transparency, DO.
Collection and Preservation of Zooplankton
Zooplankton sampling was carried out with the help of a conical zooplankton net made of Nylon Silk of 335-micrometer mesh size and having 12 cm circular mouth opening fitted with a plastic bucket at the cod. A digital flow meter was set up at the mouth of the net to record the amount of water filtered through the net during sampling. Samples were collected at the three sampling stations from the surface water for 10 to 15 min. After collecting samples were preserved in 5% formalin.
Staining and Sorting
For efficient sorting, the samples were stained with eosin and left for over the night. All the zooplankton attained reddish color rendering easy identification. The stained plankton was stored out from debris with a fine brush, needle, forceps and low power microscope was used during sorting. The sorted organisms were preserved in 70% ethanol.
Identification and Counting
The sorted organisms were brought under microscope and identified following [9-14] etc. In each catch, the total number of the individual count was done either by complete counting or by sub-sampling.
Interpretation of Data
The zooplankton concentration was calculated at individuals/m3. Where the total volume of water (m3) filtered through the net was calculated by using the following equation:
Total volume of water (m)={(FR-IR) × coefficient} × 2πr^2
Where,
FR=Final Reading
IR=Initial Reading
Co-efficient=0.3
π=3.1416
r=Radius of ring of used at plankton net=12 cm
The abundance of Zooplankton (individuals/m3)=Number of species in each group/volume of water.
Physiochemical Parameters
Sample Collection and Preservation
Water samples were taken from the surface with a bucket for the determination of different Physicochemical parameters. Data collection was collected by a different digital machine.
In situ Determination of Physicochemical Factor
Air and Water Temperature. Air and water temperature was measured by using a graduated centigrade thermometer.
Water Salinity. The water salinity was determined by using a Salinity Refractometer (tank new-100) and a digital salinity meter.
Hydrogen ion concentration of water (pH). For determining hydrogen ion concentration (pH), a digital pH meter was used.
Transparency. Water Transparency was determined by using a white Secchi disk of 30 cm diameter.
Determination of dissolved oxygen (DO). For determining dissolved oxygen (D.O), a digital DO meter was used.
Determination of TDS (mg/l). For determining Total Dissolved Solids (TDS), a digital TDS meter was used.
Determination of TSS (mg/l). At first, a filter paper was oven-dried for moisture-free at 60°C for 30 minutes. Then it will be kept into desiccators for cooling and then it will be weighted by an electric balance. Then a thoroughly mixed 100 ml samples will be filtered through the weighted filter paper. The filter paper will be allowed to dry completely and reweighted. The weight change will be multiplied by 10, thus total suspended solids (T.S.S) in 1L of water sample will be obtained.
Species Diversity Analysis
Zooplankton assemblage data were analyzed with the Plymouth Routines in Multivariate Ecological Research (PRIMER) statistical package version 6 (Clarke and Warwick, 06). Diversity of the species assemblage was analyzed by the Shannon-Wiener index (H’) [15-21], species richness was measured by Margalef index (d) and evenness was measured by Pielou’s index (J’) (Pielou, 1966). The value of the Shannon-Wiener index, Margalef index, and Pielou’s index calculated by the following formula:
Shannon-Wiener Diversity Index (H’)
H’=-∑ Pi × ln (Pi)
Where,
H’=Shannon-Wiener diversity index;
Pi=n/N; [n=No. Of individuals of species]
N=Total individuals;
Margalef Richness Index (d):
d=(s-1)/ln (n)
where,
S=Total species;
N=Total individuals;
Pielou’s Evenness Index (J’)
J’=H(s)/H(max)
Where,
H(s)=Shannon-Wiener information function
H(max)=The theoretical maximum value for H(s), if all species in the samples are equally abundant.
Result
Data Collection of Monsoon
Data Collection of Monsoon is shown in Figures 2-5 and Tables 2-9.
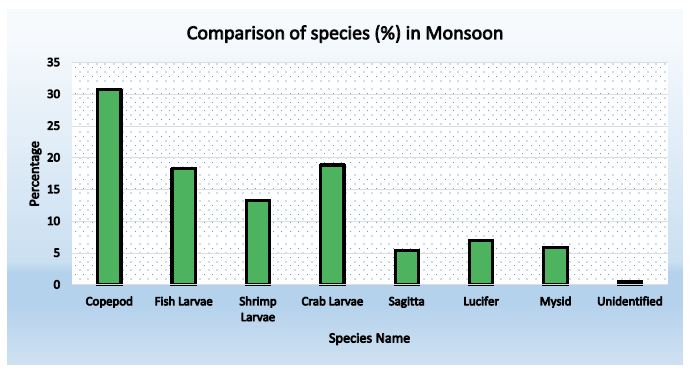
Figure 2: Abundance of zooplankton during Monsoon (Station-1)
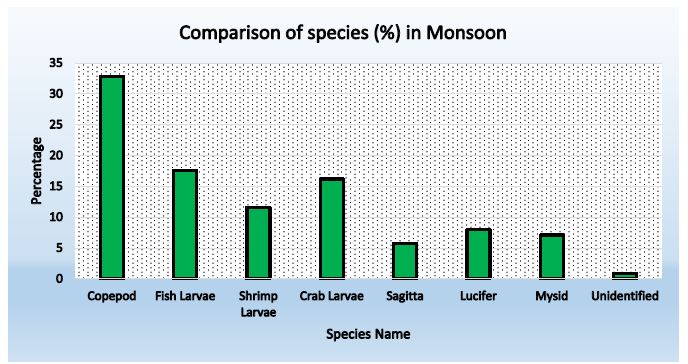
Figure 3: Abundance of zooplankton in Monsoon ( Station-2)
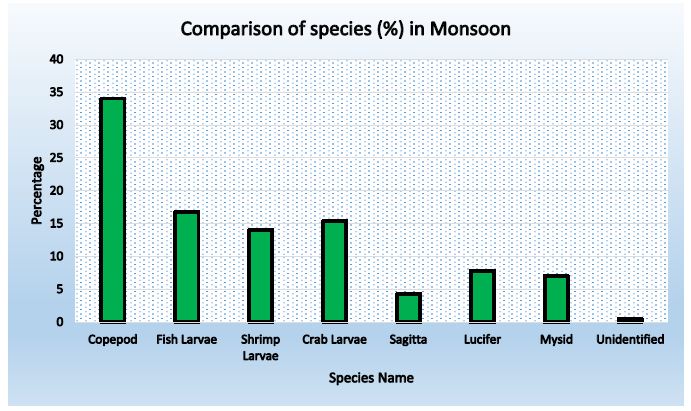
Figure 4: Abundance of zooplankton in Station-3 during Monsoon
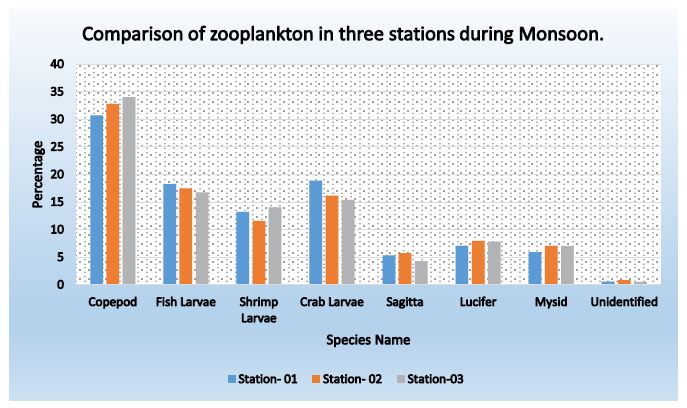
Figure 5: Comparison of species found in three stations during monsoon period
Table 2: Physiochemical parameters in Station- 1 during monsoon
| Water temperature | 22º c |
| Air temperature | 25º c |
| Water transparency | 6 cm |
| pH | 7.9 |
| Salinity | 19 PPT |
| DO | 2.48 mg/L |
| BOD | 1.42 mg/L |
| TDS | 21.88 g/L |
| TSS | 276 mg/L |
| EC | 33.68 ms/cm |
| PO4-P | 0.64 ug/L |
| NO2-N | 0.95 ug/L |
Table 3: Species composition in station-1 during monsoon
|
Station- 01 |
|||
| Name of Species | Number of Individuals | Abundance (Ind/m3) |
Percentage (%) |
| Copepod |
109 |
55.89 |
30.71 |
| Fish Larvae |
65 |
33.30 |
18.29 |
| Shrimp Larvae |
47 |
24.10 |
13.24 |
| Crab Larvae |
67 |
34.36 |
18.88 |
| Sagitta |
19 |
9.74 |
5.35 |
| Lucifer |
25 |
12.82 |
7.04 |
| Mysid |
21 |
10.77 |
5.92 |
| Unidentified |
2 |
1.03 |
0.57 |
|
=265 |
=182.01 |
=100% |
|
Table 4: Physiochemical parameters in Station- 2 during monsoon
| Water temperature | 22 c |
| Air temperature | 26 c |
| Water transparency | 6 cm |
| pH | 7.8 |
| Salinity | 21 PPT |
| DO | 2.95 mg/L |
| BOD | 1.2 mg/L |
| TDS | 18.36 g/L |
| TSS | 311 mg/L |
| EC | 32.40 ms/cm |
| PO4-P | 0.81 ug/L |
| NO2-N | 1.12 ug/L |
Table 5: Species composition in station- 2 during monsoon
|
Station- 02 |
|||
| Name of Species | Number of Individuals | Abundance (Ind/m3) |
Percentage (%) |
| Copepod |
148 |
71.84 |
32.81 |
| Fish Larvae |
79 |
38.35 |
17.52 |
| Shrimp Larvae |
53 |
25.73 |
11.61 |
| Crab Larvae |
73 |
35.44 |
16.19 |
| Sagitta |
26 |
12.62 |
5.76 |
| Lucifer |
36 |
17.48 |
7.98 |
| Mysid |
32 |
15.53 |
7.09 |
| Unidentified |
4 |
1.94 |
0.87 |
|
=321 |
=218.93 |
=100% |
|
Table 6: Physiochemical parameters at Station- 3 during monsoon
| Water temperature | 23 c |
| Air temperature | 26 c |
| Water transparency | 7 cm |
| pH | 7.9 |
| Salinity | 22 PPT |
| DO | 3.36 mg/L |
| BOD | 1.18 mg/L |
| TDS | 22.09 g/L |
| TSS | 214 mg/L |
| EC | 33.23 ms/cm |
| PO4-P | 0.92 ug/L |
| NO2-N | 1.45 ug/L |
Table 7: Species composition in station- 3 during monsoon
|
Station- 03 |
|||
| Name of Species | Number of Individuals | Abundance (Ind/m^3) |
Percentage (%) |
| Copepod |
126 |
62.69 |
34.05 |
| Fish Larvae |
62 |
30.85 |
16.76 |
| Shrimp Larvae |
52 |
25.87 |
14.05 |
| Crab Larvae |
57 |
28.36 |
15.41 |
| Sagitta |
16 |
7.96 |
4.32 |
| Lucifer |
29 |
14.43 |
7.84 |
| Mysid |
26 |
12.94 |
7.03 |
| Unidentified |
2 |
0.99 |
0.54 |
|
=370 |
=184.09 |
=100% |
|
Table 8: Comparison of physiochemical parameters in three stations during monsoon
| Parameters | Station 1 | Station 2 | Station 3 |
| Water temperature | 22º c | 22 c | 23 c |
| Air temperature | 25º c | 26 c | 26 c |
| Water transparency | 6 cm | 6 cm | 7 cm |
| pH | 7.9 | 7.8 | 7.9 |
| Salinity | 19 PPT | 21 PPT | 22 PPT |
| DO | 2.48 mg/L | 2.95 mg/L | 3.36 mg/L |
| BOD | 1.42 mg/L | 1.2 mg/L | 1.18 mg/L |
| TDS | 21.88 g/L | 18.36 g/L | 22.09 g/L |
| TSS | 276 mg/L | 311 mg/L | 214 mg/L |
| EC | 33.68 ms/cm | 32.40 ms/cm | 33.23 ms/cm |
| PO4P | 0.64 ug/L | 0.81 ug/L | 0.92 ug/L |
| NO2N | 0.95 ug/L | 1.12 ug/L | 1.45 ug/L |
Table 9: Comparison of species found in three stations during monsoon period
|
Name of Species |
Percentage | Average | ||
| Station- 01 | Station- 02 |
Station- 03 |
||
| Copepod |
30.71 |
32.81 | 34.05 |
32.52 |
| Fish Larvae |
18.29 |
17.52 | 16.76 |
17.52 |
| Shrimp Larvae |
13.24 |
11.61 | 14.05 |
12.96 |
| Crab Larvae |
18.88 |
16.19 | 15.41 |
16.83 |
| Sagitta |
5.35 |
5.76 | 4.32 |
5.14 |
| Lucifer |
7.04 |
7.98 | 7.84 |
7.62 |
| Mysid |
5.92 |
7.09 | 7.03 |
6.68 |
| Unidentified |
0.57 |
0.87 | 0.54 |
0.66 |
Data Collection of Post-Monsoon
Data Collection of Post-Monsoon is shown in Figures 6-10 and Tables 10-17.
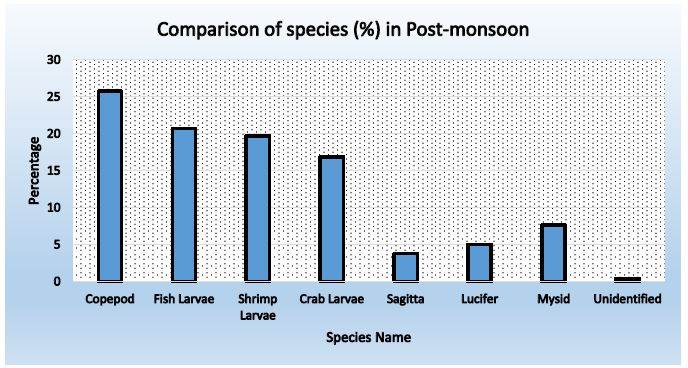
Figure 6: Abundance of zooplankton in station-1 during post-monsoon
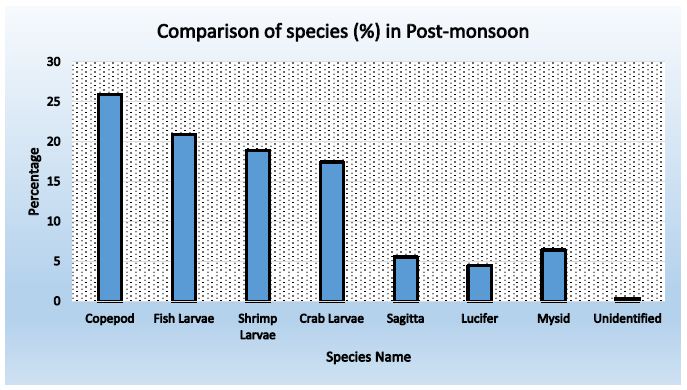
Figure 7: Abundance of zooplankton in Station-2 during post-monsoon
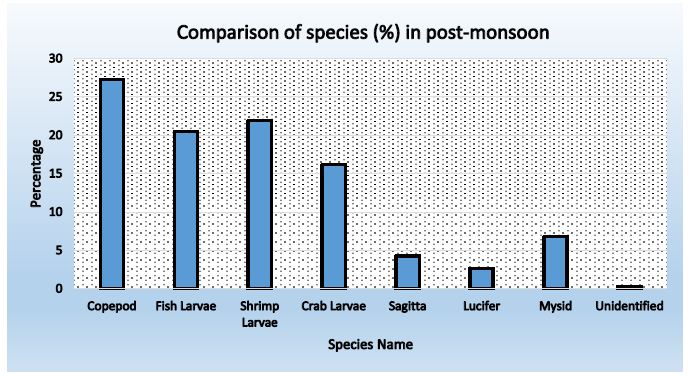
Figure 8: Abundance of zooplankton in station-3 during post-monsoon
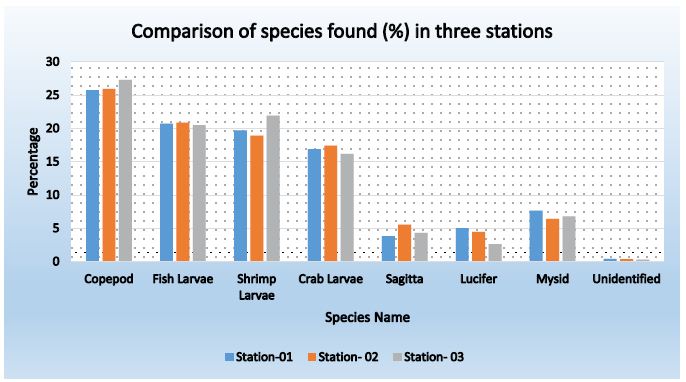
Figure 9: Comparison of species found (%) in three stations during Post-monsoon
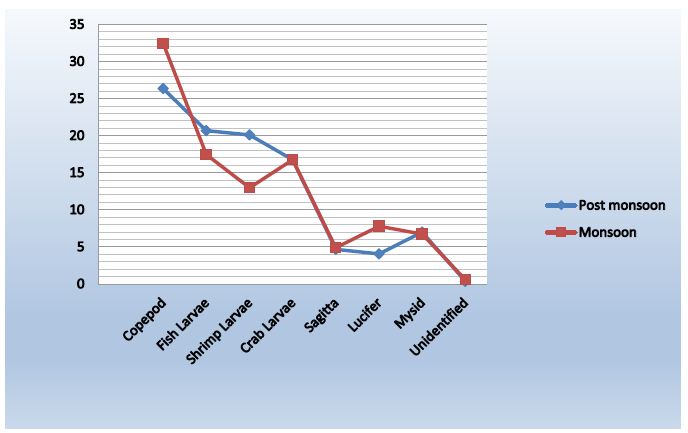
Figure 10: Abundance Variation of zooplankton between post-monsoon & monsoon
Table 10: Physiochemical parameters at Station-1 during post-monsoon
| Water temperature | 29º c |
| Air temperature | 32º c |
| Water transparency | 10 cm |
| pH | 7.6 |
| Salinity | 14 PPT |
| DO | 5.12 mg/L |
| BOD | 2.90 mg/L |
| TDS | 2.02 g/L |
| TSS | 182 mg/L |
| EC | 3.40 ms/cm |
| PO4-P | 2.80 ug/L |
| NO2-N | 2.58 ug/L |
Table 11: Species found in station-1 during Post-monsoon
|
Station- 01 |
|||
| Name of Species | Number of Individuals | Abundance (Ind/m3) |
Percentage (%) |
| Copepod |
128 |
65.64 |
25.75 |
| Fish Larvae |
103 |
52.82 |
20.72 |
| Shrimp Larvae |
98 |
50.26 |
19.72 |
| Crab Larvae |
84 |
43.08 |
16.90 |
| Sagitta |
19 |
9.74 |
3.82 |
| Lucifer |
25 |
12.82 |
5.03 |
| Mysid |
38 |
19.49 |
7.65 |
| Unidentified |
2 |
1.03 |
0.40 |
|
=497 |
=254.88 |
=100% |
|
Table 12: Physiochemical parameters at Station-2 during post-monsoon
| Water temperature | 29 ºc |
| Air temperature | 32º c |
| Water transparency | 12 cm |
| pH | 7.4 |
| Salinity | 14 PPT |
| DO | 5.71 mg/L |
| BOD | 2.50 mg/L |
| TDS | 2.42 g/L |
| TSS | 114 mg/L |
| EC | 4.56 ms/cm |
| PO4-P | 2.36 ug/L |
| NO2-N | 2.58 ug/L |
Table 13: Species found in station-2 during post-monsoon
|
Station- 02 |
|||
| Name of Species | Number of Individuals | Abundance (Ind/m3) |
Percentage (%) |
| Copepod |
210 |
101.94 |
25.96 |
| Fish Larvae |
169 |
82.04 |
20.89 |
| Shrimp Larvae |
153 |
74.27 |
18.91 |
| Crab Larvae |
141 |
68.45 |
17.43 |
| Sagitta |
45 |
21.84 |
5.56 |
| Lucifer |
36 |
17.48 |
4.45 |
| Mysid |
52 |
25.24 |
6.43 |
| Unidentified |
3 |
1.46 |
0.37 |
|
=809 |
=392.72 |
=100% |
|
Table 14: Physicochemical parameters in station-3 during post monsoon
| Water temperature | 31º c |
| Air temperature | 33º c |
| Water transparency | 13 cm |
| pH | 7.4 |
| Salinity | 15 PPT |
| DO | 5.88 mg/L |
| BOD | 2.32 mg/L |
| TDS | 2.88 g/L |
| TSS | 110 mg/L |
| EC | 4.99 ms/cm |
| PO4-P | 2.18 ug/L |
| NO2-N | 1.92 ug/L |
Table 15: Species found in station-3 during post-monsoon
|
Station- 03 |
|||
| Name of Species | Number of Individuals | Abundance (Ind/m3) |
Percentage (%) |
| Copepod |
177 |
88.06 |
27.31 |
| Fish Larvae |
133 |
66.17 |
20.52 |
| Shrimp Larvae |
142 |
70.65 |
21.91 |
| Crab Larvae |
105 |
52.24 |
16.20 |
| Sagitta |
28 |
13.93 |
4.32 |
| Lucifer |
17 |
8.46 |
2.62 |
| Mysid |
44 |
21.89 |
6.79 |
| Unidentified |
2 |
0.99 |
0.31 |
|
=648 |
=322.39 |
=100% |
|
Table 16: Comparison of physiochemical parameter during Post-monsoon
|
Post Monsoon |
|||
| Parameters | Station 1 | Station 2 |
Station 3 |
| Water temperature |
29º c |
29 ºc |
31º c |
| Air temperature |
32º c |
32º c |
33º c |
| Water transparency |
10 cm |
12 cm |
13 cm |
| pH |
7.6 |
7.4 |
7.4 |
| Salinity |
14 PPT |
14 PPT |
15 PPT |
| DO |
5.12 mg/L |
5.71 mg/L |
5.88 mg/L |
| BOD |
2.90 mg/L |
2.50 mg/L |
2.32 mg/L |
| TDS |
2.02 g/L |
2.42 g/L |
2.88 g/L |
| TSS |
182 mg/L |
114 mg/L |
110 mg/L |
| EC |
3.40 ms/cm |
4.56 ms/cm |
4.99 ms/cm |
| PO4-P |
2.80 ug/L |
2.36 ug/L |
2.18 ug/L |
|
NO2-N |
2.58 ug/L |
2.58 ug/L |
1.92 ug/L |
Table 17: Comparison of species found in three stations during Post-monsoon
|
Name of Species |
Percentage |
Average |
||
|
Station-01 |
Station- 02 |
Station- 03 |
||
| Copepod |
25.75 |
25.96 | 27.31 |
26.34 |
| Fish Larvae |
20.72 |
20.89 | 20.52 |
20.71 |
| Shrimp Larvae |
19.72 |
18.91 | 21.91 |
20.18 |
| Crab Larvae |
16.90 |
17.43 | 16.20 |
16.84 |
| Sagitta |
3.82 |
5.56 | 4.32 |
4.56 |
| Lucifer |
5.03 |
4.45 | 2.62 |
4.03 |
| Mysid |
7.65 |
6.43 | 6.79 |
6.96 |
| Unidentified |
0.40 |
0.37 | 0.31 |
0.36 |
Biodiversity Index
Shannon-Wiener Diversity Index
H’=-∑ pi× ln (pi)
Where,
H’=Shannon-Wiener diversity index;
Pi=n/N; [n=No. Of individuals of species]
N=Total individuals;
Shannon-Wiener Diversity Index
|
Station |
Post Monsoon |
Monsoon |
|
01 |
1.7900 | 1.7956 |
| 02 | 1.7930 |
1.8131 |
| 03 | 1.7996 |
1.7797 |
Margalef Richness index (d):
d=(s-1)/ln(n)
where:
S=Total species
N=Total individuals
Richness
|
Station |
Post Monsoon |
Monsoon |
| 01 | 1.2885 |
1.3642 |
|
02 |
1.3441 | 1.6363 |
| 03 | 1.2357 |
1.3528 |
Pielou’s Evenness Index (J’)
J’=H(s)/H(max)
Where,
H(s)=Shannon-Wiener information function;
H(max)=The theoretical maximum value for H(s), if all species in the samples are equally abundant.
Evenness
|
Station |
Post Monsoon | Monsoon |
| 01 | 0.8147 |
0.8172 |
|
02 |
0.7787 | 0.7561 |
| 03 | 0.8190 |
0.8099 |
Discussion
Distribution and Abundance of Zooplankton
Zooplankton samples were sorted out into 7 major groups namely Copepod, Fish larvae, shrimp larvae, Crab larvae, Sagitta, Lucifer, mysid.
Total number of zooplankton varied from 182.01 Ind/m3 to 392.72 Ind/m3 in studied are throughout the research period.
Copepods
The number of Copepods during monsoon was recorded 34.05 % as the highest percentage. The lowest amount was found in post monsoon which is 26. 34%. The abundance density was found 55.89 ind/m3, 71.84 ind/m3, 62.69 ind/m3 in monsoon and 65.64 ind/m3, 101.94 ind/m3, 88.06 ind/m3 in post monsoon.
Fish Larvae
From the recorded data, we saw that the percentage of fish larvae in post monsoon is higher than the percentage in monsoon. It is 20.71 % and 17.52 %. The abundance density in post monsoon was 52.82 ind/m3, 82.04 ind/ m3 and 66.17 ind/ m3. And 33.30 ind/ m3, 38.35 ind/ m3, 30.85 ind/ m3 in monsoon.
Shrimp Larvae
In monsoon, the amount of shrimp larvae was 12.96% and in post monsoon it increased to 20.18%. It was a little bit lower in monsoon than in post monsoon.
Crab Larvae
The percentages of crab larvae during post monsoon were 16.90% 17.43% 16.20%and in monsoon were 18.88%, 16.19%, 15.41%. That is the average is almost close in post monsoon and monsoon.
Sagitta
The amount of Sagitta in post monsoon was recorded 5.14% and in monsoon it was 4.56 %.That is in monsoon it was a little bit more than post monsoon. The abundance density was found 9.74 ind/ m3, 21.84 ind/ m3, 13.93 ind/ m3 in post monsoon and 9.74 ind/ m3, 12.62 ind/ m3, 7.96 ind/ m3 in monsoon.
Lucifer
From the recorded information, in monsoon it was quite a large amount of Lucifer then In post monsoon. 7.62 % in monsoon and 4.03% in post monsoon.
Mysid
Both in monsoon and post monsoon, percentages were almost the same. In monsoon it was 6.88 % and in post monsoon it was 6.96%. The abundance density was 19.49 ind/ m3 , 25.24 ind/ m3 and 21.89 ind/ m3 in post monsoon. And in monsoon it was 10.77 ind/ m3, 15.53 ind/ m3 and 12.94 ind/ m3 .
Shannon Diversity
In Shannon diversity index(H¢) the highest value was recorded 1.8131 at station-2 during Monsoon, and the lowest value was recorded 1.7797 at station-3 during monsoon. . As the value was higher in station-2 it is well diverse than others station.
In post-monsoon the highest value was recorded 1.7996 at station-3 and lowest value was 1.7900 at station-1. As the value was higher in station-3 it is well diverse than others station.
Pielou¢s Evenness Index
The evenness (J¢) was ranges between 0.7561 to 0.8172 during monsoon and 0.7787 to 0.8190 during post monsoon in the study area.
The highest value was found in Station 3 during post monsoon.
Margalef Richness Index
The richness (d) was found in a range of 1.35 to 1.63 at monsoon and 1.23 to 1.34 during post monsoon.
The highest value was found in Station 02 during monsoon.
Hydrological Parameters
Temperature
Water temperature is very important for aquatic organism. In the monsoon season the water temp was around 29-31°C and the air temperature was around 31-33°C. In winter season the water temperature was recorded 22-24°C and the air temperature was around 24-26°C.
PH
PH is one of the major factor for aquatic environment .The highest value was found 7.9 and lowest was recorded 7.4.
Water Transparency
The highest transparency of water was highest recorded 13 cm and lowest was 6 cm.
Dissolved Oxygen
In post monsoon season the dissolved oxygen (DO) was recorded 5.12-5.88 ml/L and in the monsoon 2.48-3.36 mg/L.
Salinity
In the post monsoon season the salinity was recorded around 14-16 PPT and in the monsoon season the salinity was recorded around 19-23 PPT.
BOD
In post monsoon season the Biological oxygen demand (BOD) was recorded 2.32-2.90 mg/L and In monsoon the Biological oxygen demand (BOD) was recorded 1.18-1.42 mg/L.
TDS
In post monsoon season the total dissolved solid (TDS) was recorded 2.02-2.88 mg/L and in monsoon, total dissolved solid was recorded 19.88-22.23 mg/L.
TSS
In post monsoon season total suspended solids (TSS) was recorded 110-182 mg/L and in monsoon season total suspended solids was recorded 214-311 mg/L.
Limitation of the Study
Currently in the current study on the inequality of sampling and disruption therefore due to the covid-19 pandemic condition. Further study is needed for a concrete conclusion
Conclusion
There are some differences between the three stations. The abundance of zooplankton is higher in station-02 which is mangrove forest area coast, Salimpur. Abundance is high here because of suitable parameters & nutrients, and it is a less polluted station than others. From the research, it is clear that the abundance in station-03 is a bit low and station-01 is the lowest. Station-03 is a fishery ghat and station 01 is a ship breaking yard. Such an environment is risky for the abundance of zooplankton.
Acknowledgement
I would like to thank our honourable director Dr, Md. Shafiqul Islam who gave me this opportunity to do this research and our lab technician for helping us at the time of lab analysis and all whom helped us in this research.
References
- Laval-Peuto Michèle, John F Heinbokel, Roger Anderson O, Fereidoun Rassoulzadegan, Barry Sherr F (1986) Role of Micro- and Nanozooplankton in Marine Food Webs. International Journal of Tropical Insect Science 7: 387-395.
- Heinbokel JF (1978) Studies on the Functional Role of Tintinnids in the Southern California Bight. I. Grazing and Growth Rates in Laboratory Cultures. Marine Biology 53: 23-32.
- Gajbhiye SN (2002) Zooplankton Study Methods,Importance and Significant Observations. Proceedings of the National Seminar on Creeks, Estuaries and Mangroves – Pollution and Conservation 21-27.
- Kurmayer R, Keckeis H, Schrutka S, Zweimueller I (1996) Macro- and microhabitat used by 0+ fish in a side-arm of the River Danube Arch. Hyrobiol Suppl 113: 425-432.
- Islam AKMN, Aziz A (1975) A preliminary study on zooplankton of the North-eastern Bay of Bengal. Bangladesh journal of Zoology 3: 125-138.
- Bhuiyan AL, Mohis A, Das NG (1982) Macro zooplanktons of the continental shelf of The Bay of Bengal. Ctg. Uni. Studies, part (ii) 651: 59.
- Ali A, Shukanta S, Mahmood N (1985) Seasonal abundance of plankton in Moheshkhali channel, Bay of Bengal. In proceedings of SAARC seminar on Protection of Environment from Degradation, Dhaka, Bangladesh 128- 140.
- Ali M (2006) Zooplankton diversity of salt marsh habitat in the Bakkhali river estuary, Cox’s Bazar, Bangladesh. 4th year project paper, Institute of Marine Sciences and Fisheries (IMSF), University of Chittagong, 56.
- Zafar M (1986) Study on the zooplankton of Shatkhira estuarine system in the vicinity of aquaculture farms with special reference to penaiedpost larvae. M.Sc. thesis, Institute of Marine Sciences and Fisheries, University of Chittagong 238.
- Smith SV, Hollibaugh JT (1993) Coastal Metabolism and the Oceanic Organic Carbon Balance. Reviews of Geophysics 31: 75-89.
- Afrin R (2006) Study on diurnal and tidal variation of zooplankton in the eastern coast of Saint Martin’s Island. Research paper, Institute of Marine Sciences and Fisheries, University of Chittagong 6.
- Kurmayer R, Keckeis H, Schrutka S, Zweimueller I (1996) Macro- and microhabitat used by 0+ fish in a side-arm of the River Danube Arch. Hyrobiol Suppl 113: 425-432.
- Madaputra M, Nair SRR, Achuthankutty CT, Nai VR (1981) Zooplankton abundance of around the Andaman-Nicoberisland. J. Mar. SC 17: 75-77.
- Sikder SC (1976) Taxonomy of cyclopoid copepods of the Karnaphuli river estuary. M.Sc. 45 Project (unpublished), Institute of Marine Sciences and Fisheries, University of Chittagong 22.
- Zafar M (2000) Study on Sergestid shrimp Acetes in the vicinity of Matamuhuri river confluence, Bangladesh. PhD. Thesis, (2000), University of Chittagong, Studies Sci 13: 115-122.
- Das S (1977) Taxonomy of calanoid copepods of Karnaphuli river estuary. M.Sc. project (unpublished), Institute of Marine Sciences and Fisheries, University of Chittagong 22.
- Goswami SC, Devassy VP (1991) Seasonal fluctuation in the occurrence of cladocera in the Madorizuari estuarine waters of Goa. J. Mar. Sci 20: 138-142.
- Mustafa S, Nair VR, Govinda V (1999) Zooplankton community of Bhayander and Thane saltplans around Bombay. Indian J. Mar. Sci. 28: 184-191.
- Khan MSK, Uddin SA, Haque MA (2015) Abundance and composition of zooplankton at Shitakundo coast in Chittagong, Bangladesh. Agric. Livest. Fish 2: 151-160.
- Mahmood N, Khan YSA (1980) On the occurrence of post larvae and juvenile Penaeid shrimp at Bakkhali river estuary. Final report of UGC research, Dhaka, Bangladesh 26.
- Khair SA, Bhuiyan AL, Das NG (1979) Distribution of Schmackeria lobipes of the Karnaphuli river estuary. M.Sc. thesis (unpublished), Institute of Marine Sciences and Fisheries, University of Chittagong 82.