DOI: 10.31038/JMG.2020332
Abstract
The review tries to list out maximum number of physical and chemical properties of amino acids, which are being used directly or indirectly in protein sequence comparison. Next it tries to sum up different types of methodologies used so far in protein sequence comparison based on physio-chemical properties of amino acids. It also tries to examine critically all the methods under mathematical precision. Finally it tries to point out how to modify the methods, in case they are not sound. It also suggests some possible open problems.
Purpose
The purpose of the review is three fold: First to highlight different types of methodologies used so far in connection with protein sequence comparison based on physio-chemical properties of amino acids; second to find out if there is any mathematical discrepancies in any one of the methodologies, and if so, to suggest proper way out to make them sound and workable; lastly to suggest some novel methods of comparison for protein sequence comparison based on physio-chemical properties of amino acids.
Pre-Requisites
To begin with, it may be mentioned that in case of genome sequences owing to Bio-chemical properties, the nucleotides are classified in the following groups: (R/Y) [Purine-Pyrimidine],(M/K) [Amino-Keto] and (W/S) [Weak-Strong H-Bonds], where R=(A, G) and Y=(C, T), M=(A, C) and K=(G, T), W=(A, T) and S=(C, G). Representations based on such classified groups are obtained for Genome sequences and methodologies are developed for their comparisons accordingly. But there is no method of comparison using directly Bio-chemical properties, because they are not enough for the purpose.
To discuss similar aspects in protein sequences, we are to understand what we actually mean by a protein sequence. In fact, by a protein sequence, we mean primary structure of a protein. Externally Protein’s primary structures are sequences of 20 peptides (amino acids). It is a polypeptide chain. The peptides are linked together just as the compartments of a train by what is called a peptide bond. As sequences, Protein’s primary structures differ externally due to the number and relative position of the peptides in the chain. So to understand protein sequences, we are to first understand structure of amino acids (peptides) given below:
Structure of Amino Acids
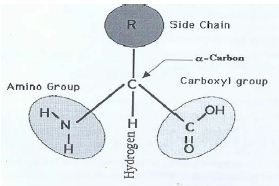
The α carbon is joined on the left by an amino group, on the right by a carboxyl (acid) group; this justifies the name amino acid. On the top it is connected by a R group, which gives the side chain and it is joined below by a H atom. This is a three dimensional structure formed by four vertices of a tetrahedron. This structure without R is called the backbone structure of the amino acid. By a protein sequence we mean sequences of backbone structures of its amino acids.
Mechanism of the Process
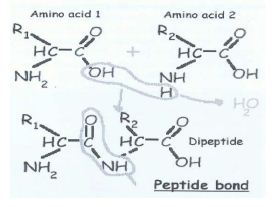
Individual amino acids are linked together, one after another. What happens is that a –OH group is removed from the first amino acid and H is removed from the next one linked to the first. As a whole, what is removed is a water molecule. The exposed broken bonds left on the two amino acids are then attached together, producing a linkage, called a peptide bond. It is a covalent bond. All amino acids have their back-bone structures same. They differ only in having different R group (side chains) as given below:
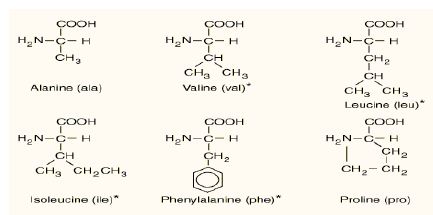
Amino Acids with Hydrocarbon R-groups (Six)
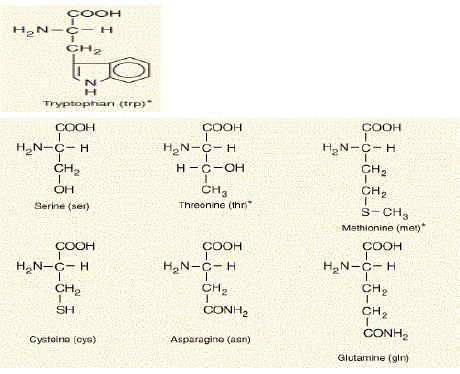
Amino Acids with Neutral R-Groups (Seven)
Seven of the twenty amino acids that make up proteins have neutral R-groups:
Amino Acids with Basic or Acidic R-Groups (Seven)
Seven of the twenty amino acids that make up proteins, six of them have acid or base R-groups. Glycine may be taken in this group also.

Glycine may be taken along with the six elements of the first group.
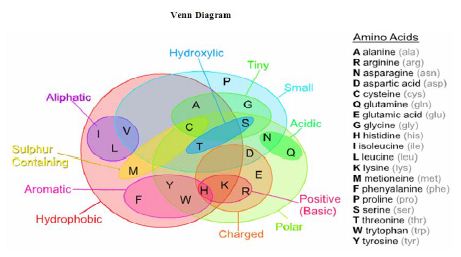
Amino acids can be broadly classified into two general groups based on the properties of the “R” group in each amino acid. Amino acids can be polar or non-polar. Polar amino acids have “R” groups that are hydrophilic, meaning that they seek contact with aqueous solutions. Polar amino acids may be positively charged (basic) or negatively charged (acidic). Non-polar amino acids are the opposite (hydrophobic) meaning that they avoid contact with liquid. Aliphatic amino acids are those non polar amino acids, which contains an aliphatic side chain. Aromatic amino acids are amino acids that have an aromatic ring in the side-chain. Details of the classifications are shown in the following Venn Diagram:
List of values of some of the Physical properties of amino acids:
| Amino Acid | Abb. | Sym. | Relative Dis. RD | Side-chain Mass | Specific Volume | Residue Volume | Residue Wt | Mole Vol |
| Alanine | Gly | S | .2227 | 15 | .64 | 43.5 | 71.08 | 31 |
| Cysteine | Ala | C | 1.000 | 47 | .74 | 60.6 | 103.14 | 55 |
| Methionine | Thr | M | .1882 | 75 | .70 | 77.1 | 131.191 | 105 |
| Proline | Ser | P | .2513 | 41 | .63 | 60.8 | 97.12 | 32.5 |
| Valine V | Pro | V | .1119 | 43 | .76 | 81 | 99.13 | 84 |
| Phenylalanine | Val | F | .2370 | 91 | .86 | 91.3 | 147.17 | 132 |
| Isoleucine | Leu | I | .1569 | 57 | .90 | 107.5 | 113.16 | 111 |
| Leucine | Ile | L | .1872 | 57 | .90 | 107.5 | 113.16 | 111 |
| Tryptophan | Met | W | .4496 | 130 | .75 | 105.1 | 186.21 | 170 |
| Tyrosine | Phe | Y | .1686 | 107 | .77 | 121.3 | 163.18 | 136 |
| Aspartic acid | Tyr | D | .3924 | 59 | .71 | 123.6 | 115.09 | 54 |
| Lysine | Trp | K | .1739 | 72 | .68 | 144.1 | 128.17 | 119 |
| Asparagine | Asn | N | .2513 | 58 | .62 | 78.0 | 114.10 | 56 |
| Arginine | Glu | R | .0366 | 100 | .66 | 90.4 | 156.19 | 124 |
| Serine | Asp | S | .2815 | 31 | .60 | 74.1 | 87.08 | 32 |
| Glutamic acid | Gln | E | .1819 | 73 | .67 | 93.9 | 129.12 | 83 |
| Glycine | Lys | G | .3229 | 1 | .82 | 108.5 | 57.05 | 3 |
| Histidine | Arg | H | .0201 | 81 | .70 | 111.5 | 137.14 | 96 |
| Glutamine | His | Q | .0366 | 72 | .67 | 99.3 | 128.13 | 85 |
| Threonine | Cys | T | 0 | 45 | – | 72.5 | 101.11 | 61 |
List of values of some Chemical properties of amino acids:
| Amino acid | Abb. | Sym bol | pKa-COOH17 | pKa-NH3 +17 | Hydropathy Index h | Hydrophobicity | Hydrophillicity | Isoelectric Point pI | Polar requirement |
| Alanine | Gly | A | 2.34 | 9.69 | 1.8 | -0.4 | 1.8 | 6.01 | 7.0 |
| Cysteine | Ala | C | 1.71 | 9.69 | 2.5 | 1.8 | -4.5 | 5.07 | 4.8 |
| Methionine | Thr | M | 2.18 | 9.21 | 1.9 | -0.7 | -3.5 | 5.74 | 5.3 |
| Proline | Ser | P | 1.41 | 10.60 | -1.6 | -0.8 | -3.5 | 6.48 | 6.6 |
| Valine V | Pro | V | 2.32 | 9.62 | 4.2 | -1.6 | 2.5 | 5.97 | 5.6 |
| Phenylalanine | Val | F | 1.83 | 9.13 | 2.8 | -4.2 | -3.5 | 5.48 | 5.0 |
| Isoleucine | Leu | I | 2.36 | 9.60 | 4.5 | 3.8 | -3.5 | 6.02 | 4.9 |
| Leucine | Ile | L | 2.36 | 9.60 | 3.8 | 4.5 | -3.5 | 5.98 | 4.9 |
| Tryptophan | Met | W | 2.38 | 9.39 | -0.9 | 1.9 | -0.4 | 5.89 | 5.2 |
| Tyrosine | Phe | Y | 2.20 | 9.11 | -1.3 | 2.8 | 3.2 | 5.66 | 20.5 |
| Aspartic acid | Tyr | D | 2.09 | 9.82 | -3.5 | -1.3 | 4.5 | 2.77 | 13 |
| Lysine | Trp | K | 2.18 | 8.95 | -3.9 | -.09 | 3.9 | 9.74 | 10.1 |
| Asparagine | Asn | N | 2.02 | 8.80 | -3.5 | -3.5 | 1.9 | 5.41 | 10 |
| Arginine | Glu | R | 2.17 | 9.04 | -4.5 | -3.5 | 2.8 | 10.76 | 9.1 |
| Serine | Asp | S | 2.19 | 9.15 | -0.8 | -3.5 | -1.6 | 5.68 | 7.5 |
| Glutamic acid | Gln | E | 2.19 | 9.67 | -3.5 | -3.5 | -0.8 | 3.22 | 12.5 |
| Glycine | Lys | G | 2.34 | 9.60 | -0.4 | -3.9 | -0.7 | 5.97 | 7.9 |
| Histidine | Arg | H | 1.82 | 9.17 | -3.2 | -4.5 | -0.9 | 7.59 | 8.4 |
| Glutamine | His | Q | 2.17 | 9.13 | -3.5 | -3.2 | -1.3 | 5.65 | 8.6 |
| Threonine | Cys | T | 2.63 | 10.43 | -0.7 | 2.5 | 4.2 | 5.87 | 6.6 |
Introduction
We like to consider protein sequence comparison based on physio-chemical properties of amino acids sequentially as follows: First we like to consider protein sequence comparison based on classified groups of amino acids. The main classified groups of amino acids based on physio-chemical properties of amino acids, which have been used so far in protein sequence comparison are mainly the following:
(i) (a) 3 group Classification [1]: Dextrorotatory E, A, I, K, V ; Levorotatory N, C, H, L, M, F, P, S; Irrotational G, Y, R, D, Q (i)(b) 3 group Classification [1]: hydrophobic amino acids H={C, M, F, I, L, V, W, Y}; hydrophilic amino acids P={N, Q, D, E, R, K, H}; and neutral amino acids N={A, G, T, P, S}.
(ii) (a) 4 group Classification [2]: Strongly Hydrophilic (POL) R, D, E, N, Q, K, H; strongly hydrophobic (HPO) L, I, V, A, M, F; Weakly Hydrophilic or weakly Hydrophobic (Ambiguous) Ambi S, T, Y,W; Special (none) C, G, P;
(ii) (b) 4 group Classification [3]: Hydrophobic (H) Non-polar A, I, L, M, F, P, W, V; Negative polar class D, E; Uncharged polar class N , C, Q, G, S, T, Y; Positive polar class R, H, K;
(iii) 5 group Classification [4]: I=C, M, F, I, L, V, W, Y; A=A, T, H; G=G, P; E=D, E; K=S, N, Q, R;
(iv) (a) 6 group Biological Classification based on side chain conditions: Side chain is aliphatic G, A, V, L, I; Side chain is an organic acid D, E, N, Q; Side chain contains a sulphur M, C; Side chain is an alcohol S, T, Y; Side chain is an organic base R, K, H; Side chain is aromatic F, W, P;
(iv) (b) 6 group Theoretical Classification [5]: I=I; L=L,R; A=V A, G, P, T; E=F, C, Y, Q, N, H, E, D, K; M=M,W;S=S.
Use of Classified Groups in Protein Sequence Comparison
Representations based on such classified groups of amino acids of different cardinalities and corresponding methodologies are also tried in several papers [6-8]. Obviously there was a need to develop a unified method of comparison of protein sequences based on classified groups of all cardinalities. Hopefully this is also done in [9].
Next we consider protein sequence comparison based on pair of classified groups of different cardinalities. Such protein sequence comparison based on pair of classified groups of cardinality three is found in [10]. The classifications are given by (i)(a) and (i)(b). Now the classified group (i)(a) of order three based on chilarity property is clear, the same based on hydrophobic and hydrophilic property (i)(b) is doubtful. In fact, if we compare (i)(b) with (ii)(a), it is seen that S, T, Y, W belong to ambiguous class; nothing definite can be said about their positions in POL or HPO. Again it is sure that C does not belong to neither of the classes POL and HPO. But in this paper, C is placed in the HPO class. Also no sufficient reference is given in support of class (i) (b). It is to be changed accordingly. Also the methodology is not sound; it is a mere trial and error policy. It has got to be improved. Proper methodology may be that given in [11] or 2D FFT [12] under ICD method modified accordingly.
Lastly we consider Protein sequence comparison directly based on physio-chemical properties of amino acids. There are several papers based on representations under physio-chemical properties of amino acids. In the article [13], the authors first outline a 2-D graphical representation on a unit circle based on the physicochemical properties of amino acids, mainly the hydrophobicity properties. Anyway this gives the two dimensional coordinates (x, y) on the circle. Next they consider relative weight, a physical property of amino acids. Based on these values they determine the z-coordinates and a 3D representation of amino acids is obtained. This consists of 20 distinct three dimensional points. With the help of tensors of moments of inertia the protein sequences are compared. It may be noted that the 3D representation is a degenerate representation. It is better if the corresponding non-degenerate representation could be made before calculating the descriptors. The paper [14] is based on purely chemical properties of amino acids. The properties are pKa COOH, pKa NH3+. The corresponding pKa values for terminal amino acid groups COOH and NH3 give two complementary properties of amino acids. These are of major importance in Biochemistry, as they may be used to construct protein map, and to determine the activity of enzymes. In the paper [15], two indices of physicochemical properties of 20 amino acids, hydrophobicity value and isoelectric point, are considered for graphical representation of protein sequences. The graphical representation has no degeneracy. The descriptor is calculated based on the ratio between the distance and the cosine of correlation angle of two vectors corresponding to two curves. Similarities/ dissimilarities of 9 different ND5 proteins are obtained and the results are compared with those obtained under ClustalW by using correlation and significance analysis. The present results show improvements. A novel position-feature-based model [16] for protein sequences is developed based on physicochemical properties of 20 amino acids and the measure of graph energy. The physio-chemical properties considered give pI and pKa values of the amino acids. The method obtains a characteristic B-vector. Afterwards, the relative entropy to the sequences representing B-vectors is applied to measure their similarity/dissimilarity. The numerical results obtained in this study show that the proposed methods leads to meaningful results compared with competitors such as Clustal W. Side-chain mass and hydrophobicity of the 20 native amino acids are used in getting the coordinates in the 2D-Cartesian frame [17]. The graphic curve is called the ‘‘2D-MH’’ curve, where ‘‘M’’ stands for the side-chain mass of each of the constituent amino acids, and ‘‘H’’ for its hydrophobic value. The graphic curve thus generated is a one-to-one correspondence relation without circuit or degeneracy. A metric is used for the ‘‘evolutionary distance’’ of a protein from one species to the other. It is anticipated that the presented graphic method may become a useful tool for large scale analysis of protein sequences. A 2-D graphical representation of proteins is outlined based on 2-D map of amino acids [18]. The x and y coordinates are taken as the pKa COOH value and pKa NH3 value respectively. The plot of the difference between the (x, y) coordinates of two graphical representations of proteins gives visual inspection of protein alignment. The approach is explained on segments of a protein of the yeast Saccharomyces cerevisiae. The 2D graphical representation of protein sequences based on six physicochemical properties of 20 amino acids is obtained- the properties are relative molecular weight, volume, surface area, specific volume, pKa (-COOH) and pKa (-NH3)and the relationship between them [19]. Moreover, a specific vector from the graphical curve of a protein sequence could be obtained to calculate the distance between two sequences. This approach avoids considering the differences in length of protein sequences. Finally, using this method the similarities/dissimilarities of ND5 and 36PDs are obtained. The analysis show better results compared with ClustalX2. In the article [20], a new mapping method for protein sequences is developed by considering 12 major physicochemical properties of amino acids – these are (p1: chemical composition of the side chain; p2: polar requirement; p3: hydropathy index; p4: isoelectric point; p5: molecular volume; p6: polarity; p7: aromaticity; p8: aliphaticity; p9: hydrogenation; p10: hydroxythiolation; p11: pK1(–COOH); p12: pK2(-NH3). By applying method of PCA, the percentages of amino acids along the 12 principal axes are obtained. Accordingly a simple 2D representation of the protein sequences is derived. Lastly a 20D vector is obtained for each sequence for its descriptor. The method is first validated with nine ND6 proteins. Next another application is done on the HA genes of influenza A (H1N1) isolates. To validate the proposed method, a comparison of protein sequences is made; this consists of nine ND6 proteins. The similarity/dissimilarity matrix for the nine ND6 proteins correctly reveals their evolutionary relationship. Next, we another application is done for the cluster analysis of HA genes of influenza A (H1N1) isolates. The results are consistent with the known evolution of the H1N1 virus. A 2D graphical representation of protein sequences based on six physicochemical properties of amino acids is outlined [21]. The properties are Mra, pIa, Solubilityb [g/100g, 250C], Specific rotation [α]D25, (5N HCl)c, Hydropathy indexd, Melting pointc (°C). The numerical characterization of protein graphs is given as the descriptor. It is useful for comparative study of proteins and also to encode innate information about the structure of proteins. The coefficient of determination is taken as a new similarity/dissimilarity measure. Finally, the result is tested with the ND6 proteins for eight different species. The results show that the approach is convenient, fast, and efficient. A powerful tool for protein classification is obtained in the form of a protein map [22]. It considers phylogenetic factors arising from amino acid mutations and also it provides computational efficiency for the huge amount of data. Ten different amino acid physico-chemical properties are used for the purpose. These are the chemical composition of the side chain, two polarity measures, hydropathy, isoelectric point, volume, aromaticity, aliphaticity, hydrogenation, and hydroxythiolation. The proposed method gives for protein classification greater evolutionary significance at the amino acid sequence level. A protein sequence is first converted into a 23 dimensional vector by considering three physicochemical properties indexes PI, FH and Hp. Finally, based on the Euclidean distance, the similarities of ND5 proteins of nine species are obtained [23]. Also to check utility of the present method, correlation analysis is provided to compare the present results and the results based on other graphical representation with the Clustal W’s. A novel family of iterated function system (IFS) is introduced using different physicochemical properties of amino acids, which are pK1, h, pK2 and pI [24]. This gives rise to a 2D graphical representation of protein sequences; then a mathematical descriptor is suggested to compare the similarities and dissimilarities of protein sequences from their 2D curves. Similarities/dissimilarities are obtained among sequences of the ND5 proteins of nine different species, as well as sequences of eight ND6 proteins. The phylogenetic tree of the nine ND5 proteins is constructed according to Fuzzy cluster analysis. By correlation analysis, the ClustalW results are compared with the present results and other graphical representation results to demonstrate the effectiveness of this approach. A novel method to analyze the similarity/dissimilarity of protein sequences based on Principal Component Analysis-Fast Fourier Transformation (PCA-FFT) is proposed [25]. The nine different physio-chemical properties of amino acids considered in the analysis are mW, hI, pk1, pK2, pI, S, cN, F(%) and vR. PCA is applied to transform protein sequences into time series and they are finally changed to frequency domain by applying FFT on them. Comparison is done on the frequencies expressed by complex numbers. The similarity/dissimilarity of 16 different ND5 protein sequences and 29 different spike protein sequences, are studied. Furthermore, the correlation analysis is presented for comparing with others methods. It may be noted that while comparing two complex sequences the authors use the sum of the absolute values of the complex numbers. But this is mathematically wrong. There is no ordering in complex numbers. The smaller absolute difference does not imply that the two sequences are nearer. Naturally such a measure fails to contribute anything in phylogeny analysis. This could be avoided by applying ICD (inter coefficient distance) method, which has been used earlier in such situations. So the paper needs modifications. Lastly we mention one paper, where complex representation based on physio-chemical properties of amino acids is used. It may be mentioned that based on two properties Volume and Polarity, a multiple sequence alignment program MAFFT was developed [26]. But no attempt was made for the use of FFT in protein sequence comparison. The complex representation based on the properties of hydrophobicity and residue volume was given [27]. But no protein sequence comparison based on this representation was considered. The complex representation of amino acids based on the properties of hydrophilicity and residue volumes is used [28]. The representation is not the same as the earlier one [27]. In this paper, the represented sequence is transferred to the frequency domain by Fourier transform. But the transformation is something special, as the original sequence under consideration is a complex sequence, not a real one. Anyway ICD method for such a transformation is modified accordingly and with suitable descriptor protein sequence comparison is carried out using Euclidean norm as the distance measure. Interestingly, the protein sequences are compared for both types of representations given in [27,28]. It is found that in the later case, the result is better. It proves that the property of hydrophillicity (polarity) is a better choice than hydrophobicity for protein sequence comparison.
Some Open Problems
a. Can the results of [27,28] be developed avoiding complex representations? Are the conclusions same?
b. Can the results be developed by taking only hydrophobicity and only hydrophillicity properties separately? Does the conclusion remain the same?
c. Is it possible to ascertain bio-logically the minimum number of physio-chemical properties which are most important? If so, methodology is to be developed accordingly using only those properties.
Conclusion
Protein sequence comparison based directly on the physio-chemical properties of amino acids is still an open area of research.
References
- Yu-hua Yao, Fen Kong, Qi Dai, Ping-an He (2013) A Sequence segmented method applied to the similarity analysis of Long Protein Sequence. MATCH Commun Math Comput Chem 70: 431-4502.
- Wang J, Wang W (1999) A computational approach to simplifying the protein folding problem: Nat Struct Biol 6: 1033-1038. [crossref]
- Zu-Guo, Vo Anh, Ka-Sing Lau (2004) Chaos game representation of protein sequences based on the detailed HP model and their multi-fractal and correlation analysis. Journal of Theoretical Biology 226: 341-348. [crossref]
- Chun Li, Lili Xing, Xin Wang (2007) 2-D graphical representation of protein sequences and its application to corona virus phylogeny. BMB Reports 41: 217-222. [crossref]
- Soumen Ghosh, Jayanta Pal, Bhattachara DK (2014) Classification of Amino Acids of a Protein on the basis of Fuzzy set theory-International Journal of Modern Sciences and Engineering Technology (IJMSET) 1: 30-35.
- Chun Li, Lili Xing, Xin Wang (2007) 2-D graphical representation of protein sequences and its application to corona virus phylogeny. BMB Reports 41: 217-222. [crossref]
- Yusen Zhang, Xiangtian Yu (2010) Analysis of Protein Sequence similarity.
- Ghosh Pal SJ, Das S, Bhattacharya DK (2015) Differentiation of Protein Sequence Comparison Based on Biological and Theoretical Classification of Amino Acids in Six Groups. International Journal of Advanced Research in Computer Science and Software Engineering 5: 695-698.
- Soumen Ghosh, Jayanta Pal, Bansibadan Maji, Dilip Kumar Bhattacharya (2018) A sequential development towards a unified approach to protein sequence comparison based on classified groups of amino acids. International Journal of Engineering & Technology 7: 678-681.
- Yu-hua Yao, Fen Kong, Qi Dai, Ping-an He (2013) A Sequence-Segmented Method Applied to the Similarity Analysis of Long Protein Sequence. MATCH Commun Math Comput Chem 70: 431-450.
- Yu-hua Yao, Xu-ying Nan, Tian-ming Wang (2006) A new 2D graphical representation—Classification curve and the analysis of similarity/dissimilarity of DNA sequences. Journal of Molecular Structure: THEOCHEM 764: 101-108.
- Brian R King, Maurice Aburdene, Alex Thompson, Zach Warres (2014) Application of discrete Fourier inter-coefficient difference for assessing genetic sequence similarity. EURASIP Journal on Bioinformatics and Systems Biology 2014: 8. [crossref]
- Wenbing Houa, Qiuhui Panab, Mingfeng He (2016) A new graphical representation of protein sequences and its applications. Physica A 444: 996-1002.
- Jia Wen, Yu Yan Zhang (2009) A 2D graphical representation of protein sequence and its numerical characterization. Chemical Physics Letters 476: 281-286.
- Yuxin Liu, Dan Li, Kebo Lu, Yandong Jiao, Ping-An He (2013) P-H Curve, a Graphical Representation of Protein Sequences for Similarities Analysis. MATCH Commun Math Comput Chem 70: 451-466.
- Lulu Yu, Yusen Zhang, Ivan Gutman, Yongtang Shi & Matthias Dehmer () Protein Sequence Comparison Based on Physicochemical Properties and the Position-Feature Energy Matrix. Sci Rep 7: 46237. [crossref]
- Zhi-Cheng Wu, Xuan Xiao, Kuo-Chen Chou (2010) 2D-MH: A web-server for generating graphic representation of protein sequences based on the physicochemical properties of their constituent amino acids –Journal of Theoretical Biology 267: 29-34.
- Milan Randic (2007) 2-D graphical representation of proteins based on physico-chemical properties of amino acids. Chemical Physics Letters 444: 176-180.
- Dandan Suna, Chunrui Xua, Yusen Zhang (2016) A Novel Method of 2D Graphical Representation for Proteins and Its Application MATCH Commun Math Comput Chem 75: 431-446.
- Zhao-Hui Qi, Meng-Zhe Jin, Su-Li Li, Jun Feng (2015) A protein mapping method based on physicochemical properties and dimension reduction. Computers in Biology and Medicine 57: 1-7. [crossref]
- YU-HUA YAO, DAI QI, LING LI, XU-YING NAN, PING-AN HE, et al. (2009) Similarity/Dissimilarity Studies of Protein Sequences Based on a New 2D Graphical Representation.
- Chenglong Yu, Shiu-Yuen Cheng, Rong L He, Stephen ST Yau (2011) Protein map: An alignment-free sequence comparison method based on various properties of amino acids. Gene 486: 110-118. [crossref]
- Yan-ping Zhang, Ji-shuo Ruan, Ping-an He (2013) Analyzes of the similarities of protein sequences based on the pseudo amino acid composition. Chemical Physics Letters 590: 239-244.
- Tingting Ma, Yuxin Liu, Qi Dai, Yuhua Yao, Ping-an He (2014) A graphical representation of protein based on a novel iterated function system. Physica A 403: 21-28.
- Pengyao Ping, Xianyou Zhu, Lei Wang (2017) Similarities/dissimilarities analysis of protein sequences based on PCA-FFT. Journal of Biological Systems 25: 29-45.
- Katoh K, Misawa K, Kuma K, Miyata T (2002) MAFFT: a novel method for rapid multiple sequence alignment based on fast Fourier transform. Nucleic Acids Res 30: 3059-3066. [crossref]
- Changchuan Yin, Stephen ST Yau (2020) Numerical representation of DNA sequences Based on Genetic Code Context and its applications in Periodicity Analysis Genomes.
- Pal J, Maji B, Bhattacharya DK (2018) Protein sequence comparison under a new complex representation of amino acids based on their physio-chemical properties. International Journal of Engineering & Technology 7: 181-184.