Abstract
Awareness to risks of type II diabetes, the epidemic of the 21st century, is low. We present an investigation into the messages about diabetes which resonate with respondents. The approach uses experimentally designed combinations of messages, unique for each respondent, with the property that the messages appear in a way that prevents the respondent from ‘gaming’ the experiment. Each respondent generates a unique pattern of coefficients for both important of messages, and response time to messages. The study suggests three mind-sets (Focus on the sufferer alone; The doctor is the source of knowledge; Focus on management with the help of others.) We present the PVI, personal viewpoint identifier, allowing the researcher to identify the appropriate convincing message for each respondent, who is first assigned to one of the three mind-sets by the PVI. The Mind Genomics study provides the health community with an easy-to-use system for understanding and deploying convincing messages in health-relevant situations, and may serve as an ongoing, working tool, for health maintenance among the general population.
Introduction
One only needs to open any medical journal to read about the medical issues involved in one or another aspect of diabetes. The popular press, and especially the web, are filled with stories about the issues of diabetes, the newspapers filled with latest information about specific issues involved with diabetes as a looming disaster for society, the magazines filled with stories about personal encounters with diabetes, and to those on the web innumerable advertisements about what to do and what not to do to forestall diabetes. The sheer popularity of diabetes as an issue of discussion is witness to the growing recognition of this developing scourge of society. Type II diabetes has been recognized as a global epidemic of the 21st century [1]. Diabetes is the seventh leading cause of death and disability worldwide [2]. Disability resulting from diabetes has grown substantially between 1990 to 2013 particularly among ages 15–69 years; age-standardized prevalence among adult men doubled from 4.3% to 9% and age-standardized prevalence among adult women increased by 60% from 5% to 8% [3]. People suffering from diabetes are at risk of developing a range of complications endangering their health, functionality and survival. Diabetes has increased across countries [4]. In 2013, 382 million people in 130 countries had diabetes [5]. It is estimated that by 2030 the number of people with Diabetes will rise to 552 million by 2030, and that by 2035 the number of people with diabetes will rise to 592 million (5–7). Despite these concerning data, only a few countries, mostly in Western Europe, seem to have a chance of halting the rise in diabetes by 2030 [4].
Health expenditures associated with diabetes create an economic burden [8]. Epidemiological and economic data for 184 countries suggest that direct global costs accounted for $1.31 trillion, based on WHO’s general health expenditure figures and data from the 2015 [9]. Furthermore, indirect costs of premature mortality and comorbidity due to diabetes accounted for 35% of the total burden with America being the largest contributor to global costs of diabetes [10].
Type II diabetes is caused by factors such as obesity, sedentary lifestyle, diet, smoking, physical and emotional stress which are modifiable [11,12]. Interventions to target modifiable risk factors can prevent or delay the onset of diabetes, but awareness of risks of diabetes is low [10]. The human suffering in diabetes and the economic burden of diabetes on health systems of every country, make diabetes an urgent matter to combat the disease [4].
Education, and especially effective communication, are critical. When people can be effectively educated about the risk and the modifiable factors that can be changed, there is the possibility that the effects of Diabetes can be reduced. One consequence of education is that those individuals who perceive themselves to be at risk of diabetes may be more conscious about what to do, and more likely to follow up on efforts which reduce their risk of developing diabetes [8].
Sadly, little attention was paid to creating effective messages which raise the awareness diabetes risks [1,12]. To be sensitive and effective, messages about risk awareness need proper shaping through framing, narrative impact or visual imagery [11]. These messages should acknowledge the role of individuals in adopting healthy behaviors, and consciously avoid activating negative stereotypes or arousing anger at the message source [13]. Effective messaging will enable health professionals and health policy makers to identify and to use the most effective message for each person in the population by mind-set segments of the sample. How do we understand the mind, and enhance risk awareness effectively?
Formal statistics provide no sense of how people ‘feel’, and to what people ‘react’. Softer yet quantitative methods provide other points of view. Mind-Genomics is an approach best described a ‘cartography of the mind’ which studies responses to different aspects of daily life experience [14–16]. Mind-Genomics maps an experience, identifies its different facets, determines to what facets the person attends, and how important each facet is for each person [14,17–22] By dealing with responses to elements of everyday experience, as they are reacted to by people, Mind-Genomics reveals how people react to the specifics of experience, looking at the nuances, and thus taking into account the richness of experience. Mind-Genomics is an empirical science, mapping aspects of experience by importance, and segmenting different groups of people by their different viewpoints, so-called mind-sets. This Mind-Genomics study identifies effective messaging to raise awareness to risk of diabetes, looking at the general population by the different mind-sets, and what will work (as well as what will fail) for each mind-set.
At the very practical level, in both the medical and non-medical worlds, what does one say to alert the population to the potential problems of diabetes? What does one say to direct people to the proper behaviors, and encourage them, in order to forestall diabetes? And, if one puts the current messaging to the test, do the content of today’s messages strike a resonant chord in the mind of the average consumer? Must we frighten people into a better lifestyle? [23–26].
Finally, as part of this introduction, can we identify different types of people, responding to various messages. We know from the popular press that there is a plethora of choice and the corresponding paradox of choice [27]. In the world of food, for example, we now know both from science and from the marketplace that people have different preferences for products, and will gravitate to what they like, rejecting what they dislike. Prego, for example, is just such a phenomenon, of a product once appearing in one SKU (shop-keeping unit), but now proliferating into more than a dozen, with varieties coming in and out of the market every year. Do we have the same distribution of preferences, not for a physical food product, but rather for a message, such as the type of message to warn us about diabetes?
Method
The approach used is known as Mind Genomics, a form of experimental design in which messages are combined into short, easy-to-read vignettes, such as that shown in Figure 1 for this study. The messages are developed by a Socratic method of choosing a topic, asking four related questions which ‘tell a story,’ providing four answers to each question, and testing combinations of these answers. Mind Genomics, based upon the statistical rigor of experimental design [28] combined with simple testing of combinations by the web, creates a method which is fast, easy, affordable, iterative, and scalable. The objective is to work with small, cost-effective groups of respondents, members of a large on-line panel, and explore different messages in an iterative fashion, to discover what ‘works’, to discover possibly ‘new-to-the-world’ mind-sets, and when possible iterate rapidly across a series of studies to fine tune messages [14,29,30.]
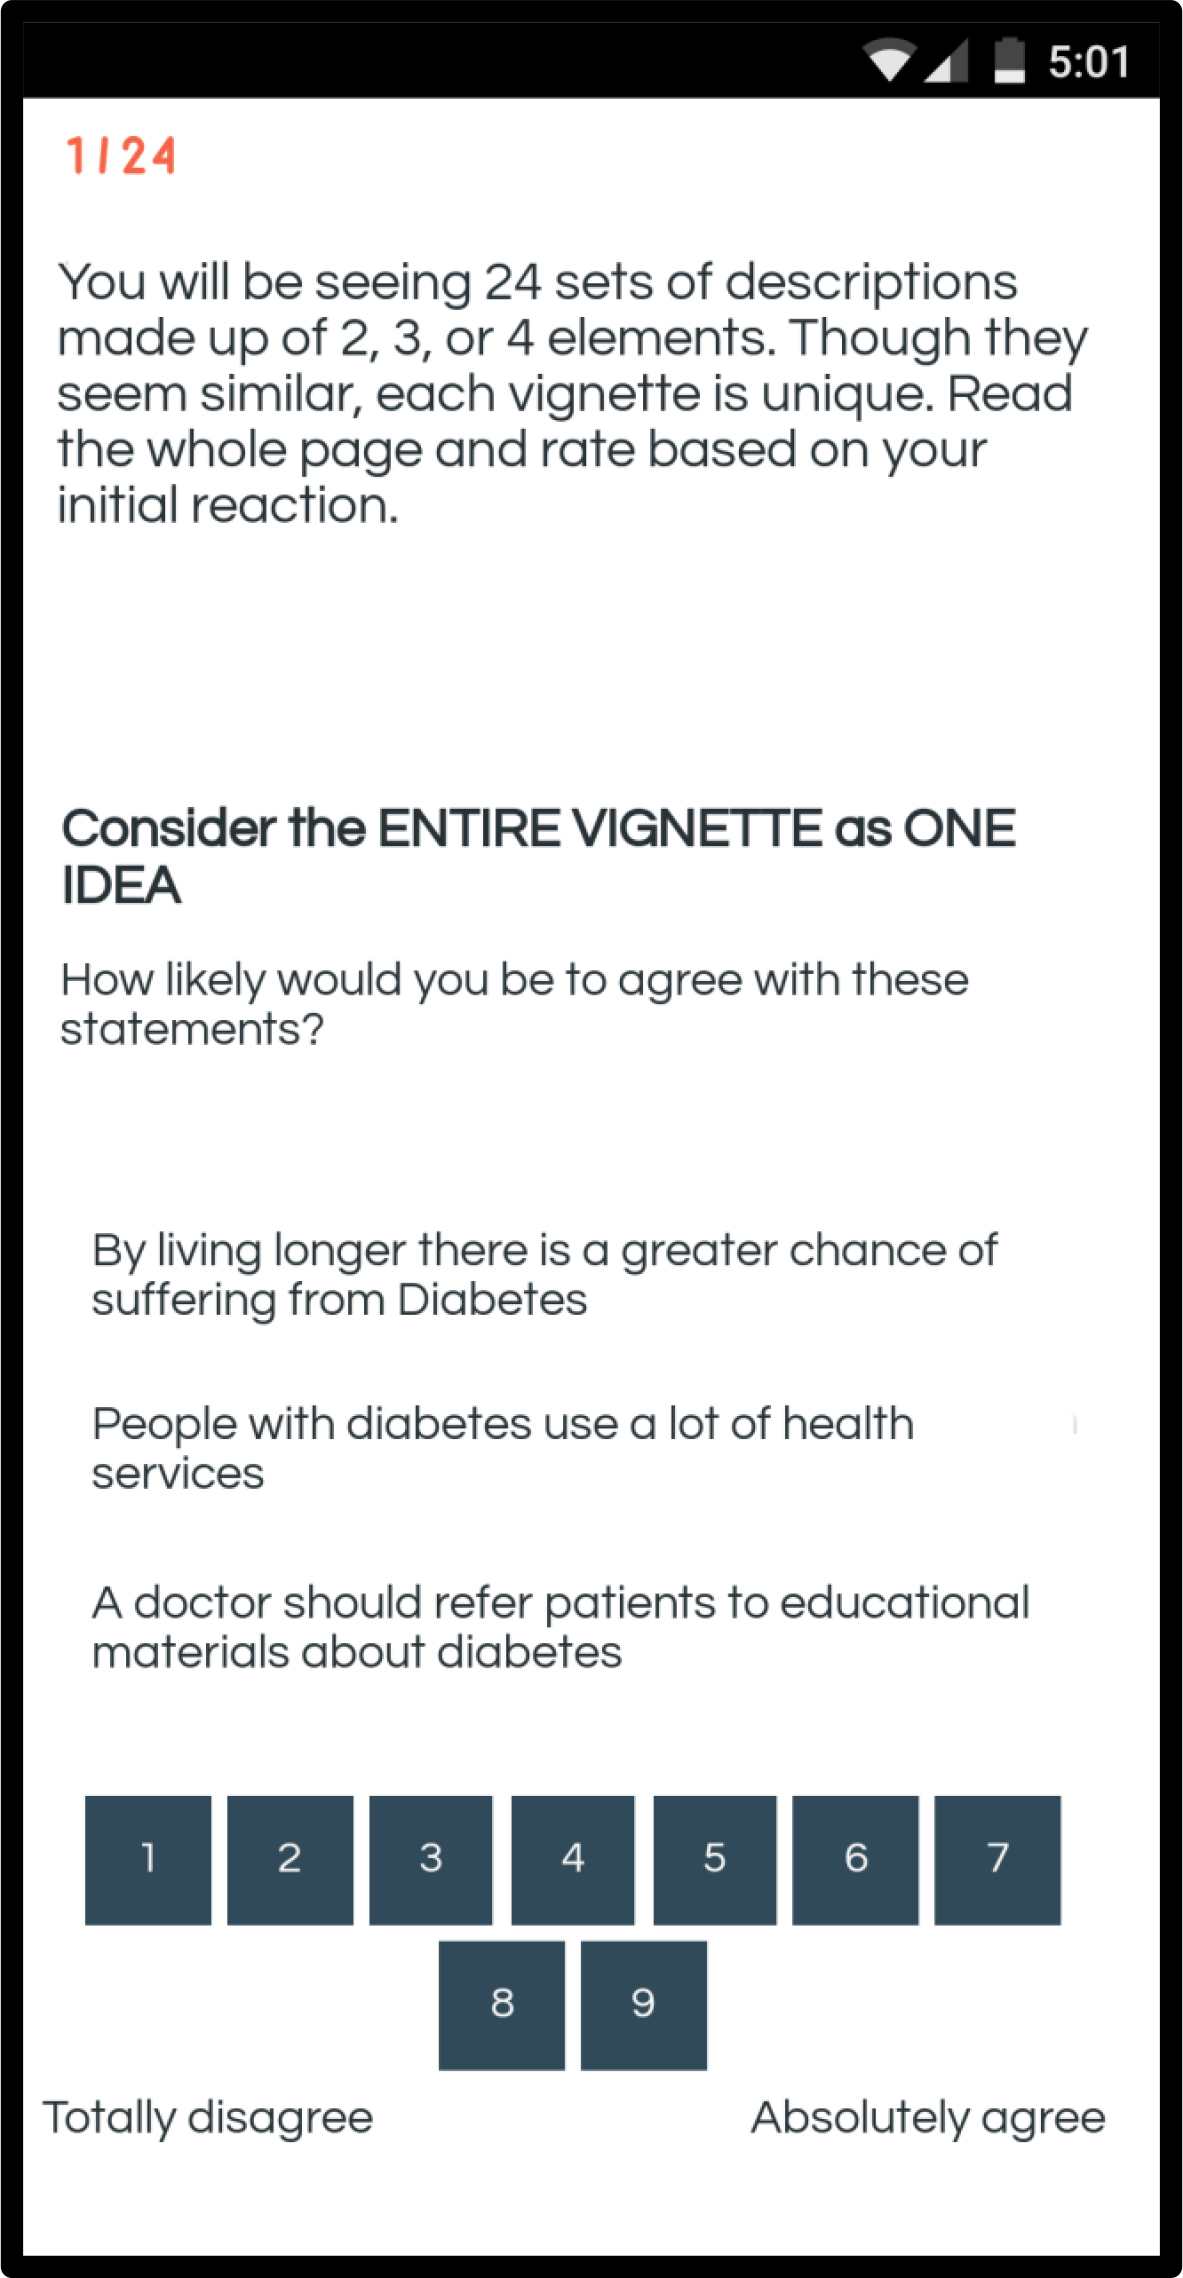
Figure 1. Example of a vignette for the diabetes study
The methods of Mind Genomics enjoy a long history. Psychologists and marketers have known for decades that the everyday experience of people is not easily uncovered by the conventional scientific method of isolate and then study. For some phenomenon, such isolation works very well to help the researcher understand the phenomenon. The everyday experience of people, the world of normal behavior where diabetes is a relevant issue, cannot be easily understood by isolating variables in a clinical way. Rather, it is important to simulate the compound and complex nature of experience, where an individual is presented with many stimuli of different types, all competing for attention. To this end, experimental design of ideas was promoted by pioneer researchers in the world of marketing, Professors Paul Green and Jerry Wind, at the Wharton School of the University of Pennsylvania [31,32] It is their pioneering which has stimulated the research in this paper, albeit the topic has changed from issues in marketing to issues in public health, namely diabetes.
It is important to keep in mind that Mind Genomics studies do not purport to be the ultimate in terms of what works in communication of a topic. Rather, each Mind Genomics study provides a wealth of information in and of itself, as well as a platform both for archiving scientific information, and as a jumping-off point for additional improvement. Mind Genomics thus differs from the conventional A/B tests of communication, now prevalent on the web to ‘optimize’ messaging. Mind Genomics provides structured information, not just a comparison of performance.
The process and the results
We illustrate the approach to diabetes with a small study of 50 respondents, run in March 2019. The objective of the study was to institute a new set of studies on the way to message to the public on topics of increasing importance, yet topics whose criticality has not been sufficiently established in the public’s mind. Diabetes is one of these issues, a disease which promises to become an economic scourge in the years to come. Similar looming problems are opioid use leading to addiction, and eating patterns leading to obesity and illness.
We can best understand the issue of diabetes by following the structured approach imposed by Mind Genomics. The underlying notion is that these studies must be easy to design and implement, must produce fast results, must be very affordable, and must generate a way to implement the key findings (e.g., finding Mind-Sets in the population, responsive to different types of messages.) The power of Mind Genomics lies both in the requirement is imposes for the researcher to ‘think’ in a structured manner, and to return with powerful data that can be acted upon quickly. Mind Genomics is thus a technology of today, the ‘push button age,’ where thinking has become superficial, where solutions are vital, where communication is the driver of change, and where iteration, redoing and correcting, is the evolving way to create products and services [33]
- Identify the problem, create questions, provide answers. Mind Genomics traces some of its intellectual history to the world of Socratic thinking. When exploring a topic, Mind Genomics begins by forcing the researcher to think about four questions that can be related to each, questions which ‘tell a story.’ This step is not as easy as one might surmise. Asking a series of questions which tell a story requires the researcher to conceptualize the problem of just what is the ‘story’ behind diabetes. Table 1 shows a set of four questions, not necessarily the only questions that could be asked. Underneath each question are four answers. The answers are phrased in the language of ordinary people, simple, and at a level promoting ‘fast reading’ and even ‘information grazing’ as will be discussed below. This is so-called System 1 thinking, the fast, intuitive way that we think when we deal with the world of the everyday [34]. As a side note, it should be kept in mind that the respondent never sees the questions. The only material that the respondent will ever see are the answers, to be combined in a systematic way, discussed below.
Table 1. The four questions and the four answers to each question for the diabetes study
Question 1 – What is the risk?
A1
By living longer there is a greater chance of suffering from diabetes
A2
Diabetes is dangerous without treatment
A3
Diet and exercise are key to diabetes prevention
A4
Diabetes is the most profound disease of this century
Question 2 – What are the healthcare needs?
B1
It’s OK to self-manage diabetes
B2
People with diabetes use a lot of health services
B3
Frequent doctor visits help adherence to diabetes treatment
B4
Diabetes requires a lot of medications
Question 3 – What education is expected?
C1
It’s a doctor’s role to educate patients about diabetes
C2
The internet is all you need to learn about diabetes
C3
A doctor should refer patients to educational materials about diabetes
C4
A patient should know all the possible treatments of diabetes
Question 4 – What role does the support of others play?
D1
Family support is important to manage diabetes
D2
Learning how others cope with diabetes is beneficial
D3
Participation in workshops for patients helps manage diabetes
D4
Belonging to a community of patients helps support others with diabetes
- Create the basic experimental design and permute it. The underlying experimental design works with the four sets of four answers (four per question), creating a set of 24 vignettes. Each vignette comprises at most one element from each question. Many vignettes, however, are incomplete, missing either answer from one question (3-element vignette) or an answer from each of two questions (2-element vignette.) Each element appears equally often in the set of 24 vignettes. The underlying experimental design used to construct the vignettes ensures that the 16 elements or answers appear in a statistically independent fashion, allowing the ratings to be ‘deconstructed’ by statistical methods (regression) into the separate contributions of the elements. Finally, each respondent evaluated a unique set of 24 vignettes, but the underlying structure was maintained, so that the mathematical rigor of the design could be used to create valid regression models [35]
Table 2 shows the structure for five vignettes from one respondent, #27, male, age 31, who is defined by age as being in the younger of the two groups, and who classifies himself as being moderately concerned about diabetes. This will be the only private information needed for the respondent, and indeed even this information about WHO the respondent IS, or WHAT the respondent THINKS will not be necessary for the analysis.
Table 2. Five vignettes from the experimental design for one respondent. The table shows the information about the respondent, the structure of the five vignettes, the binary expansion of the 16 elements, the ratings, response time, and binary-transformed ratings
Vig#1
Vig#2
Vig#3
Vig#4
Vig#5
Respondent #27; Male, Age 31, Younger group, Moderately concerned about diabetes
Design
Question A:
Answer A4
Absent
Answer A4
Answer A2
Answer A2
Question B:
Absent
Answer B2
Answer B2
Answer B1
Answer B4
Question C:
Answer C2
Answer C1
Answer C1
Absent
Answer C4
Question D:
Answer D4
Answer D1
Answer D2
Answer D1
Answer D4
Binary Expansion of Design
A1
0
0
0
0
0
A2
0
0
0
1
1
A3
0
0
0
0
0
A4
1
0
1
0
0
B1
0
0
0
1
0
B2
0
1
1
0
0
B3
0
0
0
0
0
B4
0
0
0
0
1
C1
0
1
1
0
0
C2
1
0
0
0
0
C3
0
0
0
0
0
C4
0
0
0
0
1
D1
0
1
0
1
0
D2
0
0
1
0
0
D3
0
0
0
0
0
D4
1
0
0
0
1
Dependent variables
Rating on 9-point scale
4
7
6
5
3
Response Time (Sec)
5.3
2.9
4.6
5.5
4.8
Binary transformed rating
Top3
0
100
0
0
0
Bot3
0
0
0
0
100
Below the experimental design, described in words, is the same set of 16 elements, this time representing the elements as 16 variables, each variable taking on the value ‘0’ when the element is absent from the vignette, and taking on the value ‘1’ when the element is present in the vignette. The element is coded 0/1 because the analysis will tell us how much the element contributes to the response. This form of coding is known as ‘dummy variable’ because the element, i.e., the answer, does not carry any intrinsic numerical information that we want to use as a predictor. It is simply the element itself, without the ‘meaning of the element.’ Later, after the analysis, we will look for meaning.
Beneath the binary variables are two sets of two dependent variables each. The first dependent variable is the rating of the vignette on the anchored 9-point scale. The second dependent variable is the response time to the vignette in seconds. The third dependent variable is the transformed rating ‘Top3,’ with ratings of 1–6 transformed to 0 and ratings of 7–9 transformed to 100. This is the so-called Top 3 Box, and shows the response transformed to study how the messages drive ‘important.’ The fourth dependent variable is ‘Bot 3’ with ratings 1–3 transformed to 100, and ratings of 4–9 transformed to 0. This is the so-called Bottom 3 Box, and shows the response transformed to study how the messages drive ‘irrelevant’ (or extremely unimportant.)
- Execute the study. We worked with a panel provider, Luci.id. The respondents were part of the Luc.id panel of several millions of respondents. Respondents were recruited to participateand compensated by the sample provider. Working with a sample provider specializing in these types of studies creates the possibility that the study can be executed and analyzed (at a superficial level) in a period of one-two days.
The respondents who agree to participate were told to click on a link embedded in their email. The first screen required the respondents to profile themselves (age, gender, concern with diabetes.) The second screen introduced the study. The third screen (Figure 1) presented the first of the 24 systematically created vignettes. The entire process took approximately four minutes. Figure 1 shows an example of the vignette:
- Run the regression model for the total panel: Relate the presence/absence of the 16 elements to the ratings (important = Top3; irrelevant = Bot3) using OLS (ordinary least-squares) regression. OLS provides an easy way to deconstruct the response to the vignettes into the contributions of the elements, and a predisposition (additive constant). Table 3A presents the parameters of the OLS regression run twice, first when the dependent variable was defined as Top3 (Ratings 1–6 → 0, Ratings 7–9 → 100) and Bot3 (Ratings 1–3 → 100, Ratings 4–9 → 0). The two transformations give a sense of what is really important and what is really irrelevant. Not important may or may be irrelevant. Similarly, not irrelevant may or may not be important.
Table 3A. Parameters of the regression models for Top3 (important) and Bot3 (irrelevant). Data from the total panel
Top3 – Important
Bot3 – Irrelevant
Coeff
T-Stat
P-Val
Coeff
T-Stat
P-Val
Additive constant
58.80
7.70
0.00
5.74
1.38
0.17
A3
Diet and exercise are key to diabetes prevention
8.16
1.75
0.08
-4.57
-1.80
0.07
A2
Diabetes is dangerous without treatment
6.86
1.48
0.14
-3.28
-1.29
0.20
D1
Family support is important to manage diabetes
5.25
1.13
0.26
-2.88
-1.13
0.26
B3
Frequent doctor visits help adherence to diabetes treatment
3.96
0.85
0.40
0.37
0.15
0.88
D2
Learning how others cope with diabetes is beneficial
2.55
0.55
0.58
-2.99
-1.19
0.23
D3
Participation in workshops for patients helps manage diabetes
2.43
0.53
0.60
-4.77
-1.89
0.06
D4
Belonging to a community of patients helps support others with diabetes
0.87
0.19
0.85
-2.91
-1.15
0.25
C4
A patient should know all the possible treatments of diabetes
0.17
0.04
0.97
-0.66
-0.26
0.80
B2
People with diabetes use a lot of health services
-2.62
-0.56
0.57
2.37
0.93
0.35
A4
Diabetes is the most profound disease of this century
-2.93
-0.63
0.53
1.28
0.51
0.61
C3
A doctor should refer patients to educational materials about diabetes
-2.94
-0.63
0.53
3.30
1.29
0.20
C1
It’s a doctor’s role to educate patients about diabetes
-4.13
-0.88
0.38
0.90
0.35
0.73
B4
Diabetes requires a lot of medications
-4.83
-1.03
0.30
2.86
1.12
0.26
A1
By living longer there is a greater chance of suffering from Diabetes
-9.33
-2.00
0.05
1.11
0.44
0.66
B1
It’s OK to self-manage diabetes
-17.27
-3.65
0.00
9.01
3.49
0.00
C2
The internet is all you need to learn about diabetes
-25.63
-5.53
0.00
10.90
4.31
0.00
- Table 3A show three parameters from the OLS regression. The first is the coefficient, which is the probability that the vignette will receive a rating of 7–9 when the element is in the vignette (Top3) or that the vignette will receive a rating of 1–3 when the element is in the vignette (Bot 3).
- The second parameter is the T-statistic, a measure of signal to noise. The idea T value is as high as possible. The T statistic shows the magnitude of the coefficient divided by the expected variation of the coefficient. The higher the T statistic, the more likely it is that we are seeing a ‘real signal,’ and not just random fluctuation.
- The third parameter is the P-Value, the probability that the coefficient is really 0, and what we are seeing is some random deviation, but with a real value of 0. The P value is inversely to the absolutely magnitude of the T statistic, which makes sense. The higher the signal/noise ratio, the more likely we have a real signal, and the lower is the P value. P is simple the probability that are seeing the results of random fluctuation.
The analysis is based on the fitted linear equation: Response = k0 + k1(A1) + k2(A2) … k16(D4)
- The additive constant indicates the probability that the rating will be assigned either a 7–9 in the absence of elements (Important; Top3) or a 1–3 in the absence of elements (Irrelevant: Bot3). Table 3A shows quite clearly that the respondents take the messaging seriously. The additive constant is 58.80, meaning that in the absence of elements (a purely hypothetical situation), we should expect 58.8, i.e., almost 60% of the responses to be ‘important.’ In contrast, the additive constant for Bot3 (irrelevant) is 5.74, meaning that only 6% of the responses are expected to be ‘irrelevant.’ The respondents treat the information as serious
- The most important elements are A3 (Diet and exercise are key to diabetes prevention) and A2 (Diabetes is dangerous without treatment.) These are the phrases to which people react most strongly.
- The most irrelevant elements are B1 (It’s OK to self-manage diabetes) and C2 (The internet is all you need to learn about diabetes).
- Run the regression model for key self-defined subgroups: For the total panel, it comes as a surprise that only two elements are deemed to be very important for the total panel (A3, A2), and only two elements are deemed to very irrelevant for the total panel (B1,C2). The remaining elements are generally modest in their importance. Such poor performance may stem either from the possible reality that today’s messages are simply not strongly relevant, or perhaps that there exist groups in the population responding to different messages. The results from the total panel do not show these groups. They must either identify themselves directly or be uncovered through statistical means.
The Mind Genomics experiment required the respondent to provide information about gender and age, respectively, as well as about degree of concern with diabetes. The ages were divided into three ranges, following a hypothesis that there are certain general stages in a person’s life
Table 3B presents the coefficients for the Top3 model (importance) by total, gender, age, all self-defined groups, and by two groups of mind-sets, those extracted from two segments, and those extracted from three segments, respectively. The strong performing elements are shown as shaded cells with told numbers. The definition of a strong performing element is a coefficient of +7.51 or higher, rounded to a +8
Table 3B. Performance of all elements by self-defined subgroups and emergent mind-sets
|
Coefficients from equations relating the presence/absence of the elements to the rating of important (Top3) |
Total |
Male |
Female |
Age 13–34 |
Age 35–54 |
Age 55+ |
Mind-Set 2A – Focus on management with the help of others |
Mind-Set 2B – Focus on the sufferer alone |
Mind-Set 3C – Focus on the sufferer alone |
Mind-Set 3D– The doctor is the source of knowledge |
Mind-Set 3E – Focus on management with the help of others |
|
|
Base size |
50 |
25 |
25 |
25 |
12 |
12 |
28 |
22 |
18 |
13 |
19 |
|
|
Additive constant |
59 |
73 |
44 |
61 |
62 |
48 |
66 |
53 |
62 |
43 |
67 |
|
|
A1 |
By living longer there is a greater chance of suffering from Diabetes |
-9 |
-11 |
-6 |
-11 |
-2 |
-10 |
-9 |
-10 |
1 |
-5 |
-20 |
|
A2 |
Diabetes is dangerous without treatment |
7 |
8 |
7 |
3 |
12 |
12 |
4 |
9 |
14 |
8 |
-1 |
|
A3 |
Diet and exercise are key to diabetes prevention |
8 |
8 |
10 |
2 |
18 |
14 |
10 |
6 |
17 |
4 |
3 |
|
A4 |
Diabetes is the most profound disease of this century |
-3 |
-5 |
1 |
-8 |
-1 |
6 |
-6 |
0 |
4 |
0 |
-10 |
|
B1 |
It’s OK to self- manage the Diabetes |
-17 |
-15 |
-18 |
-14 |
-5 |
-33 |
-11 |
-26 |
-14 |
-27 |
-13 |
|
B2 |
People with diabetes use a lot of health services |
-3 |
-5 |
0 |
-1 |
0 |
-9 |
-2 |
-8 |
-4 |
-13 |
2 |
|
B3 |
Frequent doctor visits help adherence to diabetes treatment |
4 |
2 |
7 |
4 |
0 |
7 |
8 |
-4 |
4 |
-8 |
11 |
|
B4 |
Diabetes requires a lot of medications |
-5 |
-5 |
-3 |
-6 |
0 |
-4 |
-2 |
-12 |
5 |
-22 |
-4 |
|
C1 |
It’s a doctor’s role to educate patients about diabetes |
-4 |
-6 |
-2 |
-8 |
-6 |
3 |
-14 |
7 |
-13 |
16 |
-9 |
|
C2 |
The internet is all you need to learn about diabetes |
-26 |
-30 |
-22 |
-27 |
-20 |
-32 |
-38 |
-13 |
-24 |
-4 |
-42 |
|
C3 |
A doctor should refer patients to educational materials about diabetes |
-3 |
-11 |
5 |
-8 |
-2 |
4 |
-12 |
7 |
-13 |
20 |
-11 |
|
C4 |
A patient should know all the possible treatments of diabetes |
0 |
-3 |
3 |
1 |
1 |
-1 |
-10 |
10 |
-3 |
12 |
-7 |
|
D1 |
Family support is important to manage diabetes |
5 |
-1 |
11 |
2 |
7 |
14 |
11 |
-1 |
0 |
0 |
16 |
|
D2 |
Learning how others cope with diabetes is beneficial |
3 |
1 |
3 |
-2 |
7 |
12 |
3 |
2 |
-5 |
4 |
8 |
|
D3 |
Participation in workshops for patients helps manage diabetes |
2 |
-3 |
7 |
3 |
6 |
2 |
16 |
-12 |
-12 |
-2 |
19 |
|
D4 |
Belonging to a community of patients helps support others with diabetes |
1 |
-2 |
3 |
-2 |
14 |
-1 |
7 |
-6 |
-10 |
-3 |
15 |
In a relatively large data set of the type we have, comprising 1200 responses from 50 respondents and 16 elements in the basic set of messages, with a variety of groups, it is natural for a variety of elements to score well, even by chance. The key to the data is whether we see interpretable patterns. With that caveat, we look now at the groups.
Gender
Males are more likely to rate the basic vignette as important, even without the message. The additive constant is 73 for males, and a much lower 44 for females.
Both genders believe in diet and exercise. Men feel that treatment is important (problem/solution), whereas women feel that social support from family is important.
Age
The younger respondents have a higher base level of belief that the vignette is important, even without the elements (additive constant =61 and 62), whereas the older respondents feel that its more likely the messages (additive constant = 48)
The youngest respondents (age 13–34) don’t feel that any message stands out
Both older groups recognize the important diet and exercise, and the need for treatment. In contrast, the youngest group does not agree. This is the group that needs the messaging.
Both older age groups recognize the importance of community support.
Beyond WHO to HOW THEY REACT TO SPECIFICS – Emergent Mind-Sets discovered with Mind Genomics
During the past sixty years or so marketers have recognized that people differ from each other in the way they look at the world, especially the everyday world. Of course, inter-individual variation is not new. The old proverb ‘of taste there is no dispute’ recognizes that people differ in what they like and what they do not like. The issue facing science is to understand the nature of these inter-individual differences. The reductionist might wish to ascribe these differences to biological variations in composition, and indeed three quarters of a century ago, Dr William Sheldon discussed the personalities of people based on body type (ectomorph, mesomorph, endomorph). Author Moskowitz studied with one of Sheldon’s associates, S. S. Stevens at Harvard University in the 1960’s, had met Sheldon, and had many discussions with Stevens on the influence of body type as it affects behavior and thinking.
In some way, Mind Genomics emerged thirty years later from those initial discussions, not so much talking about the nature of the body type influencing behavior, but rather on the need to ‘reverse the discussion’ and discuss the how people differed in the specifics of their thinking, and perhaps from understanding these specifics, find a correlated physiological explanation. In other words, work in the opposite way, from the granular, the way of thinking about the specific topics, to the general.
The Mind Genomics exercise, as shown here, reveals that that response to different messages about diabetes does not reveal any massively strong messages. Dividing people by gender by age, and so forth, does not seem to produce the very large differences suggested either by pioneer market researcher [36] in his work on psychographic segmentation, nor the differences that might be expected from dividing people by body types.
Mind Genomics extends the nature of dividing people, working at the level of the very specific, looking at the patterns of coefficients for a set of respondents, for a single study, such as the study reported here on diabetes. The underlying principle is that, without theory, one can use the statistical powerhouse of clustering to divide a group of objects, here people, into complementary, i.e., non-overlapping groups. The division is based on strictly mathematical criteria and is agnostic to the meaning of the emergent groups. It is the task of the researcher to decide how many such groups (mind-sets, clusters) should be extracted [37] Parsimony is best, i.e., the fewer the number of such mind-sets, the better is the solution. Interpretability is a must; the mind-sets must ‘make intuitive sense’ and not seem to be forced combinations of divergent elements.
The specific method for creating these mind-sets comes from clustering. The objective is to divide the objects, here people, based upon the mathematical criteria underlying the specific clustering algorithm. In this study of diabetes, the clustering is based upon separating respondents into groups so that the ‘distances’ between the respondents within a group is low, and the distances between the centroids or averages of the groups on the 16 elements is high. The ‘distance between two people’ is operationally defined as the quantity (1-Pearson Correlation Coefficient.) The Pearson Correlation Coefficients shows the degree of linear relation between two variables, her the linear relation between two people, base upon their 16 coefficients. (The additive constant is not considered.) The Pearson Correlation Coefficient, R,] ranges from a high of 1 for two people perfectly related to each other (distance = 1–1 = 0), to a low of -1 for two people perfectly inversely related to each other (distance = 1 – – 1 = 2).
How many mind-sets? The conflict between parsimony and explainability
The clustering procedure as described above is a mathematical exercise, which operates by strictly formal means, in turn agnostic to the meaning of the clusters extracted. In actuality, the entire effort of clustering is to impose an interpretable order on what might otherwise be a cloud of different points. The clusters which emerge are simply way to understand this cloud of different points. Indeed, as SS Stevens, professor of Psychophysics at Harvard University would tell author HRM, ‘the hardest thing in science is to divide what is essentially a continuum into discrete points’ [38]
Mindful of the nature of clustering, to satisfy the mutually antagonistic objectives of parsimony (fewer are better) and interpretability (more let the story be simpler to emerge), we look at the results for two mind-sets (Mind-Set 2A vs Mind-Set 2B), and then the results for three mind-sets (Mind-Sets 3C, vs 3D vs 3E.) Table 4 shows the strongest performing elements for each of the complementary mind-sets. As Table 4 shows, increasing the number of segments to generate more mind-sets allows a finer set of gradations to emerge. For example, in the two-segment solution the ‘story’ is about the help of others versus the patient alone. When the two-segment solution is expanded to three segments, i.e., a new Mind-Set is permitted, the focus on the Doctor as the Expert emerges, a focus that could not emerge with the two-segment solution.
Table 4. Strongest messages emerging from the two versus three segment solution
|
Two-Segment Solution |
||
|
Mind-Set 2A – Focus on management with the help of others |
||
|
D3 |
Participation in workshops for patients helps manage diabetes |
16 |
|
D1 |
Family support is important to manage diabetes |
11 |
|
A3 |
Diet and exercise are key to diabetes prevention |
10 |
|
B3 |
Frequent doctor visits help adherence to diabetes treatment |
8 |
|
Mind-Set 2B– Focus on the sufferer alone |
||
|
C4 |
A patient should know all the possible treatments of diabetes |
10 |
|
A2 |
Diabetes is dangerous without treatment |
9 |
|
Three Segment Solution |
||
|
Mind-Set 3C – Focus on the sufferer alone |
||
|
A3 |
Diet and exercise are key to diabetes prevention |
17 |
|
A2 |
Diabetes is dangerous without treatment |
14 |
|
Mind-Set 3E – The doctor is the source of knowledge |
||
|
C3 |
A doctor should refer patients to educational materials about diabetes |
20 |
|
C1 |
It’s a doctor’s role to educate patients about diabetes |
16 |
|
C4 |
A patient should know all the possible treatments of diabetes |
12 |
|
A2 |
Diabetes is dangerous without treatment |
8 |
|
Mind-Set 3E – Focus on management with the help of others |
||
|
D3 |
Participation in workshops for patients helps manage diabetes |
19 |
|
D1 |
Family support is important to manage diabetes |
16 |
|
D4 |
Belonging to a community of patients helps support others with diabetes |
15 |
|
B3 |
Frequent doctor visits help adherence to diabetes treatment |
11 |
|
D2 |
Learning how others cope with diabetes is beneficial |
8 |
Beyond interest to ‘engagement’ – the value of response time as a measure
Experimental psychologists have sought physiological correlates of attention and psychological processes, doing so for more than a century. One of the earliest of these measures is the so-called ‘reaction time’ [39], presumed to reflect the amalgam of psychological forces interacting with each to drive a behavior. The response time itself is simply a measure but becomes of interest when it can be linked to antecedent stimuli.
In the Mind Genomics experiment, the computer system measured the response time between the appearance of the vignette on the screen and the rating assigned by the respondent. The reaction times to the different vignettes vary, but like the ratings, it’s the deconstruction of the response times into the different contributions from the 16 elements which are of interest. Again, the benefit of experimental design is that we know the exact contribution of each element.
The deconstruction uses the method of OLS regression, this time without the additive constant. The rationale for abandoning the additive constant is that in the absence of elements the response time to the vignette should be 0 seconds.
Table 5 shows the estimated response times to the different elements, by total panel, gender, and then the two mind-sets and the three mind-sets, respectively. To make the table easier to read, we have shaded all response times of 1.8 seconds or longer. This value of 1.8 is simply a convenient cut-point. Furthermore, the response time does not equal agreement
Table 5. Estimated response times in seconds to individual elements
|
Total |
Male |
Female |
Age13–34 |
Age 35–54 |
Age 55+ |
Mind-Set2A |
Mind-Set2B |
Mind-Set3C |
Mind-Set3D |
Mind-Set3E |
||
|
A4 |
Diabetes is the most profound disease of this century |
1.9 |
1.7 |
2.0 |
1.8 |
1.4 |
2.4 |
1.6 |
2.2 |
2.0 |
1.7 |
1.9 |
|
A1 |
By living longer there is a greater chance of suffering from Diabetes |
1.7 |
1.6 |
1.8 |
1.3 |
1.8 |
2.4 |
1.6 |
1.8 |
1.6 |
1.5 |
1.9 |
|
A2 |
Diabetes is dangerous without treatment |
1.7 |
1.8 |
1.6 |
1.7 |
1.2 |
2.1 |
1.8 |
1.6 |
2.3 |
1.0 |
1.6 |
|
A3 |
Diet and exercise are key to diabetes prevention |
1.7 |
1.7 |
1.7 |
1.6 |
1.3 |
2.2 |
1.6 |
1.7 |
2.0 |
1.2 |
1.7 |
|
C2 |
The internet is all you need to learn about diabetes |
1.6 |
2.0 |
1.3 |
1.5 |
1.9 |
1.6 |
1.7 |
1.5 |
1.6 |
1.6 |
1.6 |
|
B2 |
People with diabetes use a lot of health services |
1.6 |
1.6 |
1.6 |
1.3 |
1.7 |
2.0 |
1.4 |
1.8 |
2.0 |
1.5 |
1.2 |
|
C3 |
A doctor should refer patients to educational materials about diabetes |
1.6 |
1.6 |
1.5 |
1.2 |
1.8 |
2.0 |
1.7 |
1.4 |
1.6 |
1.2 |
1.8 |
|
D4 |
Belonging to a community of patients helps support others with diabetes |
1.6 |
1.7 |
1.4 |
1.0 |
2.3 |
1.9 |
1.4 |
1.8 |
1.7 |
1.6 |
1.4 |
|
B3 |
Frequent doctor visits help adherence to diabetes treatment |
1.5 |
1.4 |
1.7 |
1.2 |
1.7 |
2.1 |
1.4 |
1.6 |
1.4 |
2.0 |
1.3 |
|
C1 |
It’s a doctor’s role to educate patients about diabetes |
1.5 |
1.6 |
1.4 |
1.1 |
1.9 |
1.8 |
1.5 |
1.6 |
1.6 |
1.6 |
1.5 |
|
D2 |
Learning how others cope with diabetes is beneficial |
1.5 |
1.5 |
1.5 |
1.4 |
1.8 |
1.4 |
1.7 |
1.4 |
1.6 |
1.3 |
1.6 |
|
B4 |
Diabetes requires a lot of medications |
1.5 |
1.6 |
1.4 |
1.1 |
1.5 |
2.0 |
1.5 |
1.4 |
1.1 |
1.9 |
1.5 |
|
D1 |
Family support is important to manage diabetes |
1.5 |
1.7 |
1.3 |
0.9 |
1.9 |
2.1 |
1.5 |
1.4 |
1.2 |
1.4 |
1.8 |
|
D3 |
Participation in workshops for patients helps manage diabetes |
1.4 |
1.3 |
1.5 |
1.2 |
1.5 |
1.5 |
1.2 |
1.6 |
1.1 |
1.4 |
1.7 |
|
C4 |
A patient should know all the possible treatments of diabetes |
1.4 |
1.6 |
1.1 |
1.1 |
1.6 |
1.6 |
1.3 |
1.4 |
1.4 |
1.3 |
1.3 |
|
B1 |
It’s OK to self-manage the Diabetes |
1.3 |
1.5 |
1.0 |
0.8 |
1.4 |
1.8 |
1.0 |
1.5 |
1.3 |
1.8 |
0.8 |
Table 5 suggests that when we look at the elements which occupy a respondent’s attention, take longer to read, the elements are information, rather than exhortative. That is, the respondents pay attention to phrases which relevant information. Each of the three phrases below provides information that can be used to make decisions.
Diabetes is the most profound disease of this century
By living longer there is a greater chance of suffering from Diabetes
Diabetes is dangerous without treatment
Finding Mind-Sets in the population through the PVI (personal viewpoint identifier)
Diabetes poses a general risk to people and to the economy world-wide. Communications which fail to recognize the existence and nature of the different mind-sets involved in diabetes are likely to be less than optimal. Indeed, as Table 3B shows quite clearly, when we look at newly revealed Mind-Sets in the population, we see that some messages are simply irrelevant, whereas others seem irrelevant on average, but are quite polarizing, striking a strong chord among one mind-set and turning off the other mind-sets. Finding the compelling messages is critical for all cultures, and all economic groups [40,41,42,43]
The differences between and among mind-sets can either be ignored at the peril of choosing irrelevant or negatively messages on the one hand or choosing the most effective message for each person on the other. The latter is clearly preferable, namely choose the correct message. The question is ‘How?’ A facile answer is ‘Big Data’ and the well-worn but meaningless statement ‘the answer has to got to be in there, somehow.’ The reality is that the answer is probably not easy to find in Big Databut may be easy to find using a slightly different approach, the data emerging from the Mind Genomics experiment.
A sense of the frustration with using conventional data analytics can be obtained from Table 6, which shows the number of respondents in the set of 50, belonging to each of the three mind-sets, versus the self-defined classification of age (WHO) and stated concern with diabetes (PSYCHOGRAPHIC.) There is no pattern, and indeed in most Mind Genomics studies evidencing clear mind-sets, the covariation of these mind-sets with traditional, easy-to-find groups in the population has been disappointing at best. The reason is simple. ‘Birds of a feather DO NOT THINK ALIKE.’ Quite simply, just because two people resemble each other on criteria easy to measure does not mean that they share the same world-view, and more important, does not mean that they share the same mind-set for a specific issue, such as diabetes.
Table 6. Distribution of the 50 respondents by mind-set (column) versus age (row) and versus concern with diabetes (row)
|
|
MindSet1 |
MindSet2 |
MindSet3 Focus on management with the help of others |
Total |
|
Total |
18 |
13 |
19 |
50 |
|
Demographic – Age |
||||
|
Younger |
9 |
6 |
10 |
25 |
|
Middle |
7 |
1 |
4 |
12 |
|
Older |
2 |
5 |
5 |
12 |
|
No Answer |
1 |
|||
|
Psychographic – Concern with diabetes |
||||
|
I have diabetes |
1 |
1 |
3 |
5 |
|
I worry about becoming diabetic |
4 |
1 |
0 |
5 |
|
I am at risk for diabetes |
3 |
0 |
2 |
5 |
|
Diabetes is never on my mind |
3 |
1 |
1 |
5 |
|
Not applicable |
7 |
10 |
13 |
30 |
We already know the coefficients for the same elements, but from different mind-sets. The task is to identify those elements which best differentiate between two or among three mind-sets and create a scoring system. The new respondent, whose mind-set is to be determined, is presented with the set of elements, in the form of six no/yes questions, creating 64 combinations. The pattern of the combinations determines the most likely mind-set to which the respondent will be assigned. The task is simple. The results are not perfect, of course, but give the opportunity for a quick assignment of a person to the most likely mind-set. In addition, the PVI is based solely on the data from the study which uncovered the mind-sets in the first place, and thus the PVI does not need to intervening variables or hypothetical constructs.
Figure 2 shows the six question PVI. Figure 3 shows the set of answers, feedback, either for the person being typed, or for the health professional who is counseling or treating the patient. The power of the PVI is its ability to personalize the message, and thus generate potentially greater compliance or behavior change. The PVI addresses the sensibilities of the individual rather being a random shot of information, determined for the population at large, and which through the process of attenuation by having to appeal to different factions, ends up modestly appealing to many people, and thus for the most part, bland and ineffective.
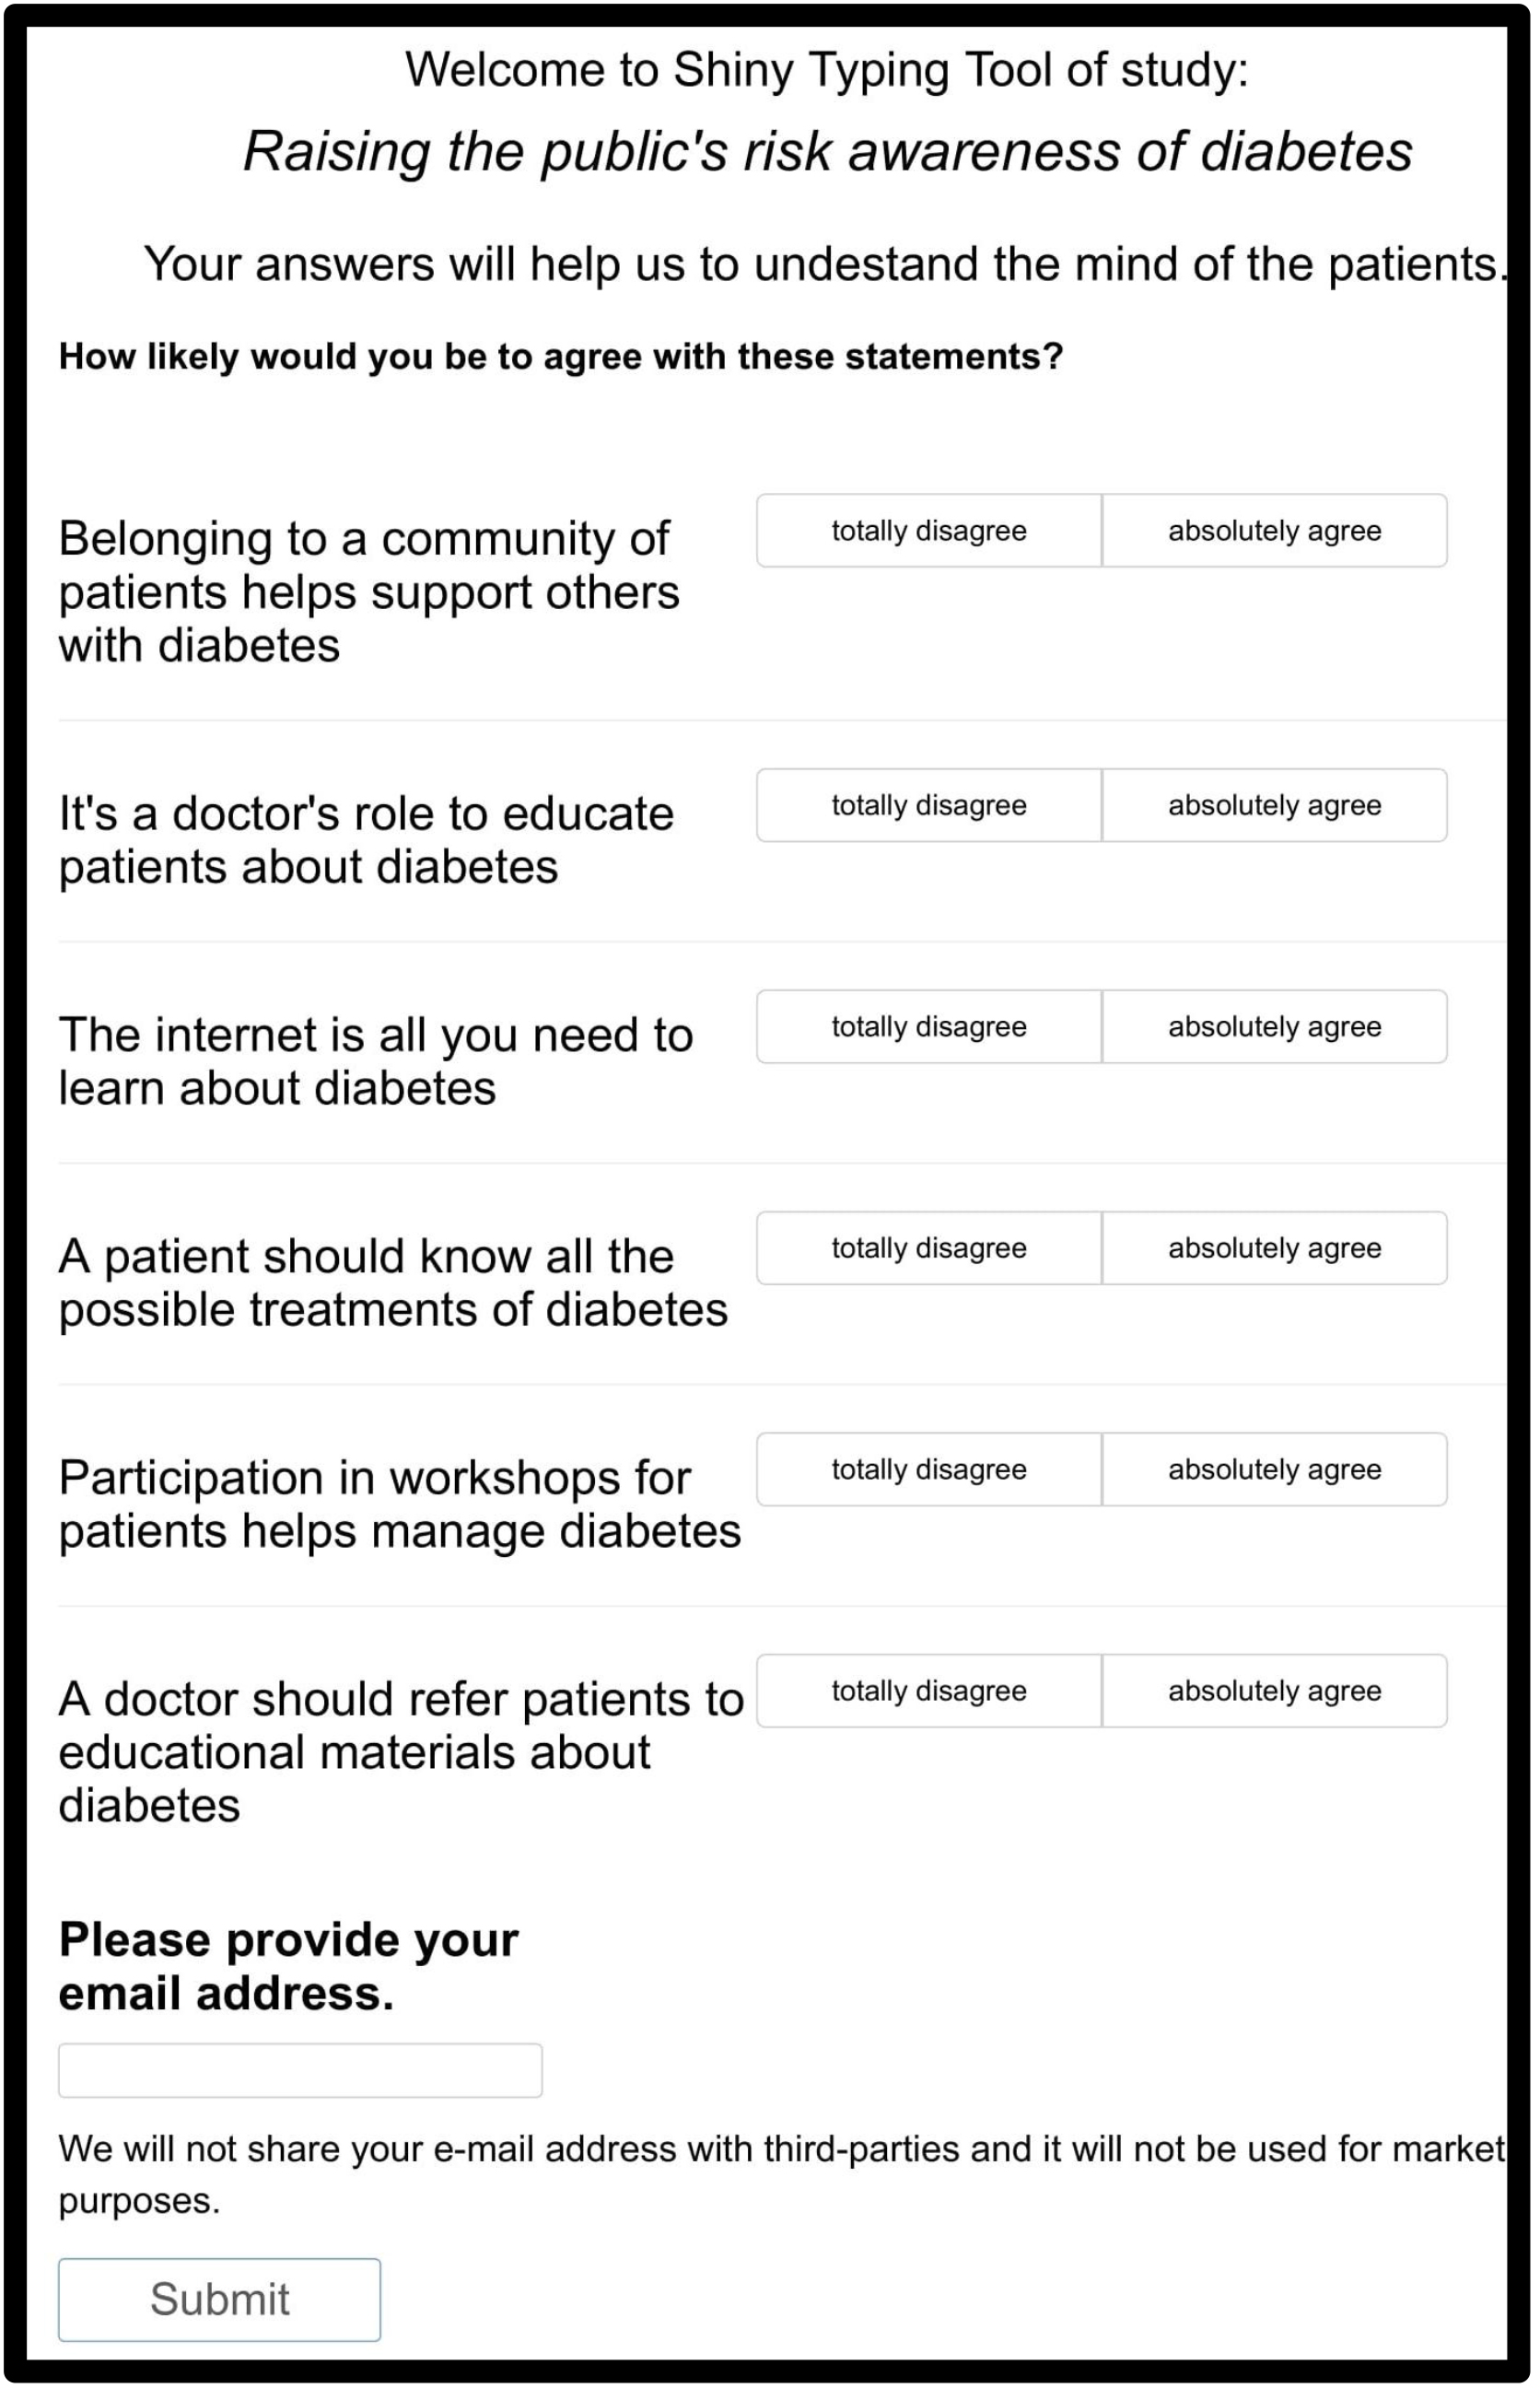
Figure 2. The six-question PVI for diabetes
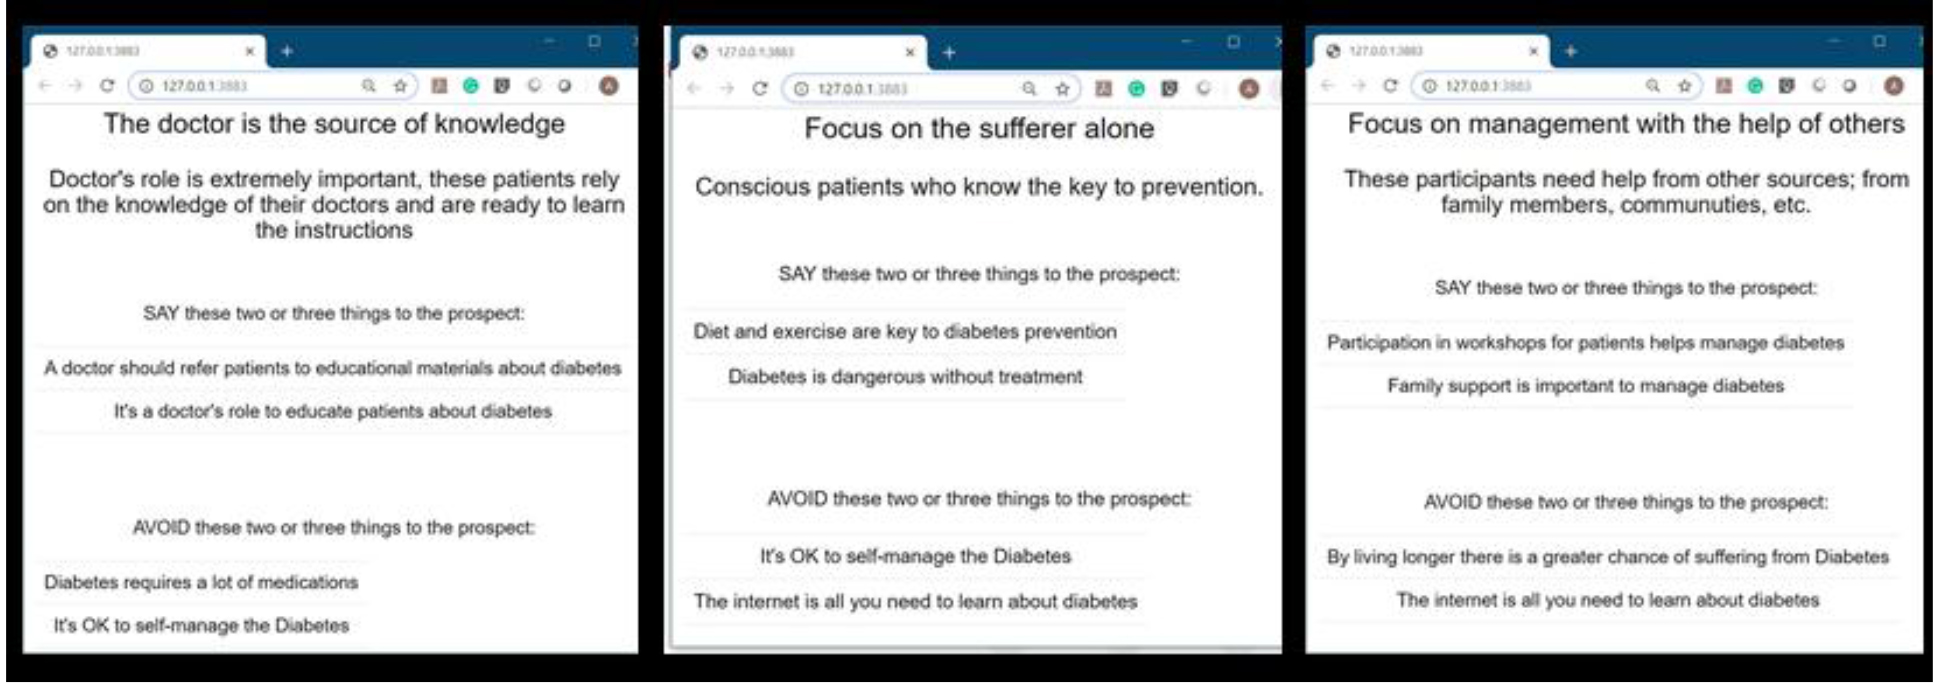
Figure 3. The three feedback pages, each attuned to the sensibilities of the person assigned to the mind-set by the diabetes-focused PVI
Discussion and conclusions
Mind Genomics provides a new vision for the world of the person’s experience with the worlds of medicine and public health. Whereas much of what we know about medicine comes from clinical studies with patients as test subjects, and in turn, much of what we know about public health comes from statistical studies of populations, Mind Genomics plunges right into the mind of the person, to find out what is important. Mind Genomics begins at the bottom, at the simplest level of communication, the communication of facts and suggestions. Soon, however, Mind Genomics moves on to understanding the attitudes of the person towards issues and situations in medicine and public health. In doing so Mind Genomics may be said to provide a major advance to the worlds of medicine and public health because it deals with the person, the specifics, and recommends actions.
A proactive health program recognizes the need for better communications (23,44)Until now, however, the focus has been on recognizing the ‘need’ and ‘effectiveness’ of communication, viz., on the establishment of these topics as relevant. Enter Mind Genomics with the ‘HOW,’ the specific ‘WHAT TO SAY.’ We may hope for a more powerful, more specific, targeted, effective communication, which in the case of diabetes may lead to more healthful activities before diabetes strikes, and in turn more medically-relevant compliance and behavior just as diabetes strikes, or threatens to strike.
Acknowledgment
Attila Gere thanks the support of the Premium Postdoctoral Researcher Program of the Hungarian Academy of Sciences
References
- Chen R, Song Y, Hu Z, Brunner EJ (2012) Predictors of diabetes in older people in urban China. PloS one 7: 50957.
- World Health Organization: World Diabetes: https://www.who.int/news-room/fact-sheets/detail/the-top-10-causes-of-death. Retrieved on May 25, 2019.
- Feigin VL, Roth GA, Naghavi M, Parmar P, Krishnamurthi R, et al (2016) Global burden of stroke and risk factors in 188 countries, during 1990–2013: a systematic analysis for the Global Burden of Disease Study 2013. The Lancet Neurology 15: 913–924..
- Krug EG (2016) Trends in diabetes: sounding the alarm. The Lancet 387: 1485–1486.
- Guariguata L, Whiting DR, Hambleton I, Beagley J, Linnenkamp U, et al (2014) Global estimates of diabetes prevalence for 2013 and projections for 2035. Diabetes research and clinical practice 103: 137–149.
- Shaw JE, Sicree RA, Zimmet PZ,( 2010) Global estimates of the prevalence of diabetes for 2010 and 2030. Diabetes research and clinical practice 87: 4–14.
- Whiting DR, Guariguata L,Weil C, Shaw J (2011) IDF diabetes atlas: global estimates of the prevalence of diabetes for 2011 and 2030. Diabetes research and clinical practice 94: 311–321.
- International Diabetes Federation: IDF Diabetes Atlas (2011), Brussels, Belgium: International Diabetes Federation, 5; Risk factors. 2014. www.idf.org/about-diabetes/risk-factors.
- Wang, Yu, Zhang, Li et al,(2014)
- Bommer C, Heesemann E, Sagalova V, Manne-Goehler J, Atun R, et al (2017) The global economic burden of diabetes in adults aged 20–79 years: a cost-of-illness study. The lancet Diabetes & endocrinology 5: 423–430.
- Hackworth N, Moore SM, Hardie E (2007) A risk factor profile for pre-diabetes: biochemical, behavioural, psychosocial and cultural factors. eJApplPsychol 3: 14–26.
- Mumu SJ, Saleh F, Ara F, Haque MR, Ali L (2014) Awareness regarding risk factors of type 2 diabetes among individuals attending a tertiary-care hospital in Bangladesh: a cross-sectional study. BMC research notes 7: 599.
- Niederdeppe J, Bu QL, Borah P, Kindig DA, Robert SA (2008) Message design strategies to raise public awareness of social determinants of health and population health disparities. The Milbank Quarterly 86: 481–513.
- Moskowitz HR (2012) ‘Mind genomics’: The experimental inductive science of the ordinary, and its application to aspects of food and feeding. Physiology & Behavior 107: 606–613.
- Moskowitz HR (2014) 14 Mind genomics® and texture: the experimental science of everyday life. In: Food Texture Design and Optimization In: Dar YL, Light JM (eds.) John Wiley.
- Moskowitz H, Gofman A (2003) I-nnovation Inc, System and method for content optimization. U.S. Patent: 6,662,215.
- Gabay G, Zemel G, Gere A, Zemel R, Papajorgji P, et al (2018) On the threshold: What concerns healthy people about the prospect of Cancer? Cancer Studies and Therapeutics Journal, 3: 1–10.
- Gabay G, Moskowitz HR, Silcher M, Galanter E (2017) New NovumOrganum: Policy, perceptions and emotions in health Pardes-Ann Harbor Academic Press.
- Gabay G, Gere A, Stanley, Habsburg-Lothringen C, Moskowitz H (2019) Health Threats Awareness – Responses to Warning Messages about Cancer and Smartphone Usage. Cancer Stud Ther J 4: 1–10.
- Gabay G, Gere A, Moskowitz H (2019) Understanding Effective Web Messaging – The Case of Menopause. IntegrGynObstet J 2: 1–16.
- Gabay G, Gere A, Zemel G, Moskowitz D, Shifron R, et al (2019) Expectations and Attitudes Regarding Chronic Pain Control: An Exploration Using Mind Genomics. Internal Med Res Open J 4: 1–10.
- Gabay G, Gere A, Moskowitz H (2019) Uncovering Communication Messages for Health Promotion: The Case of Arthritis. Integr J OrthopTraumatol 2: 1–13.
- Aikens JE, Bingham R, Piette JD (2005) Patient-provider communication and self-care behavior among type 2 diabetes patients. The Diabetes Educator 31: 681–690.
- Freeman J, Loewe R (2000) Barriers to communication about diabetes mellitus. Journal of Family Practice 49: 507.
- Greene JA, Choudhry NK, Kilabuk E, Shrank WH (2011) Online social networking by patients with diabetes: a qualitative evaluation of communication with Facebook. Journal of General Internal Medicine 26: 287–292.
- Rhodes P, Nocon A (2003) A problem of communication? Diabetes care among Bangladeshi people in Bradford. Health & social care in the community 11: 45–54.
- Dar-Nimrod I, Rawn CD, Lehman DR, Schwartz B (2009) The maximization paradox: The costs of seeking alternatives. Personality and Individual Differences 46: 631–635.
- Box GE, Hunter WG, Hunter JS (1978) Statistics for experimenters, New York, John Wiley
- Moskowitz HR, Gofman A (2007) Selling blue elephants: How to make great products that people want before they even know they want them. Pearson Education.
- Moskowitz HR, Gofman A, Beckley J, Ashman H (2006) Founding a new science: Mind genomics. Journal of sensory studies 21: 266–307.
- Green PE, Rao VR (1971) Conjoint measurement for quantifying judgmental data. Journal of marketing research 8: 355–363.
- Green PE, Srinivasan V (1990) Conjoint analysis in marketing: new developments with implications for research and practice. The journal of marketing 54: 3–19.
- Moskowitz HR, Gofman A, Itty B, Katz R, Manchaiah M, et al (2001) Rapid, inexpensive, actionable concept generation and optimization: the use and promise of self-authoring conjoint analysis for the food service industry. Food Service Technology 1: 149–167.
- Kahneman D, Egan P (2011) Thinking, fast and slow. New York: Farrar, Straus and Giroux.
- Gofman A, Moskowitz H (2010) Isomorphic permuted experimental designs and their application in conjoint analysis. Journal of Sensory Studies 25: 127–145.
- Wells WD (2011) Chapter 13: LifeStyle and Psychographics: Definitions, Uses, and Problems. In: Wells WD (ed.), LifeStyle and Psychographics. Marketing Classics Press Decatur, GA, USA.
- Dubes R, Jain AK (1980) Clustering methodologies in exploratory data analysis. Advances in Computers19: 113–238.
- Stevens SS (1966) Personal communication to Howard Moskowitz, Harvard University, Department of Psychology, Laboratory of Psychophsysics.
- Rieber RW, Robinson (2001) Wilhelm Wundt in history: The making of a scientific psychology In: DK (eds.). Springer Science & Business Media. Heidelberg, New York,USA.
- Heisler M, Bouknight RR, Hayward RA, Smith DM, Kerr EA (2002) The relative importance of physician communication, participatory decision making, and patient understanding in diabetes self-management. Journal of general internal medicine 17: 243–252.
- Heisler Michele, Ian Cole, David Weir, Eve A Kerr, Rodney A Hayward (2007) “Does physician communication influence older patients’ diabetes self-management and glycemic control? Results from the Health and Retirement Study (HRS).” The Journals of Gerontology Series A: Biological Sciences and Medical Sciences 62: 1435–1442.
- Matthews SM, Peden AR, Rowles GD (2009) Patient–provider communication: Understanding diabetes management among adult females. Patient education and counseling 76: 31–37.
- Schillinger D, Bindman A, Wang F, Stewart A, Piette J (2004). Functional health literacy and the quality of physician–patient communicationamong diabetes patients. Patient education and counseling 52: 315–323.
- Naik AD, Kallen MA, Walder A, Street Jr RL (2008) Improving Hypertension Control in Diabetes Mellitus, the Effects of Collaborative and Proactive Health Communication. Circulation 117: 1361.