Abstract
The study presents a cartography of the ‘self’ from the point of view of experimental psychology, applied to social theory. We explore how people describe themselves in their interactions with others, using experimentally designed vignettes of descriptive statements, constructed according to the prescriptions of Mind Genomics. The pattern of deconstructed responses to the vignettes and the weighting factors of the descriptive statement suggest that people divide into three mind-sets one group focusing on people, one group focusing on games, and one group hard to define. The study presents a tool, the six-question PVI, personal viewpoint identifier, which allows the researcher to assign a new person to one of the three mind-sets based upon the pattern of response to the six questions. The study failed to find a strong co-variation of age with membership in the mind-set, but does suggest that response time to the different descriptive statements may show the hypothesized relation of personality to age.
Introduction
Philosopher George Herbert Mead wrote that the self emerges from the internalized interactions with others. Of course, heredity is a kind of base from which to build the self, but it is not the ongoing architect of the self. Rather, beginning with internalized interactions with parents, the self can be said to be formed over time. Following this idea, one can think of a person’s self as a kind of congeries of internalized others, thinking and action are a result of a sort of internal discussion among those “others.”
The theoretical thinking behind this study can be summarized in these nine points:
- The human personality is not fixed. It is a kind of ongoing internal conversation, sometimes placid, and directed, sometimes excited and divergent.
- Personality is constructed on a base of face to face interactions when very young, usually primarily with parents, somewhat later with other meaningful others [1].
- These interactions are internalized into a kind of picture of the world with which the person acts. Mead called this the “generalized other” [2].
- As the person ages, he or she integrates others, bits and pieces of the meanings and attitudes of peers, teachers, buddies, enemies. That means that the person is always changing, although the evolving personality builds on that early base [3].
- Even though the person does change over time those changes slow as the person ages.
- Interaction with these others is most effective and meaningful when they are directly made, not mediated by such things as telephones, the internet, or writing.
- Other important inputs come from the worlds of advertising, marketing, the media, education, video games, and word of mouth. DeCerteau [4] called these “fragments.” These fragments are less ordered and, as they are integrated, lead to less organized and connected personae.
- In addition, the media (and the new social media) have become more salient in people’s lives. A middle-class white person may spend up to seven hours a day immersed in commercial media or the new social media. A French commentator [5] even believed that the action, color, and fury of the commercial media can become “hyperreality”, displacing the dull, often degrading, everyday reality. If true, then man of us live at least in part in dream worlds,
- Assuming all this is true, we can expect that the forms of connection among different people will reflect in their behavior. That is, that people will internalize their interactions with “others”. These internalized “others” form a “self. Thought in that “self” is a kind of internal discussion. What those “others” are like may vary dramatically across people [6].
Mead could not envision the complex communications world today. Beginning in early childhood, other kinds of communications have augmented and replaced face-to-face interactions. The telephone, texting, Facebook exemplify of mediated interactions. Television is an example of one-way interaction mediated by images on a screen. Games and AI (artificial intelligence) are examples of two-way interactions with non-humans, even interactions with those who/which are sometimes wiser and more correct than mere humans.
What kinds of selves result from this change in the life-worlds of people now? A core hypothesis is that people formed in the world of mediated communication are less likely, less able to immerse themselves in direct interpersonal communication. Why be bound by time and space when one can text? Why argue with someone else when you can cut him (or her) off on Facebook?
The ideal way to answer this and other questions is to do a massive longitudinal study. Some preliminary answer can be uncovered in a survey using these assumptions:
- People can identify their own behavior adequately without delving into precise measures of time spent of that activity.
- Age can serve as an adequate substitute for longitudinal research. Older people internalize the effects of less mediated interpersonal relations; younger people will have internalized the effect of more mediated, less-interpersonal relations.
Subjecting Mead’s conjecture to empirical analysis using a Mind Genomics experiment
One of the key tools of sociology is the survey, wherein the respondent is asked a variety of relevant questions about a topic, responds, and then the answers are tabulated, and, in some cases, compared to exogenous behavior, so-called ‘real world’ behavior. This approach is the sociological approach, working with large numbers, and seeking covariations between and among variables, covariations which should be relevant and strong, so that the relations emerge out of the background ‘noise.’ From this emergence, the results, usually from noisy cross-sectional analysis, show significant relations, occasionally sufficient to falsify the hypothesis, but not necessarily strong enough to force acceptance of the hypothesis.
Mind Genomics provides sociological theory with a different way to think of the problem, one which works with systematically varied stimuli, phrases, obtains responses, reveals strong relations where they exist, and thus more rapidly drives to accepting or falsifying the conjecture.
In the study reported here, people were instructed to judge the extent to which a series of combinations of forms of communication (vignette) described them. These vignettes comprised statements about the actual communication as well as statements about their own wishes and desires with respect to others. The responses to these combinations were deconstructed to see what messages within the vignettes truly defined the respondent. The rationale for using vignettes comprising combinations, rather than the more common ‘isolated, single idea’ that ‘mixtures’ of messages provide a more ‘natural’ type of stimulus, a compound description of the type one typically encounters, Furthermore, the systematized mixing of different descriptions into vignettes, make it impossible for the respondent to ‘game’ the system, to be politically correct, and in doing allow one’s an internal mental editor to skew the results.
Method
The study used Mind Genomics, a newly emerging branch of psychological science with roots in mathematical psychology, marketing, and statistics [7–11]. Mind Genomics focuses on the experimental analysis of the everyday, the quotidian aspects of our lives. The ingoing principle of Mind Genomics, the world-view it presents, the methods it uses, the conclusions it draws, can be likened to the exploration of new worlds, telescopes when these new worlds are galaxies, cartography when these new worlds are lands, and the microscope and MRI (Magnetic Resonance Imagery) when the new worlds are biological tissue. In other Mind Genomics can be likened to mapping a world in terms of its granular specifics, without obeisance to the twin standard scientific efforts of ‘minimizing noise, and ‘falsifying an ingoing hypothesis. Mind Genomics looks for patterns and stops there.
Mind Genomics proceeds in a series of steps. We follow these steps with the data presented here.
Step 1 – Define the topic: The topic here is the nature of social interaction, in a world of pervasive electronics which compete for people’s time and which allow a person to interact with others in many ways, or not interact at all with people. The person may even to choose to interact with the increasingly realistic ‘world’ generated by the electronic device. The topic here is the ‘nature of one’s response to different forms of communication in an era of enhanced electronics’
Step 2 – Create the ‘raw material’ using the Socratic approach of question and answer(s): The raw material comprises a set of statements about the topic, statements which paint a ‘word picture.’ The research requirement is that the investigator work within the scope of the topic, asking four questions which ‘tell a story’ and then for each question, provide four ‘answers.’ The answers are simple stand-alone phrases. Table 1 presents these questions and answers.
Table 1. The ‘raw material’ for the study, comprising four questions, and four answers to each question.
|
|
Question A: How do I communicate with people? |
|
A1 |
Talk directly with people a lot |
|
A2 |
Talk on the phone a lot |
|
A3 |
Use Skype What’s App even dating chats a lot |
|
A4 |
Text and email a lot |
|
|
Question B: How do I communicate with non-people? |
|
B1 |
Often work alone on computer |
|
B2 |
Often play games on smartphone or computer |
|
B3 |
Research look up facts, e.g., Google or Siri |
|
B4 |
Read a lot on the screen. e-books or blogs |
|
|
Question C: How do I care for others? |
|
C1 |
I want to be mainly with my friends |
|
C2 |
I want to be mainly with my co workers |
|
C3 |
I want to be mainly with my family |
|
C4 |
I want to enjoy meeting new people A LOT |
|
|
Question D: What do I want ? |
|
D1 |
I would feel great when Ieft alone |
|
D2 |
I would feel great when I’m known as a friendly person |
|
D3 |
I would feel great when I’m known as successful and well off |
|
D4 |
I would feel great when I’m respected |
The Socratic method of questions and answers becomes a simple way of organizing different types of ideas. The questions will never be used in the actual respondent-facing experiment. Rather, the questions (also known as silos or categories) are simply there to drive the production of the different answers (also known as elements.) It is far easier to break the preparation into the two parts of developing questions which ‘tell a story’ (often considered the harder step), and then answering those questions with four alternative answers to each question (often considered the easier step.)
Step 3 – Use an Underlying Experimental Design to Specify the Combinations of Answers: Mind Genomics works by mixing/matching answers from the different questions. The underlying experimental design ensures that the effort to create the combinations is successful, in a manner which is both not onerous to the respondent and enables the data to be analyzed using OLS (ordinary least-squares) regression [12].
The underlying design has been presented previously [13], the design is a single structure, which, for this study calls for 24 different combinations or vignettes. Each combination comprises at most one answer from a question, but in many of the vignettes one or two questions do not contribute answers. These are incomplete combinations but tested alongside the complete combinations comprising exactly one answer from each question.
The experimental design ensures that each of the answers appears equally often across the set of 24 vignettes, and that the 16 answers are statistically independent. Furthermore, the incompleteness of some vignettes in the design prevents multi-collinearity. Furthermore, the incompleteness of the vignettes ensures that coefficients emerging from the OLS regression will have absolute properties, not relative ones. If the vignettes were all to have exactly one answer from each question, a practice of most individuals using ‘conjoint measurement’ and experimental design, then the regression coefficients would be relative, not absolute, and the exercise would have very little value for an archival science where the values of the coefficients are to have meaning as the science grows.
The actual creation of the experiment is done by transferring these questions and answers to a computer app. Figure 1 shows and example of what the researcher does to set up this Mind Genomics experiments. The entire process is ‘templated’ turning the ‘thinking’ part into the most effortful part of the project. The researcher need only ‘fill in the blanks,’ but must think strenuously about framing the topic as questions and answers.
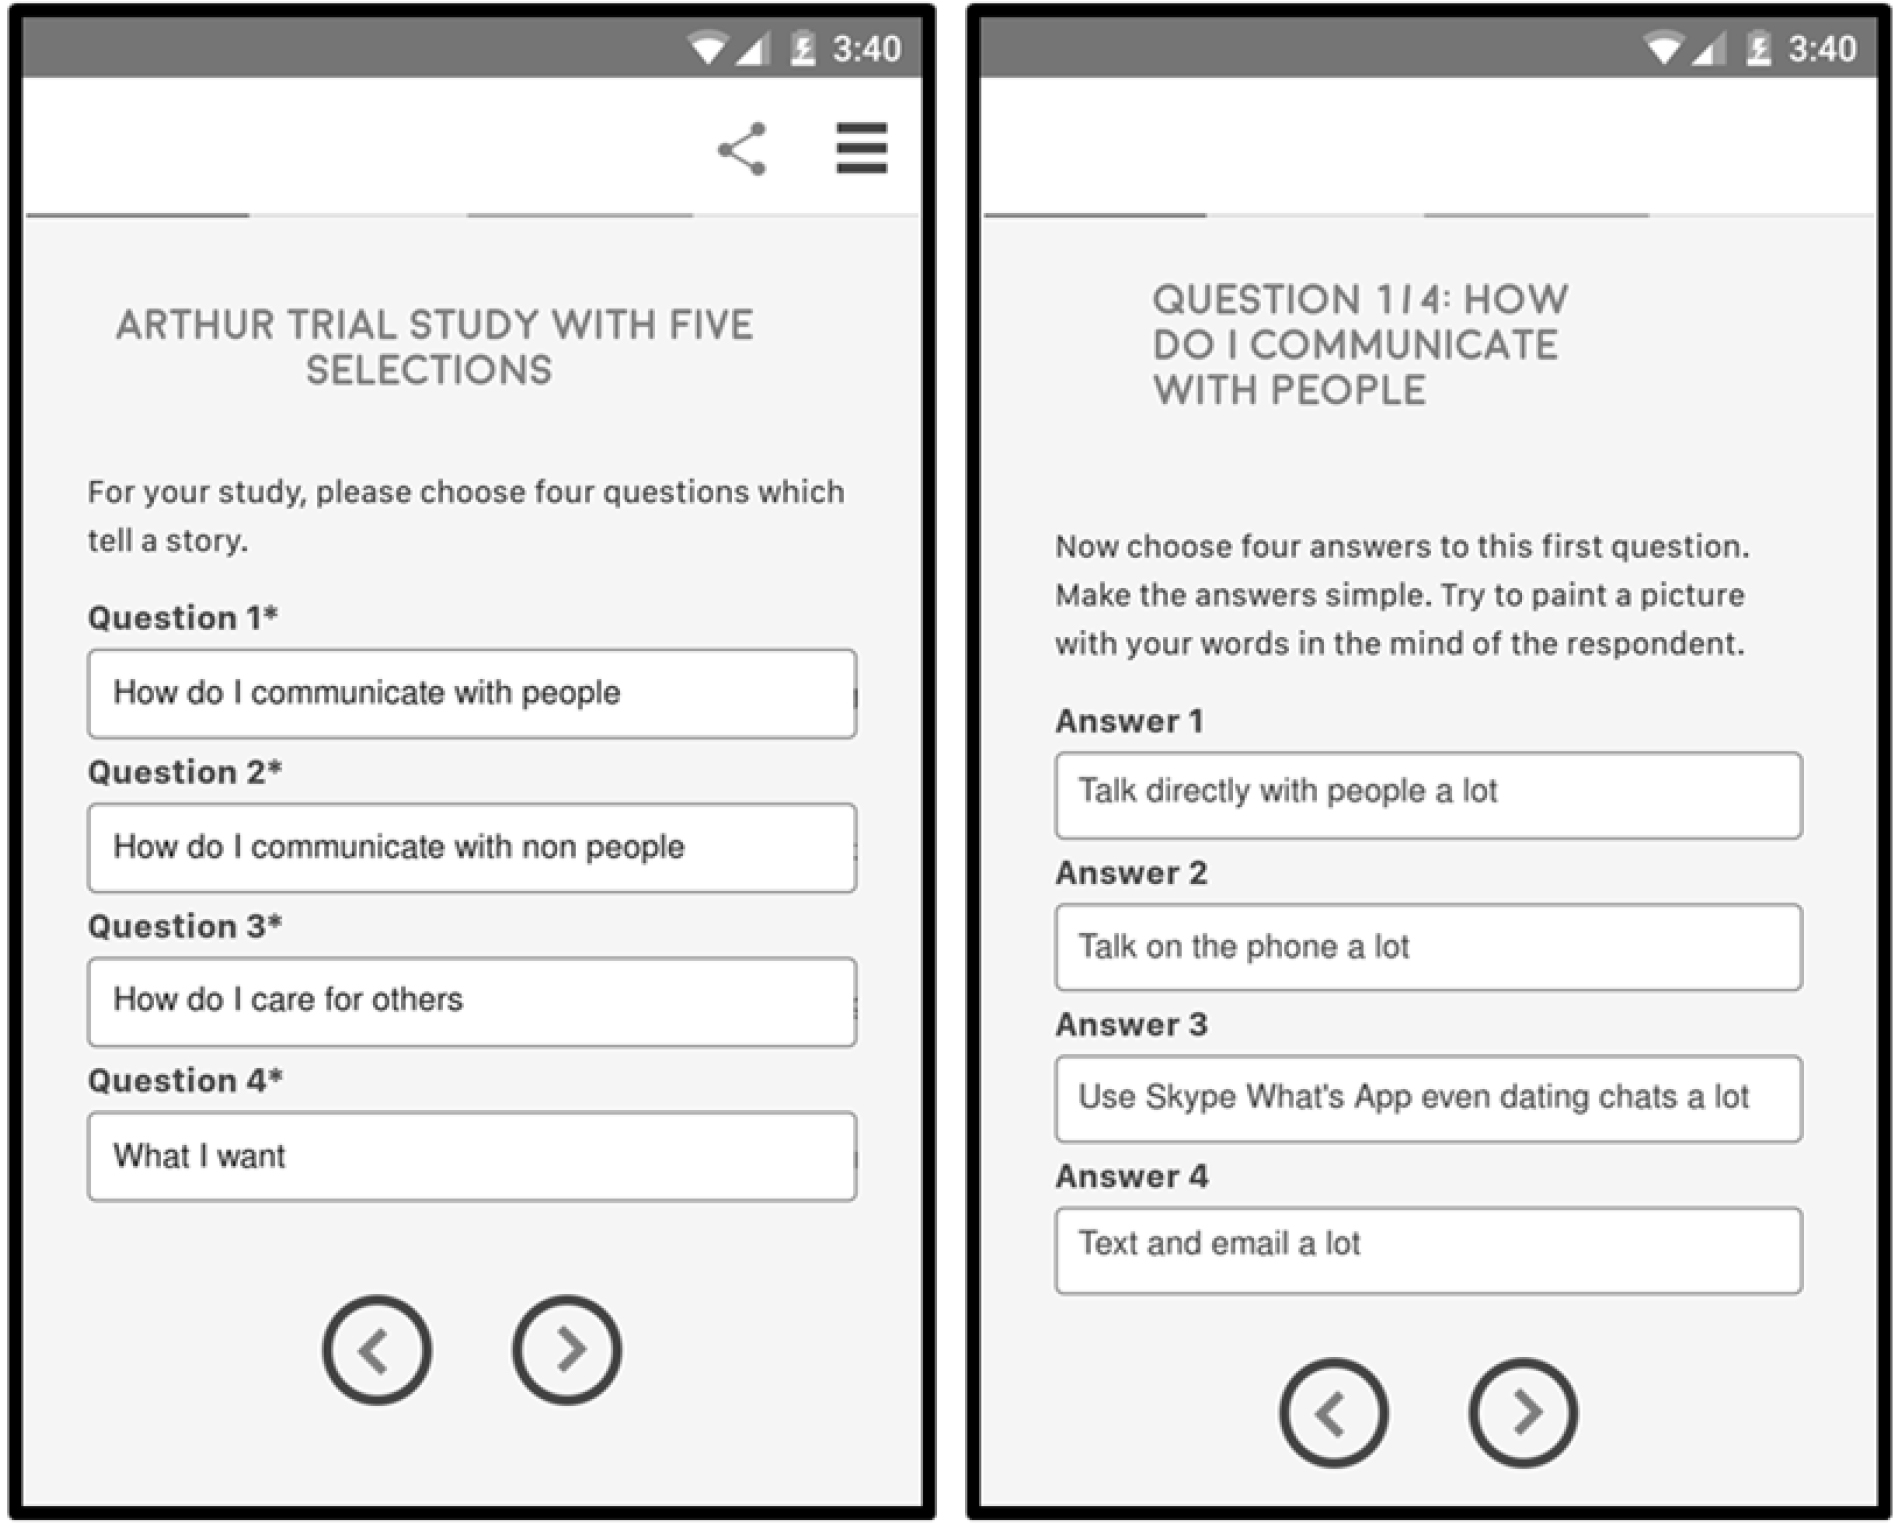
Figure 1. Example of the templated approach to doing the study. The figure shows the screens requiring the researcher to select four questions, and then provide four answers to the first of the four questions.
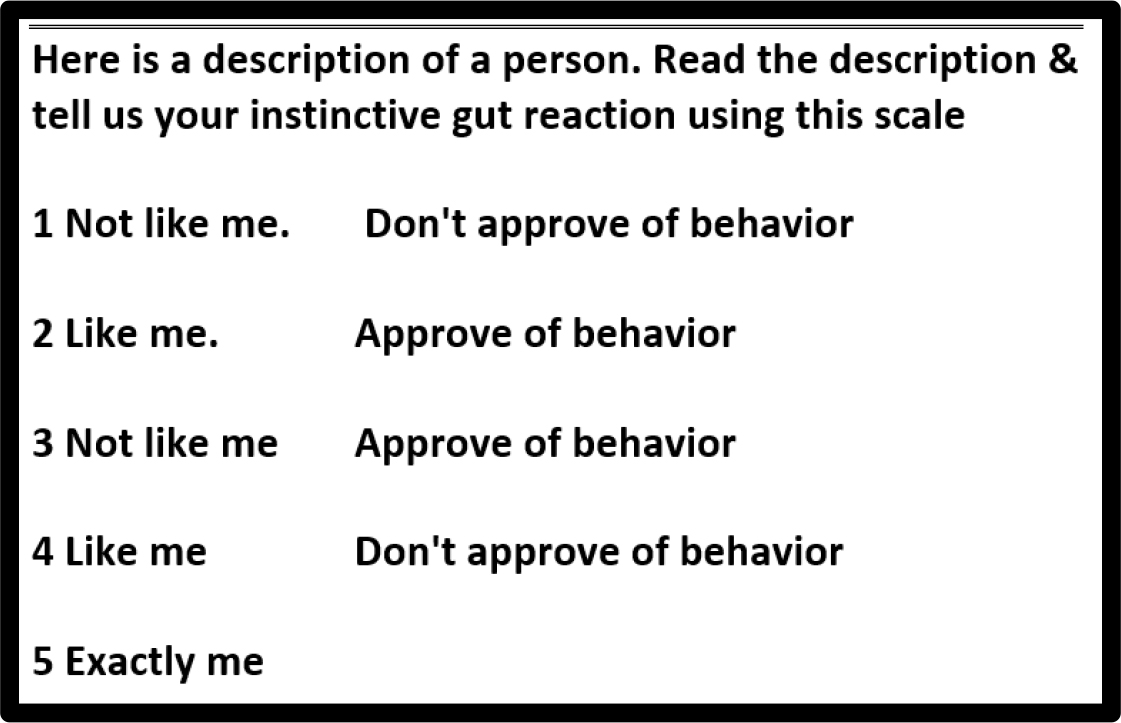
Figure 2. The five-point rating scale, incorporating two smaller scales within.
Step 4 – Create the Respondent Orientation Page: Social research with questionnaires is often done using simple scales, such as degree of feeling, from no feeling to strong feeling, or degree of agreement from disagree to agree. The first, degree of feeling, is an assessment of the attitude or behavior as it stands by itself, such as the strength of one’s belief in the attitude. The second is the degree to which the attitude or behavior ‘fits’ or ‘describes’ a person or a situation. The second, therefore, calls into play both one’s perception of the attitude or behavior, first as it exists, and then as it describes something or someone. There are two judgments in the second, albeit combined into one.
A good analogy of this division of questions comes from the world of food, specifically the area of sensory evaluation of a product, such as a pickle. One can rate the sourness of the pickle, a presumably ‘objective rating’, albeit one mediated by the sensory system. Or, in contrast, one can rate the degree of liking of that sourness, requiring the respondent to do two things when evaluating. The first is perceive the sourness, an action which is never observed. The second is judge the perception, an action which is observed.
The foregoing, evaluation of liking, was the motivator for the use of a modified scale, shown in Figure 2. The scale comprises five points. The scale really comprises two scales, a scale of approval (do not approve, approve) and a scale of reference (not like me, like me, exactly like me). In statistics the scale is known as a nominal scale. We will not use the numerical values of the scale, which are simply placeholders. Rather, in the analysis of the scale data we will look at the scale from three different points of view:
4a. Define the person – exactly me (select 5) versus not exactly me (select 1,2, 3 or 4). When we look at defining the person, a rating of 5 will be converted to 100 (plus a very small random number to ensure that the regression doesn’t crash.) A rating of 1,2,3 or 4, respectively, will be converted to 0 (plus a very small random number
4b. Define Like ME. Remove all vignettes with a rating of 5. For the remaining vignettes, assign a value of ‘100’ when the rating is 2 or 4, and assign a rating of ‘0’ when the rating is 1 or 3. This strategy creates a new variable which becomes ‘100’ when the rating is ‘like me’
4c. Define APPROVAL. Remove all vignettes with a rating of 5. For the remaining variables, assign a value of ‘100’ for ratings of 2 or 3, respectively. These were ratings of approval. Assign a value of ‘0’ for ratings of 1 or 4, which signaled disapproval.
Step 5 – Execute the study in the field: The Mind Genomics studies have been ‘templated’ so that they are easy to create, and to deploy. The traditional methods of market research have been to ask people to participate, encouraging participation by such anodynes as ‘your opinion counts.’ Waiting for the respondents to participate without any coercion such as membership in a panel has, in the past decades, become increasingly an exercise in futility. The Mind Genomics APP is equipped with a module allowing the researcher to select the target group and pay for the respondents who participate from that group. The payment fee, nominal at $2.60/respondent for a four-minute interview, virtually guarantees that the study of 50 respondents as shown here will be entirely completed, and rapidly, automatically summarized with an accompanying report approximately one-two hours after the study has been launched to the public.
Step 6 – Prepare the Data for Analysis: The data are recoded and prepared for regression analysis. The scale ratings are converted to a binary scale, 0/100. The response time remains as measured, the number of seconds (to the nearest tenth of a second) between the time the vignette appears on the screen and the time that the respondent keys in a rating.
The nature of the rating scale and the analysis required that the data be recoded, and then analyzed by OLS (ordinary least-squares) regression. The five-point scale shown in Figure 2 was deconstructed into the following sets of variables:
- Each of the five rating points became its own attribute (R1, R2, R3, R4, R5). For vignette only one of the five newly created attributes corresponded to a rating that had been chosen. For example, when the respondent selected R5, the newly created variable of R5 was converted to 100, and the other four newly created variables were converted to 0.
- A new variable ‘NET ME’ was created. NET ME had the following structure: Ratings ‘2’ and ‘4’ were converted to 100; Ratings ‘1,’ ‘3,’ were converted to 0.
- A new variable ‘NET APPROVE’ was created. Ratings ‘2’ and ‘3’ were converted to 100. Ratings ‘1’ and ‘4’ were converted to 0
- For analysis of the relation between the presence/absence of the 16 elements and both ME and APPROVE, all vignettes assigned a rating ‘5’ were removed from the database
Step 7 – Build the model for EXACTLY ME: Our data comprised 50 respondents x 24 responses to the 24 systematically created vignettes for each respondent. Every respondent evaluated a unique set of 24 such vignettes, so we cannot average the ratings of the vignettes to get a sense of what ideas or messages work, and what do not work. The more appropriate way is to create a model, either for the total panel, or for the relevant subgroup (e.g., a specific age group). The model is expressed by the simple linear equation: EXACTLY ME = k0 + k1(A1) + k2(A2) … k16(D4). The coefficients show the contribution of each element to the likelihood that the vignette will be rated ‘5’, i.e., EXACTLY ME.’ The additive constant, k0, is a purely estimated parameter, showing the expected probability of a vignette will be rated ‘5’, EXACTLY ME in the absence of elements. The additive constant, purely theoretical, serving a purpose, but not necessary to the understanding of the comparative performance of the elements.
Step 8 – Lay out the data in a matrix form and identify patterns in terms of which particular elements ‘drive’ the response EXACTLY ME: Table 2 shows us the results from the analysis of EXACTLY ME. Each column of data represents the coefficients for the model estimated by putting ALL relevant respondents in the subgroup into a single pool of data, and then running ONE OLS regression on all the data of the group of relevant respondents. Thus, for Age 15–24, we compute only one OLS regression, incorporating all the relevant data.
Table 2. How the 16 answers ‘drive’ the selection of EXACTLY ME (Rating of 5 transformed to 100; Ratings 1,2,3,4 transformed to 0.
|
|
|
Total |
Age |
Mind-Set |
||||
|
|
Model based on relating the binary scale from R5 (Exactly ME) to the 16 answers or elements |
Total |
A15–24 |
A25–39 |
A40+ |
3C- Games |
3D – Other |
3E – People |
|
|
Base size |
50 |
14 |
17 |
19 |
17 |
17 |
16 |
|
|
Additive constant |
27 |
24 |
24 |
28 |
26 |
33 |
26 |
|
B2 |
Often play games on smartphone or computer |
5 |
5 |
0 |
11 |
10 |
1 |
3 |
|
C3 |
I want to be mainly with my family |
3 |
-1 |
4 |
5 |
4 |
0 |
6 |
|
D2 |
I would feel great when I’m known as a friendly person |
1 |
1 |
2 |
4 |
4 |
-11 |
10 |
|
D4 |
I would feel great when I’m respected |
0 |
8 |
-4 |
0 |
-2 |
1 |
1 |
|
B1 |
Often work alone on computer |
-1 |
4 |
-6 |
1 |
-2 |
2 |
-5 |
|
B4 |
Read a lot on the screen… E-books or blogs |
-1 |
-3 |
-5 |
4 |
-4 |
2 |
-2 |
|
C1 |
I want to be mainly with my friends |
-1 |
4 |
0 |
-3 |
-1 |
0 |
0 |
|
C4 |
I want to enjoy meeting new people A LOT |
-1 |
2 |
4 |
-6 |
1 |
0 |
-2 |
|
B3 |
Research look up facts e.g. Google or Siri |
-2 |
-6 |
-8 |
8 |
-2 |
-6 |
1 |
|
D1 |
I would feel great when Ieft alone |
-2 |
10 |
-8 |
-3 |
-2 |
-2 |
-2 |
|
A1 |
Talk directly with people a lot |
-3 |
-13 |
5 |
-1 |
-15 |
0 |
3 |
|
A4 |
Text and email a lot |
-3 |
-8 |
10 |
-9 |
-9 |
-9 |
7 |
|
D3 |
I would feel great when I’m known as successful and well off |
-3 |
4 |
-5 |
-3 |
-1 |
-6 |
-1 |
|
A2 |
Talk on the phone a lot |
-5 |
-4 |
1 |
-11 |
-11 |
-2 |
-7 |
|
C2 |
I want to be mainly with my co workers |
-5 |
6 |
-6 |
-10 |
1 |
-8 |
-8 |
|
A3 |
Use Skype What’s App even dating chats a lot |
-10 |
-8 |
-2 |
-16 |
-11 |
-17 |
-7 |
The respondents from the different age groups and different mind-sets show similar additive constants (24–33). The low additive constant suggests that, in the absence of elements, a purely hypothetical situation, we might expect a quarter to a third of the responses to be ‘Describes EXACTLY ME. The additive coefficient is a good baseline. It will the task of the individual elements to drive the perception of ‘EXACTLY ME’
There are no strong performing elements for Total Panel. This failure for any single element to drive a strong rating of EXACTLY ME may result either from the fact that no elements describe the respondent, or more likely, from the fact that there are countervailing forces which cancel each other. In contrast, key subgroups show dramatic differences
Total Panel
No strongly performing element
Age 15–24
I would feel great when Ieft alone
I would feel great when I’m respected
I want to be mainly with my co workers
Age 25–39
Text and email a lot
Age 40+
Often play games on smartphone or computer
Research look up facts e.g. Google or Siri
Step 9 – Uncover Mind-Set segments from the total population, based on EXACTLY ME: One of the key objectives of Mind Genomics is to uncover new-to-the-world groups of ideas or people, which provide a unique and identifiable focus. We introduce mind-sets here, as part of the way we classify the respondents. We create these mind-set segments by clustering coefficients. We begin by creating the EXACTLY ME model for each respondent, so that we create 50 individual models. This is made possible by the way we set up the study, which was to create the vignettes from each respondent using an underlying experimental design. The benefit is that now we create a model for each respondent separately. We store the 16 coefficients, not the additive constant, and then cluster the 50 respondents using the pattern of their 16 coefficients.
We generated two and then three clusters, so-called mind-set segments. The two-cluster solution did not make sense, and was difficult to interpret, so we discarded it. The three-cluster solution made sense in terms of interpretation, and so it becomes the basis for the subsequent analysis of ‘what these data suggest about personality.’ Clustering is a well-established approach [14]. The final three data columns one the right side of Table 2 shows the coefficients for the three emergent mind-sets.
From the response patterns based on the linkage between the 16 answers and the rating of EXACTLY ME we can also assign names to the mind-sets
Mind-Set 3C – Focuses on games
Often play games on smartphone or computer
Mind-Set 3D
Nothing
Mind-Set 3E – Focuses on people
I would feel great when I’m known as a friendly person
Text and email a lot
I want to be mainly with my family
Finding these mind-sets in the general population
Traditional research has often assumed, whether explicitly or implicitly, that people who are similar to each other should be the basis of groups to be studied. The corollary to that is that people who are similar should think in similar ways. That is, we think of groups of people in terms of who they ARE and assume that how they THINK will be the same. Table 2 shows clearly that there are different patterns of thinking and different criteria for the same topic. Table 3 shows that these three groups of people, mind-sets, distribute in similar ways across the population. If we were to expand this study to be a thousand times larger, with 50,000 respondents rather than 50 respondents, it is quite likely that we would still be faced with a flat distribution of mind-sets cross the traditional groupings in the populations.
Table 3. Distribution of the three mind-sets across age, gender and the choice of what is most important (from the self-profiling classification at the start of the Mind Genomics experiment).
|
|
MS 3C Games |
MS 3D Other |
MS 3E People |
Total |
|
Total |
17 |
17 |
16 |
50 |
|
Gender |
|
|
|
|
|
Male |
9 |
7 |
9 |
25 |
|
Female |
8 |
10 |
7 |
25 |
|
Age |
|
|
|
|
|
A15–24 |
6 |
4 |
4 |
14 |
|
A25–39 |
4 |
8 |
5 |
17 |
|
A40–82 |
7 |
5 |
7 |
19 |
|
What is most important |
|
|
|
|
|
Being with other people |
11 |
4 |
8 |
23 |
|
Where I live |
3 |
2 |
2 |
7 |
|
What I own |
0 |
2 |
1 |
3 |
|
Work I do now |
2 |
5 |
3 |
10 |
|
No answer |
1 |
4 |
2 |
7 |
In order to assign a new person to the appropriate mind-set we engage the new person in a short interaction, with a set of questions, designed to predict membership. The approach is known as the PVI, the personal viewpoint identifier. The six questions are those which best differentiate among the three mind-sets. The questions are taken for the set of 16 answers or elements, recast as questions, and given to possible answers. The 64 different patterns that could be created from the set of six questions are mapped to the three mind-sets, so that each response pattern assigns the person who produces that pattern to one of the three mind-sets.
Figure 3 shows the six-question PVI for this study. Figure 4 shows the feedback for the three different patterns. The feedback can be given to the new individuals or stored in a database for further research or for application in later deployment, such as sales or voter communication.
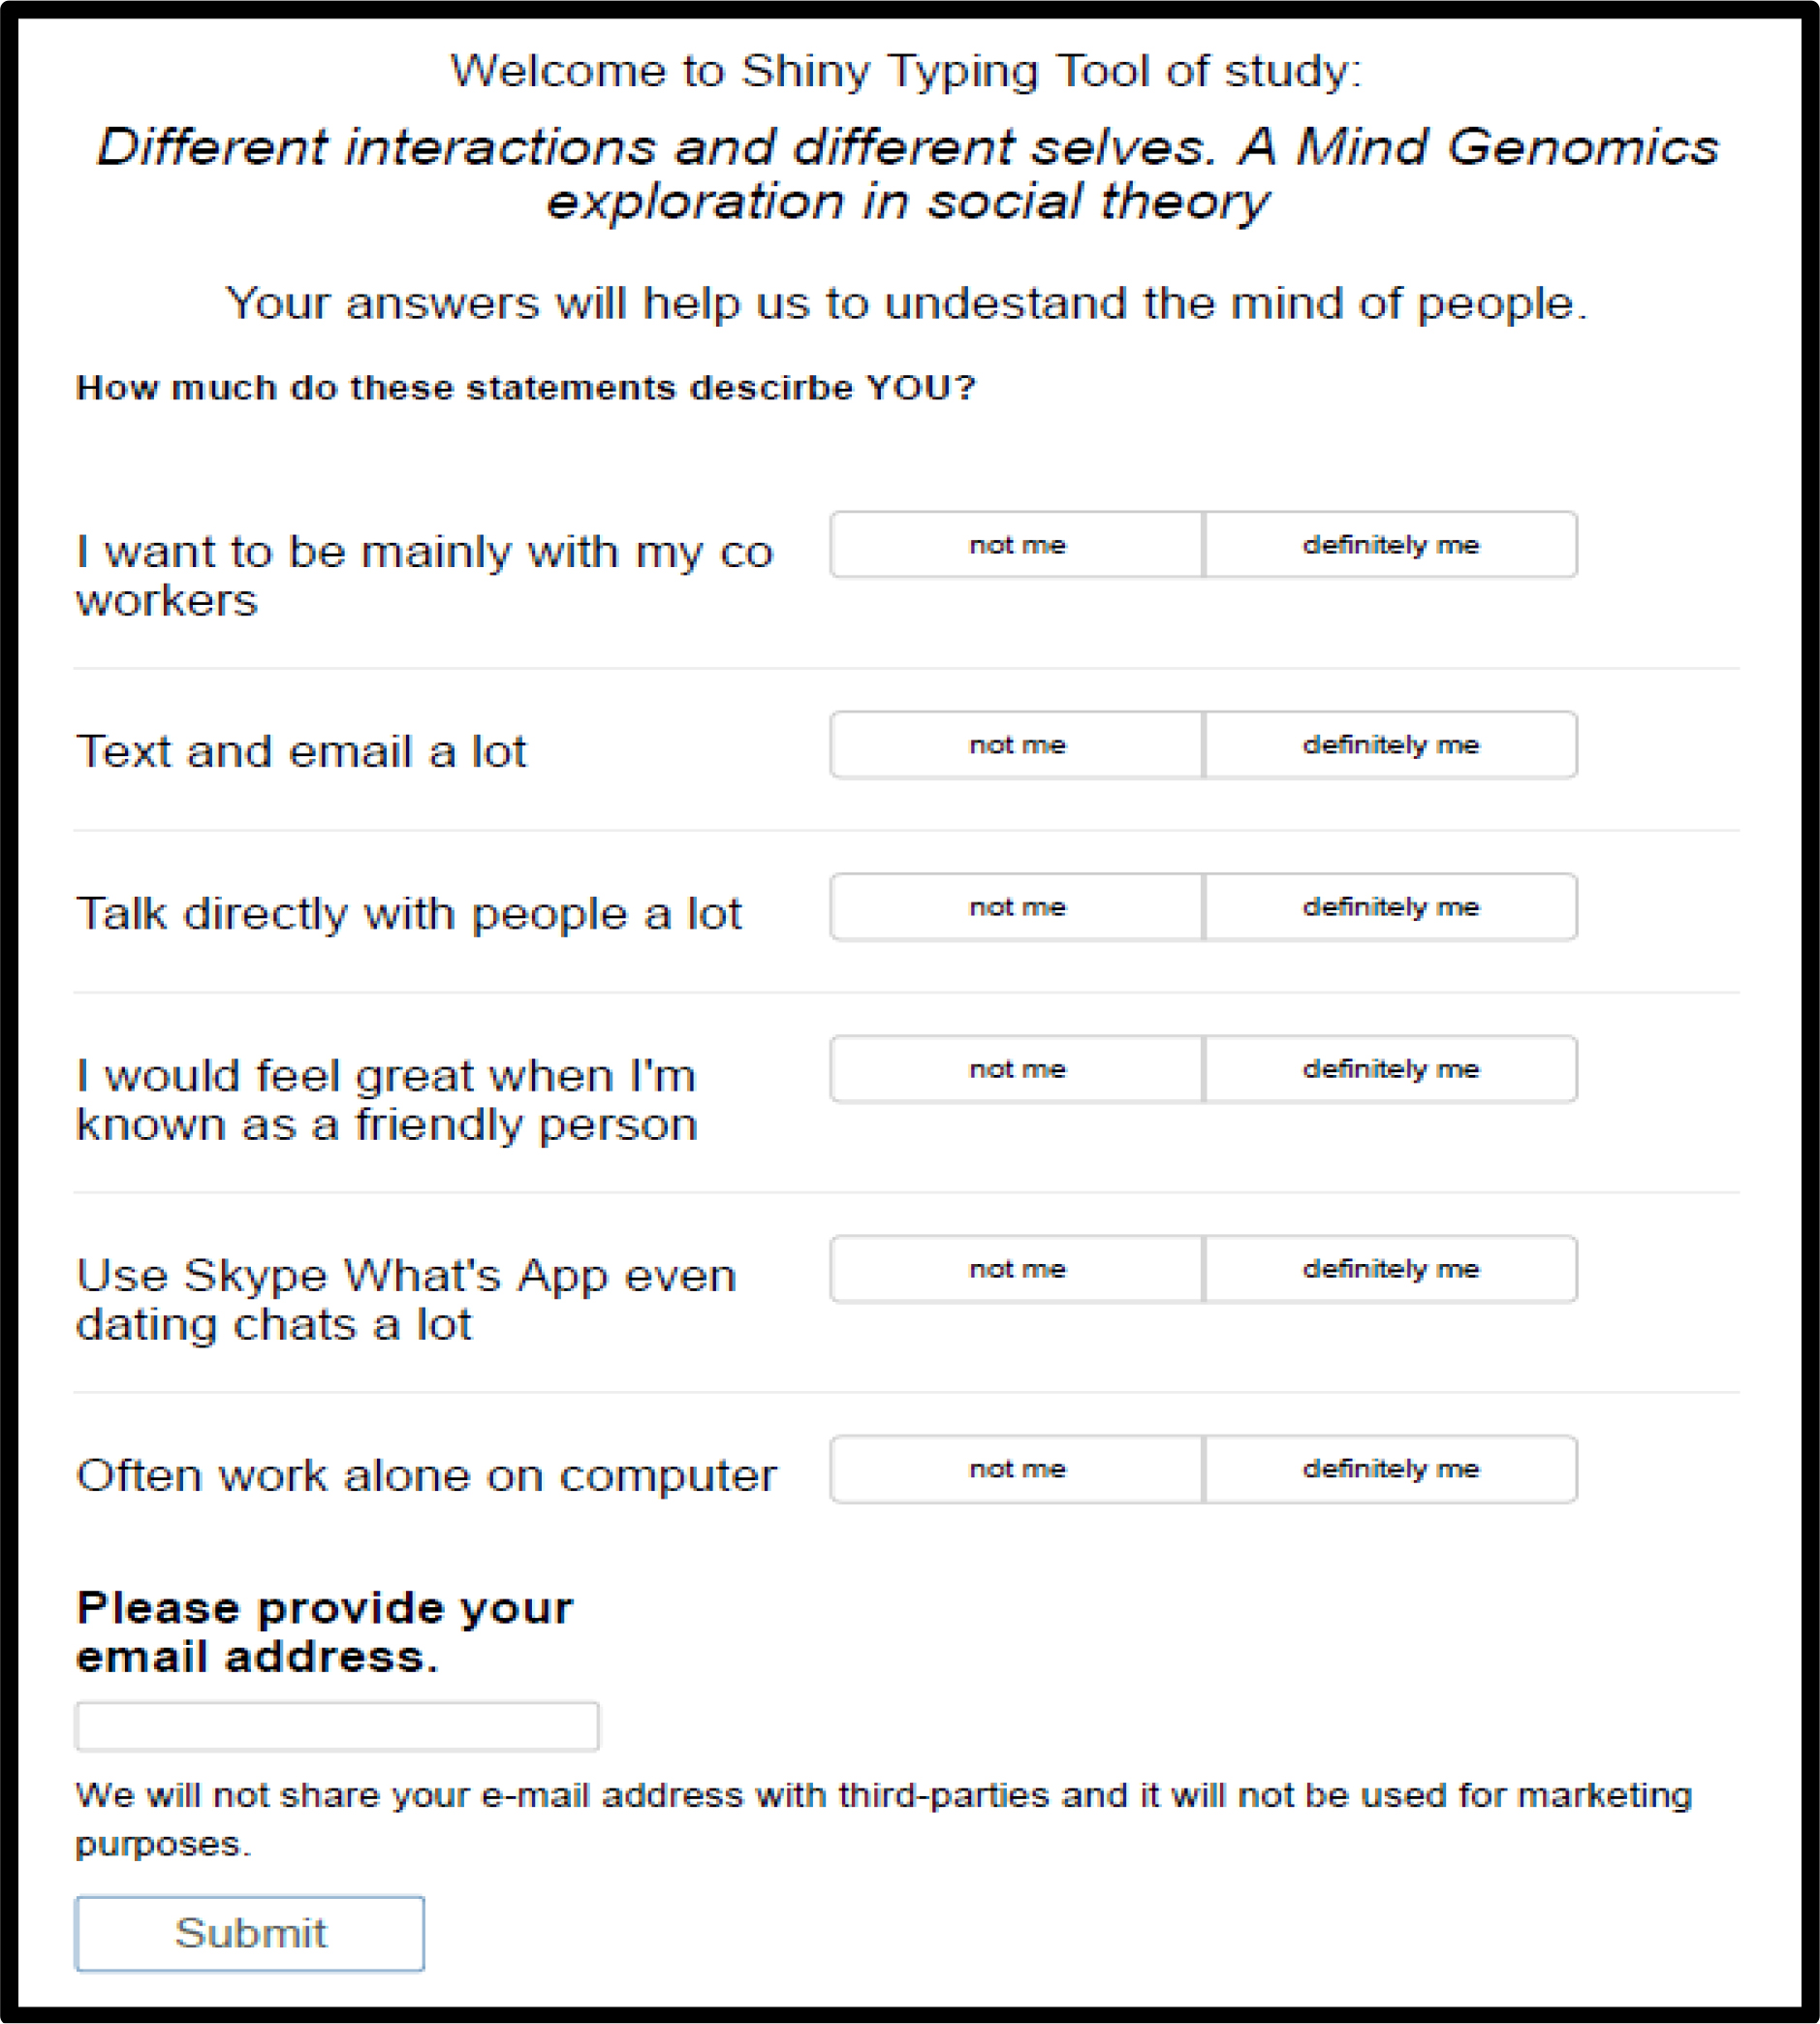
Figure 3. Example of the personal viewpoint identifier, showing the six questions, and the two-point rating scale. The pattern of responses assigns the person to one of the three mind=-sets.
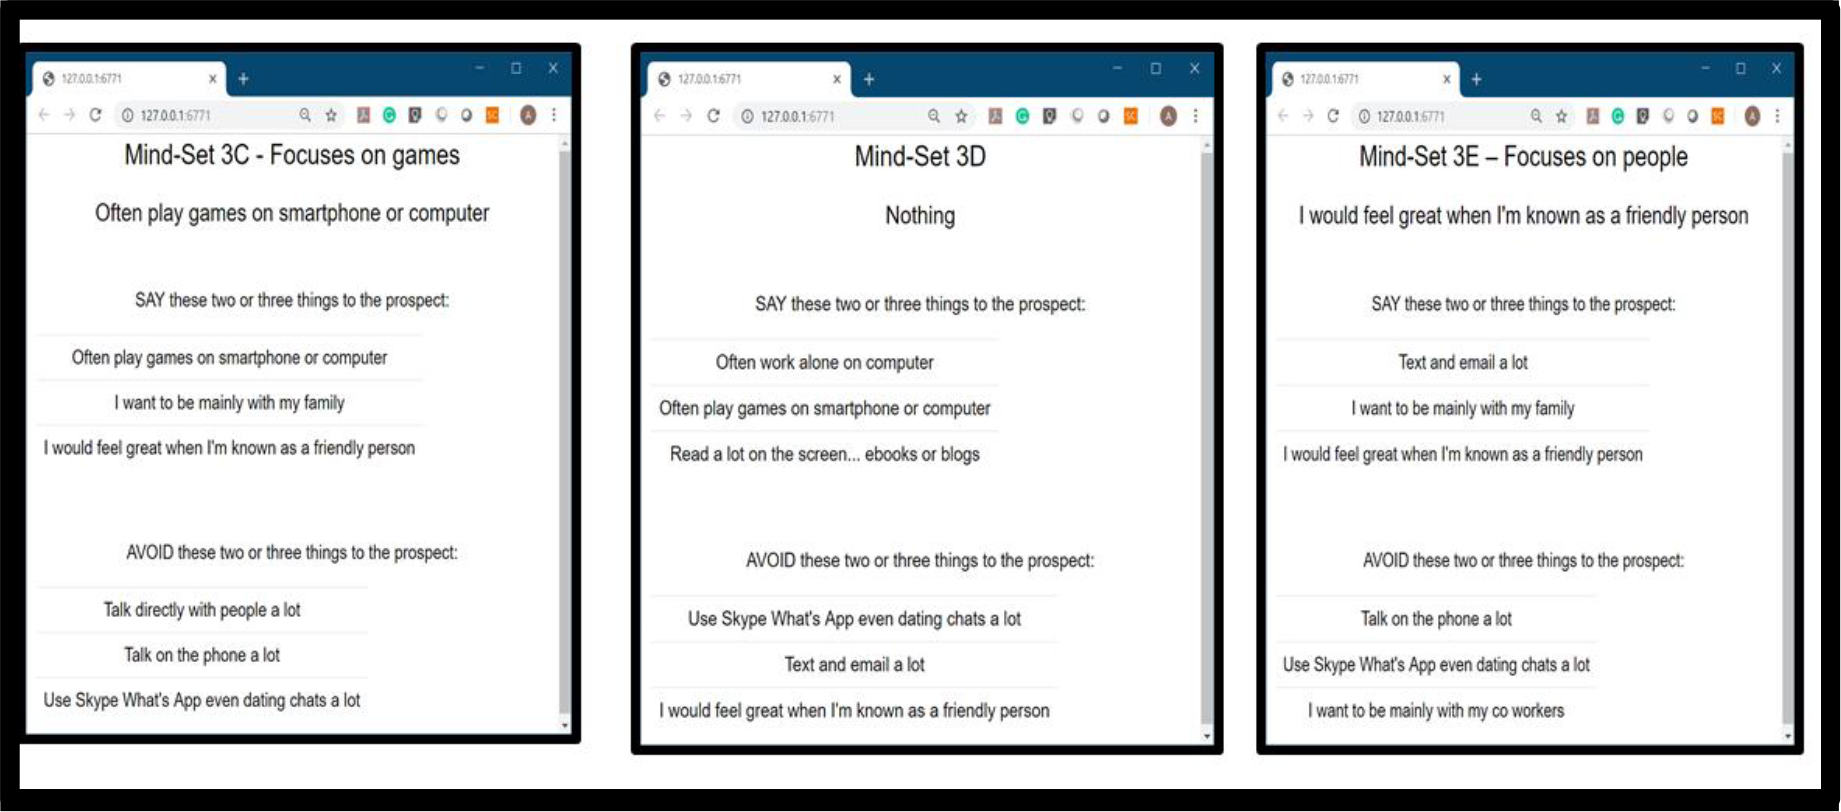
Figure 4. Three feedback pages, showing the mind-set to which the new person belongs, as what to say and what not to say to the respondent.
Beyond EXACTLY ME to LIKE ME, and I APPROVE, respectively
The rating scale was set up to represent a graded scale in two dimensions, with two levels. These two dimensions have been captured in the four remaining scale values. It becomes straightforward to relate the presence/absence of the 16 answers to either ME or APPROVE by eliminating all vignettes with rating 5, and then creating two new dependent variables. The two new dependent variables are ME (defined 100 when the rating is either 2 or 4; defined as 0 when the rating is either 1 or 3) and APPROVE (defined as 100 when the rating is either 2 or 3; defined as 0 when the rating is either 1 or 4).
The foregoing recoding allows us to create two equations for any subgroup. The two dependent variables capture different types of judgments (WHO vs JUDGE). Table 4 shows the coefficients for the two models. In general, respondents say that they can be described as people-oriented (I want to be mainly with my family; I want to enjoy new people A LOT), and most approve of talking on the phone. In other words, people see themselves as social, at least in general.
Table 4. Coefficients of the equations relating the presence/absence of the 16 answers/elements to judgments of ‘Like ME’ and ‘Approve’
|
|
Total Panel |
ME |
APPROVE |
|
|
Additive constant |
43 |
61 |
|
C3 |
I want to be mainly with my family |
10 |
-4 |
|
C4 |
I want to enjoy meeting new people A LOT |
6 |
-1 |
|
|
|
|
|
|
A2 |
Talk on the phone a lot |
-3 |
9 |
|
|
|
|
|
|
A1 |
Talk directly with people a lot |
-1 |
1 |
|
A3 |
Use Skype What’s App even dating chats a lot |
-8 |
0 |
|
A4 |
Text and email a lot |
0 |
-2 |
|
B1 |
Often work alone on computer |
-4 |
-4 |
|
B2 |
Often play games on smartphone or computer |
2 |
-1 |
|
B3 |
Research look up facts, e.g. Google or Siri |
1 |
-5 |
|
B4 |
Read a lot on the screen. e-books or blogs |
1 |
-7 |
|
C1 |
I want to be mainly with my friends |
1 |
-1 |
|
C2 |
I want to be mainly with my co workers |
4 |
1 |
|
D1 |
I would feel great when Ieft alone |
-2 |
-1 |
|
D2 |
I would feel great when I’m known as a friendly person |
4 |
-7 |
|
D3 |
I would feel great when I’m known as successful and well off |
3 |
0 |
|
D4 |
I would feel great when I’m respected |
0 |
-4 |
Response patterns by Age Groups
When we break down the respondents to the three age groups three patterns emerge:
- The youngest respondents (age 15–24) do not find much which resembles them. They approve of being sociable yet also approve of playing games and being left alone. They talk in two different ways, social and alone.
- The middle group of respondents (age 25–39) strongly feel that they are social, talking with people. They give blanket approval to what they read (additive constant 78). They are agreeable.
- The oldest group (age 40+) also describe themselves as both social yet play a lot of games on the computer. They very strongly approve of direct contact with people, either in person or on the phone.
Response patterns by the previously uncovered group of three mind-sets
- Mind-Set 3C (gamers) feel that they are social and like to meet people. They strongly approve of talking on the phone, but that is all.
- Mind-Set 3D (other) feel that they are family oriented. They strongly approve of being social, being considered successful, yet also approve of being alone. They do not use the computer for information.
- Mind-Set 3E (people-oriented) say that they are people-oriented but also say that they like to play games on the computer. They primarily approve of talking on the phone a lot.
- The division of respondents into mind-sets generates mind-sets which overlap. That is, people divide into different groups, but these groups have much in common. This is not surprising, since people are more alike than different, so we are dealing with nuances of difference. In contrast, when we apply the Mind Genomics methods to issues outside personality, such as preferences for the products, such as a line of pasta sauces, we see radical differences, with some people liking spicy products, others liking chunky products, and so forth.
Step 10 – Link Response time to the elements: In the history of experimental psychology, the measurement of response time (also known as reaction time) occupies a venerable place. First suggested by the pioneering experimental psychologist, Wilhelm Wundt [15], response time was thought to signal something about the underlying psychological processes. Long response times were believed to be associated with unknown internal mechanisms, such as consideration of the message, efforts to block the message, and so forth. Often, however, the specific internal mechanisms were not elaborated.
Mind Genomics incorporates the measure of response time in order to assess the degree to which the message ‘engages attention,’ resulting increased processing time, and thus increasing the response time. Once again, the benefit of experimental design at the level of the individual respondent becomes apparent. One can measure the response time to a set of vignettes. Knowing exactly how the vignettes were structured enables one to relate the presence/absence of the individual elements to the response time. The outcome is the estimated number of seconds of response time that can be traced to the presence of the answer or element in the vignette.
The model for response time is the same as that used to relate the binary value of EXACTLY ME to the presence/absence of the 16 answers. The only differences are that the response time now becomes the dependent variable, and there is no additive constant in the equation. The rationale for abandoning the additive constant is that in the absence of answers (elements in the vignette) there is no response, and therefore the dependent variable is always 0.
Table 5. How age groups differ. Coefficients of the equations relating the presence/absence of the 16 answers/elements to judgments of ‘Like ME’ and ‘Approve’.
|
|
|
A15–24 |
A25–39 |
A40+ |
|
A15–24 |
A25–39 |
A40+ |
|
|
|
ME |
|
APPROVE |
||||
|
|
Base Size |
14 |
17 |
19 |
|
14 |
17 |
19 |
|
|
Additive Constant |
58 |
42 |
31 |
|
48 |
78 |
57 |
|
B4 |
Read a lot on the screen. e-books or blogs |
13 |
-11 |
1 |
|
-9 |
-9 |
-5 |
|
C4 |
I want to enjoy meeting new people A LOT |
-10 |
24 |
6 |
|
14 |
-13 |
-6 |
|
C3 |
I want to be mainly with my family |
-7 |
23 |
11 |
|
16 |
-13 |
-10 |
|
C1 |
I want to be mainly with my friends |
-15 |
17 |
2 |
|
16 |
-3 |
-12 |
|
A4 |
Text and email a lot |
0 |
12 |
-6 |
|
-15 |
-6 |
9 |
|
C2 |
I want to be mainly with my co workers |
-2 |
12 |
6 |
|
9 |
0 |
-10 |
|
D2 |
I would feel great when I’m known as a friendly person |
-5 |
8 |
9 |
|
-6 |
-8 |
-6 |
|
A2 |
Talk on the phone a lot |
0 |
7 |
-12 |
|
2 |
0 |
23 |
|
D3 |
I would feel great when I’m known as successful and well off |
-3 |
-9 |
17 |
|
-2 |
-2 |
5 |
|
B2 |
Often play games on smartphone or computer |
-3 |
-7 |
11 |
|
9 |
-1 |
-9 |
|
B3 |
Research look up facts; e.g. Google or Siri |
-5 |
-5 |
8 |
|
-9 |
-17 |
6 |
|
D4 |
I would feel great when I’m respected |
-3 |
0 |
5 |
|
-3 |
-6 |
-6 |
|
D1 |
I would feel great when Ieft alone |
-4 |
-10 |
4 |
|
8 |
4 |
-9 |
|
B1 |
Often work alone on computer |
-16 |
-2 |
1 |
|
3 |
-11 |
-3 |
|
A1 |
Talk directly with people a lot |
-1 |
-1 |
-3 |
|
-13 |
2 |
13 |
|
A3 |
Use Skype What’s App even dating chats a lot |
-3 |
-5 |
-12 |
|
2 |
0 |
0 |
Table 6. How mind-sets different in the pattern of coefficients of the equations relating the presence/absence of the 16 answers/elements to judgments of ‘Like ME’ and ‘Approve’
|
|
|
ME
|
APPROVE
|
||||
|
|
|
MS 3C |
MS 3D |
MS 3E |
MS 3C |
MS 3D |
MS 3E |
|
|
|
Games |
Other |
People |
Games |
Other |
People |
|
|
Additive constant |
51 |
45 |
33 |
59 |
57 |
64 |
|
D2 |
I would feel great when I’m known as a friendly person |
10 |
-2 |
4 |
-7 |
3 |
-16 |
|
D3 |
I would feel great when I’m known as successful and well off |
8 |
-7 |
8 |
-2 |
6 |
-3 |
|
A1 |
Talk directly with people a lot |
6 |
-10 |
-2 |
-5 |
6 |
4 |
|
C4 |
I want to enjoy meeting new people A LOT |
6 |
-7 |
18 |
4 |
6 |
-16 |
|
C3 |
I want to be mainly with my family |
4 |
11 |
14 |
3 |
-7 |
-7 |
|
C2 |
I want to be mainly with my co workers |
5 |
-7 |
14 |
4 |
6 |
-10 |
|
B2 |
Often play games on smartphone or computer |
-1 |
2 |
7 |
-6 |
6 |
0 |
|
C1 |
I want to be mainly with my friends |
-4 |
1 |
6 |
4 |
-4 |
-7 |
|
D4 |
I would feel great when I’m respected |
-2 |
2 |
5 |
-10 |
2 |
-5 |
|
B4 |
Read a lot on the screen. e-books or blogs |
1 |
-1 |
5 |
-12 |
-3 |
-4 |
|
B3 |
Research look up facts e.g. Google or Siri |
5 |
-7 |
4 |
-7 |
-3 |
-4 |
|
D1 |
I would feel great when Ieft alone |
-5 |
-2 |
2 |
-8 |
8 |
2 |
|
B1 |
Often work alone on computer |
-13 |
1 |
1 |
-1 |
-1 |
-6 |
|
A4 |
Text and email a lot |
-5 |
3 |
0 |
-2 |
-2 |
0 |
|
A2 |
Talk on the phone a lot |
-10 |
4 |
-4 |
9 |
5 |
17 |
|
A3 |
Use Skype What’s App even dating chats a lot |
-7 |
-9 |
-10 |
5 |
2 |
-5 |
Table 7 presents the coefficients for the response time model. We look at all 1200 vignettes in the analysis, the 24 vignettes for each of the 50 respondents. The longer the response time, the more the message ‘engages.’ By ‘engages’ we mean the respondent appears to spend MORE TIME reading the answer when the answer is part of the vignette. Engage is not the same as EXACTLY ME, and in fact the two variables do not correlate with each other.
Table 7. Response Time of elements by Total Panel and key subgroups. Response times of 1.5 seconds or longer are shown as cells which are shaded and the response time in bold numbers.
|
|
Response Time (seconds) based upon relating the response time of the vignette to the presence/absence of the answers/elements contained in the vignette |
Tot |
A1524 |
A2539 |
A40+ |
MS3C – Games |
MS3D – Other |
MS3E – People |
|
A1 |
Talk directly with people a lot |
1.1 |
0.5 |
1.4 |
1.2 |
1.3 |
0.3 |
1.6 |
|
A2 |
Talk on the phone a lot |
1.0 |
1.2 |
0.7 |
1.0 |
0.9 |
0.7 |
1.3 |
|
A3 |
Use Skype What’s App even dating chats a lot |
0.7 |
0.8 |
0.5 |
0.7 |
0.5 |
0.5 |
1.0 |
|
A4 |
Text and email a lot |
1.1 |
1.0 |
0.8 |
1.4 |
1.4 |
0.3 |
1.6 |
|
B1 |
Often work alone on computer |
1.0 |
0.5 |
0.9 |
1.3 |
1.3 |
0.7 |
1.0 |
|
B2 |
Often play games on smartphone or computer |
1.1 |
0.8 |
0.8 |
1.6 |
1.6 |
1.1 |
0.6 |
|
B3 |
Research look up facts, e.g. Google or Siri |
1.2 |
1.1 |
0.8 |
1.5 |
1.7 |
1.0 |
0.7 |
|
B4 |
Read a lot on the screen. e-books or blogs |
0.9 |
0.5 |
1.0 |
1.2 |
1.3 |
0.6 |
0.9 |
|
C1 |
I want to be mainly with my friends |
1.2 |
0.5 |
1.1 |
1.7 |
1.6 |
0.5 |
1.4 |
|
C2 |
I want to be mainly with my co workers |
1.3 |
0.7 |
1.1 |
1.8 |
1.5 |
1.0 |
1.3 |
|
C3 |
I want to be mainly with my family |
1.1 |
0.1 |
1.1 |
1.7 |
1.4 |
0.5 |
1.2 |
|
C4 |
I want to enjoy meeting new people A LOT |
1.0 |
0.1 |
0.6 |
1.8 |
1.7 |
0.1 |
1.1 |
|
D1 |
I would feel great when Ieft alone |
1.2 |
0.9 |
0.9 |
1.6 |
1.0 |
1.5 |
1.1 |
|
D2 |
I would feel great when I’m known as a friendly person |
0.9 |
0.3 |
1.0 |
1.5 |
1.1 |
0.5 |
1.4 |
|
D3 |
I would feel great when I’m known as successful and well off |
1.2 |
0.3 |
1.5 |
1.6 |
1.2 |
1.1 |
1.3 |
|
D4 |
I would feel great when I’m respected |
1.0 |
0.2 |
1.0 |
1.6 |
0.6 |
1.1 |
1.4 |
To make it easier to understand the relation between answer/element and response time, we have shaded all cells with response times of 1.5 seconds or longer. There are no norms to guide us in the definition of what is a meaningful ‘engagement response time’ and so we arbitrarily choose a value for a long response time, based upon previous studies. We note here that in many studies of the same sort, but with commercial products rather than personality descriptions, we find response times to be very short. The response times there are often a few tenths of a second for individual answers/messages embedded in the vignette.
The data suggest that there are differences in response time, especially by age, with the older respondents taking longer times to read and make their decisions. It may be that older respondents take a long time to react to the messages, whereas the younger respondents react quite quickly. That is not the only story to emerge, however. What is remarkable about the response time is that the older respondents appear to pay more attention to phrases which talk about their own aspirations as persons. It may well be that some of the conjectures about personality put forward by Mead might be supportable from the behavior of the older people, focusing on interpersonal reactions through their response times.
Here are the key groups, and the elements which ‘engage,’ i.e., which generate long response times.
Total Panel:
Nothing engages
Age 15–24:
Nothing engages
Age 25–39
I would feel great when I’m known as successful and well off
Age 40+
I want to enjoy meeting new people A LOT
I want to be mainly with my co workers
I want to be mainly with my friends
I want to be mainly with my family
Often play games on smartphone or computer
I would feel great when I’m known as successful and well off
I would feel great when Ieft alone
I would feel great when I’m respected
Research look up facts e.g. Google or Siri
I would feel great when I’m known as a friendly person
Mind-Set 3C – Focuses on games
I want to enjoy meeting new people A LOT
Research look up facts, e.g., Google or Siri
I want to be mainly with my friends
Often play games on smartphone or computer
I want to be mainly with my co workers
Mind-Set 3D – Other
I would feel great when Ieft alone
Mind-Set 3E – Focuses on people
Text and email a lot
Talk directly with people a lot
Discussion and Conclusion
The origins of this study come from an attempt to merge a theory of personality (G.H. Mead) with an empirical analysis of how people think of themselves (Mind Genomics.) The ingoing hypothesis was that there would be an age-related change in personality, coming in part from the process of socialization and the way people interact with each other in a world of emerging electronic intermediations. The Mind Genomics data suggest that there are differences in the way people describe themselves, but there does not appear to be a simple age-relation.
Mead’s conjecture about age might, however, play a role in the pattern of response times, the ‘engagement’ time that it takes for a respondent to make a decision. The older respondents appear to pay more attention than do the younger respondents, a pattern that might at first be construed as a simple age difference. There is a deeper aspect to the difference. The gap in the response time differs by the nature of the phrase. The longest response times for those ages 40+ come from phrases which talk about the person and who the person is. Response time, a measure of engagement or time to process the information, may constitute a fertile new area for the understanding of issues of personality. The focus changes from insights based on ratings to insights based on active ‘mental processing.’ The insight is worthy of more investigation to understand how much may be gleaned by a deeper understanding of the dynamics of response time in Mind Genomics when the latter is applied to issues of personality.
Acknowledgement
Attila Gere thanks the support of Premium Postdoctoral Research Program of the Hungarian Academy of Sciences.
References
- Strauss A (1956) “Introduction” in The Social Psychology of George Herbert Mead. Pp. iv-xvi. Chicago: University of Chicago Press.
- Mead GH (2013) [1934]. Mind, Self & Society. Berlin: Heptagon. Kindle Edition
- Carreira da Silva F (2007) G.H. Mead A Critical Introduction. Cambridge, UK: Polity.
- deCerteau M (1984) The Practice of Everyday Life. Berkeley: University of California Press.
- Baudrillard J (1994) Simulacra and Simulation. Ann Arbor: University of Michigan Press
- Cook GA (1993) George Herbert Mead: The Making of a Social Pragmatist. Urbana, IL: University of Illinois Press.
- Green PE, Rao VR (1971) Conjoint measurement for quantifying judgmental data. Journal of marketing research 8: 355–363.
- Green, P.E. & Srinivasan, V., 1990. Conjoint analysis in marketing: new developments with implications for research and practice. The journal of marketing, 54, 3–19.
- Luce, R.D. & Tukey, J.W., 1964. Simultaneous conjoint measurement: A new type of fundamental measurement. Journal of mathematical psychology, 1, 1–27.
- Moskowitz, H.R., Gofman, A., Beckley, J. and Ashman, H., 2006. Founding a new science: Mind genomics. Journal of sensory studies, 21, 266–307.
- Moskowitz, H.R. and Gofman, A., 2007. Selling blue elephants: How to make great products that people want before they even know they want them. Pearson Education.
- Box GE, Hunter WG, Hunter JS (1978) Statistics for experimenters, New York, John Wiley
- Gofman A, Moskowitz H (2010) Isomorphic permuted experimental designs and their application in conjoint analysis. Journal of Sensory Studies 25: 127–145.
- Dubes R, Jain AK (1980) Clustering methodologies in exploratory data analysis. Advances in Computers 19: 113–238.
- Boring EG (1929) A History of Experimental Psychology. The Century Company, NY