Abstract
Raman spectroscopy offers a nondestructive approach to differentiate and characterize sp2– and sp3-bonded carbon. In sp2-rich materials, the defect-activated D band generally appears near 1350 cm-1, whereas the graphite G band occurs near 1580 cm-1. Enhanced graphitic ordering may additionally generate a second-order 2D band near 2700 cm-1. Diamond exhibits a characteristic first-order Raman line at approximately 1332 cm-1, corresponding to the zone-center optical phonons of its sp3-bonded lattice. Band position, linewidth, and relative intensity provide valuable information on bonding configuration, crystallinity, defects, and structural disorder. Mechanical stress shifts Raman bands by altering lattice strain; compressive and tensile stresses generally induce opposite frequency changes, although the precise response depends on crystallographic orientation and bonding structure. Temperature modifies the spectra through phonon anharmonicity and thermal expansion, commonly producing redshift and linewidth broadening as temperature increases. Accordingly, analysis of peak positions, linewidths, and intensity ratios supports assessment of carbon-phase composition, structural quality, stress state, and thermal behavior. Prerequisites are strong reducing conditions.
Keywords
Raman spectroscopy, DLC in herderite, sp2– bonded carbon, sp3– bonded carbon, D band, G band, Reducing conditions, Supercritical fluids
Introduction
During Raman studies of herderite and hydroxylherderite samples, we found that many herderite samples from Namibia contain numerous small black flats (some micrometer thick) over wide areas. Raman studies show that these black, mostly irregularly shaped areas correspond to diamond-like carbon (DLC), but not in the sense of Irmer and Dorner-Reisel (2005) [1]. In industrial applications, DLC is a class of amorphous carbon materials that contain significant amounts of sp³-hybridized carbon atoms, giving it diamond-like hardness, while also incorporating sp² carbon for flexibility and lubricity. The purest form, tetrahedral amorphous carbon (ta-C), consists almost entirely of sp³ bonds, whereas other forms may include hydrogen, different metals, or graphitic carbon depending on the production process. In this context, DLC refers to a carbon-based coating with diamond-like properties, such as high hardness, low friction, and good wear and chemical resistance. A typical Raman spectrum of diamond-like carbon (DLC) shows two broad bands: the D band around 1350 cm⁻¹ associated with disorder and defects in sp²-bonded carbon. The G band is around 1580 cm⁻¹ associated with the stretching of sp² carbon bonds. Diamond-rich material may additionally show a sharp diamond peak near 1332 cm⁻¹, which can overlap with the DLC D band. Because crystallization in nature is fast and more chaotic, the black areas are not expected to occupy very large, undisturbed areas, as in the technique. However, the underlying processes are probably the same. In topaz from the Klein Spitzkoppe, Namibia, similar black areas are also present. They are generally rarer. However, a large part consists of moissanite [SiC], and a smaller part consists of DLC.
Sample and Methods
Herderite [CaBe(PO4]F from Namibia, Erongo Mountains, farm Davib-Ost
Cairncross and Bahmann (2006) [2,3] described the mineral as hydroxylherderite. Thomas (2026) [4] identified the material as herderite using Raman spectroscopy. However, there are water-clear, small areas with a tendency toward hydroxylherderite, particularly at the crystal rims. The herderite sample (about 2 x 1.5 x 0.5 cm) comes from miarolitic cavities in the Erongo Mountains. According to Cairncross and Bahmann (2006) [2,3], herderite is associated with small (less than 2 cm) schorl crystals, muscovite, and orthoclase. A single pocket opened in July 2003 yielded a small amount of the herderite material. Most specimens are thumbnail- to small-cabinet-size clusters composed of individual crystals measuring less than 1 cm. The largest crystal found thus far measures 6.2 cm and is studded by small schorl crystals.
Two different colors of hydroxyl-herderite were described from Erongo: pale green and off-white. X-ray diffraction analysis of crystals of both colors at the University of Johannesburg revealed that they are the same species; the cause of the color difference is not known. While working on herderite samples from the Erongo, the author was surprised to find that many crystals (the white type) contain relatively large DLC aggregates. Figures 1 to 4 show such aggregates as examples. Single diamonds with the same characteristic as the large DLC areas are also present.
Microscopy and Raman Spectroscopy
All microscopic and Raman spectroscopic investigations were conducted using a petrographic polarization microscope (BX 43) equipped with a rotating stage and coupled to an EnSpectr Raman spectrometer R532 (Enhanced Spectrometry, Inc., Mountain View, CA, USA). Measurements were performed in both reflection and transmission modes. All measurements were carried out with the EnSpectr R532. Measurements covered the spectral range from 0 to 4000 cm⁻¹ and were conducted with a single-mode 532 nm laser operating at a maximum output of 50 mW. Analytical settings included a 20 µm entrance aperture, a holographic grating of 1800 g mm⁻¹, and a spectral resolution of approximately 4 cm⁻¹ across the measured range. For most analyses, we used a long-working-distance Olympus LMPlanFL 100× objective, which allows a measuring field about 1 µm in diameter on the sample. Laser power at the sample surface was continuously adjustable down to 0.02 mW. Higher powers, up to 50 mW, were used only for overview measurements. For measurements over the range 0–4000 cm-1, we generally set the laser power to 30 mW at the sample. For minerals located deep under the polished surface, we generally also used 30 mW laser power; however, we used a significantly longer measurement time. We calibrated Raman-band positions before and after each measurement series using the Si band of a semiconductor-grade single-crystal silicon chip. Based on 20 repeated measurements, run-to-run reproducibility was ± 0.2 cm⁻¹ for silicon (520.2 ± 0.2 cm⁻¹) in the range from 0 to 2000 cm⁻¹. As a second reference, we used a water-clear diamond crystal from Brazil. We measured the first-order diamond line at 1333.4 ± 0.6 cm⁻¹, with a FWHM of 5.1 ± 0.1 cm⁻¹ (see also Solin and Ramdas, 1970) [5]. FWHM is the full width at half maximum. However, scrutiny of the Brazil diamond shows small heterogeneities (different ¹³C content).
Results
During the determination of the fluorine content of hydroxylherderite/herderite [4], we observed many irregular black areas (for example, Figures 1 to 4). Examination with Raman spectroscopy indicated diamond-like carbon (DLC). Figure 5 shows such a Raman spectrum from DLC. Crystalline diamond and graphite show very low FWHM values (~5 cm-1), opposite to DLC.
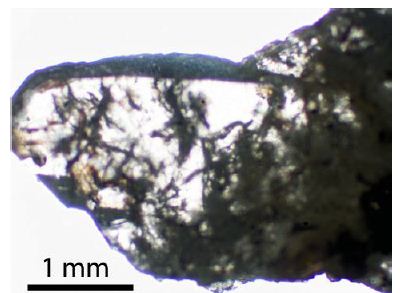
Figure 1: Herderite (white) fragment from a miarolitic cavity from Namibia. The black parts are DLC-like material. Light brown parts are hydroxylherderite.
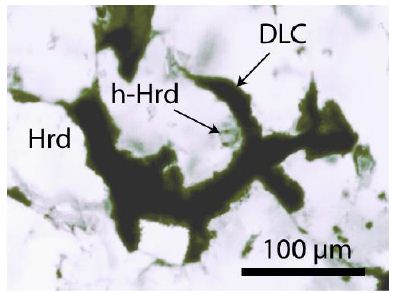
Figure 2: Herderite (Hrd) with DLC and small hydroxylherderite (h-Hrd) from Namibia.
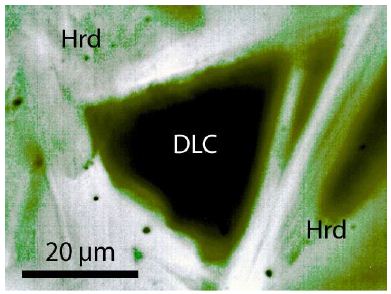
Figure 3: Diamond-like carbon (DLC) aggregate in herderite (Hrd) from Namibia.
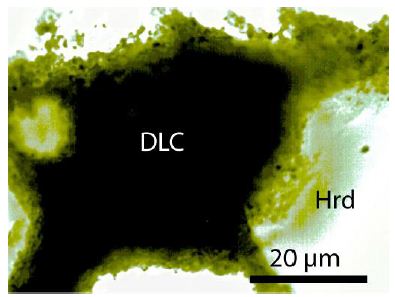
Figure 4: DLC in herderite (Hrd) from Namibia.
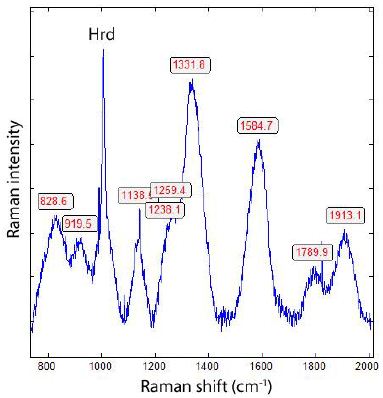
Figure 5a: Raman spectrum of diamond-like carbon (DLC) in herderite from Namibia. Hrd – herderite from the matrix.
This spectrum (Figure 5b) shows a broad diamond line at 1328.2 cm-1; broad carbon D-lines at 1357.1 and 1379.7 cm-1 with FWHM = 28.3 and 46.3 cm-1; and a broad G-band at about 1585 cm-1. Figure 5b is an example of the decomposition of the first-order region of the Raman spectrum of DLC. The diamond band at 1328.2 cm-1 has a FWHM of 46.9 cm-1, and the G-band has two components at 1567.3 and 1594.1 cm-1 with FWHMs of 65.2 and 53.2 cm-1, respectively.
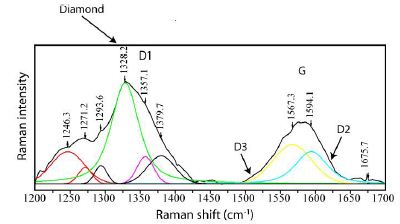
Figure 5b: Decomposition of a DLC Raman spectrum. D1 at about 1350 cm-1 is typical for poorly ordered carbons. The same applies to the D2 and D3 bands. The G-band, or graphite band, occurs at 1580 cm-1. Laser heating causes a partial shift downward to 1567 cm-1 [6]. According to Zaitsev (2001) [7], the band around 1567 cm-1 is typical for low-quality CVD diamond films.
To confirm whether the black material is real DCL, we recorded Raman spectra in the first-order range using different laser powers (5 to 50 mW). We found a “plateau-like” range (15-35 mW) with a more or less identical position of the diamond line at ≤ 1324 cm-1 (see Figure 6). Across the entire laser-energy range, the diamond-line position forms a sigmoid curve, probably produced by the interaction of sp2 and sp3 species in different carbon phases diamond, carbon, amorphous carbon).
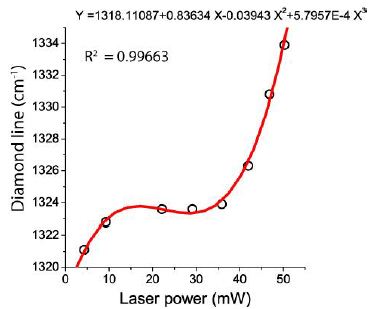
Figure 6: Shift of the diamond line of first order with the laser power on the DLC in the herderite sample from Namibia.
The sigmoid trend shows that the position of the first-order diamond line depends nonlinearly on the applied laser power. The line position changes most strongly within an intermediate power range and tends toward a limiting value at higher power, indicating a saturation-like response. The power-dependent shift of the first-order diamond Raman line is attributed primarily to laser-induced heating. sp²- rich regions may enhance laser absorption and facilitate heat transfer to the diamond phase. The sigmoid response suggests a nonlinear, saturating thermal process, possibly caused by changes in absorption and heat dissipation as the local temperature increases. Further temperature calibration or comparison with samples having different sp² contents would be required to confirm this mechanism. Natural diamond crystals (e.g., the reference diamond from Brazil) show a nearby linear course from 4.3 to 50 mW: 1333.4 ± 0.6 cm-1, differ strongly from DLC in herderite from Namibia. The lonsdaleite-like carbon from fluorite from Zinnwald [8] shows a clear linear decline of the 1312 cm-1 line from 4.3 to 1296.8 at 50 mW laser power on the sample. Figure 7 shows the Raman shift of the first-order diamond line as a function of the used laser energy [9,10].
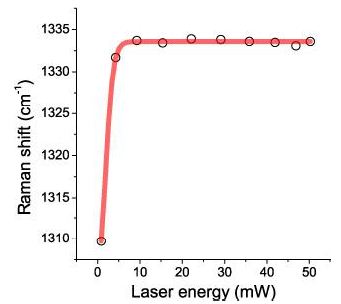
Figure 7: Raman shift (cm-1) versus laser (532 nm) energy (mW) obtained using the Brazil reference diamond. The sigmoid (Boltzmann) fit starts at 1302.5 cm-1, 0.8 mW and ends at 1333.6 cm-1 and 50 mW. The correlation coefficient is R2 = 0.99914.
Discussion
Raman spectroscopy responds differently to sp2– and sp3-bonded carbon: sp2 carbon produces strong, broad Raman features. The G band appears near 1580 cm-1 and is associated with in-plane stretching of sp2 bonds. The D band appears near 1350 cm-1 and indicates disorder, defects, or finite-sized sp2 clusters. The sp3 carbon in crystalline diamond. produces a sharp first-order Raman line near 1332 cm-1. In amorphous or DLC materials, sp3 bonding usually does not produce a distinct peak; instead, it affects the position, width, and intensity of the broad D and G bands. For DLC, the Raman spectrum is therefore mainly used to analyze the sp2 network. The ID/IG intensity ratio, along with the G-band position and width, can indicate changes in disorder and sp2/sp3 bonding. However, Raman alone does not provide a fully reliable quantitative sp3 concentration; techniques such as XPS, EELS, or NEXAFS are often used to confirm it [9,10].
Conclusion
In conclusion, Raman spectroscopy effectively distinguishes sp2-and sp3-bonded carbon by identifying their characteristic vibration features. In diamond, the dominant signature is a sharp line near 1332 cm-1, corresponding to the ordered sp3-bonded crystal lattice. DLC, by contrast, generally exhibits broader D and G bands: the D band is associated with disordered or defect-rich carbon structures, while the G band reflects graphitic sp2 binding. Temperature can broaden, shift, or reduce the intensity of these features by increasing phonon interactions and promoting structural rearrangement, whereas Raman spectroscopy provides a sensitive means of distinguishing sp2-and sp3-bonded carbon and evaluating their structural environments. In sp2-rich carbon, the characteristic G band, typically near 1580 cm-1, arises from in-plane bond-stretching vibrations of graphitic carbon, whereas the defect-activated D-band, commonly near 1350 cm-1, reflects disorder, finite crystallite size, and defects. In sp3-bonded diamond, the Raman spectrum is dominated by the first-order line near 1332 cm-1, corresponding to the zone-center optical phonon. This line is highly responsive to external conditions: increasing temperature generally causes phonon softening, producing a shift toward lower wavenumber and often linewidth broadening, while compressive stress shifts the line upward and tensile stress shifts it downward. The magnitude and direction of the shift therefore provide information about the thermal and mechanical state of the diamond lattice. Together, the relative intensities and positions of the sp2 G and D bands and the diamond Raman line enable assessment of bonding configuration, structural disorder, temperature, and stress in carbon-based materials. Mechanical stress commonly shifts the Raman peaks and may alter their widths. Thus, the position, intensity, and shape of the D, G, and diamond-related bands provide a practical means of evaluating bonding configuration, disorder, crystallinity, and environmental effects in carbon-based materials. The presence of DLC in pegmatitic herderite suggests that strong reducing conditions are a prerequisite for its formation. The input of supercritical fluids is therefore probable.
References
- Irmer G, Dorner-Reisel A (2005) Micro-Raman studies on DNC Advanced Engineering Materials 7: 694-705.
- Cairncross B, Bahmann U (2006) Famous mineral localities: the Erongo Mountains The Mineralogical Record 37: 361-470.
- Cairncross B (2005) Klein Spitzkoppe The Mineralogical Record 36: 317-335.
- Thomas R (2026) Remarks on herderite [CaBe(PO4)F] and hydroxylherderite [CaBe(PO4)(OH)]. Geology, Earth and Marine Sciences 8: 1-4.
- Solin SA, Ramdas AK (1970) Raman spectrum of Physical Review B 1: 1687-1698.
- Beyssac O, Goffe C, Chopin C, Rouzaud JN (2002) Raman spectra of carbonaceous material in metasediments: a new geothermometer. Metamorphic Geol 20: 859-871.
- Zaitsev AM (2001) Optical Properties of Diamond – A Data Berlin, Heidelberg, New York. Springer. Pg: 502.
- Thomas R, Trinkler M (2024) Monocrystalline lonsdaleite in REE-rich fluorite from Sadisdorf and Zinnwald/E-Erzgebirge, GEMS 6: 1-5.
- Lafuente B, Downs RT, Yang H, Stone N (2015) The power of databases: the RRUFF In: Armbruster T, Danisi RM (eds). Highlights in Mineralogical Crystallography. Berlin, Germany, Walter de Gruyter: 1-30.
- Thomas R (1982) Ergebnisse der thermobarogeochemischen Untersuchungen an Flüssigkeitseinschlüssen in Mineralen der postmagmatischen Zinn-Wolfram. Mineralisation der Freiberger Forschungshefte FFH C 370. Pg: 85.