Abstract
Pegmatite quard from the Variscan tin deposit of Ehrenfriedersdorf (Germany) preserves exceptional records of melt–fluid interaction near the critical point of a pseudo binary silicate melt–water system. Based on more than four decades of melt and fluid-inclusion studies, this work demonstrates that major and trace elements exhibit systematic enrichment maxima at the solvus crest, commonly expressed as Lorendian concentration distributions. These distributions reflect critical state behavior characterized by vanishing phase boundaries, enhanced diffusion, and maximum solubility. Extreme enrichments of elements such as Sn, Be, P, Li, B, Nb, and Ta, as well as the formation of rare phosphate minerals including arrojadite, are interpreted as products of transient supercritical melt–water conditions, locally influenced by mantle derived supercritical fluids or melts.
Keywords
Pegmatite, Melt inclusions, Supercritical melt–fluid system, Critical point (solvus), Lorentzian element enrichment, Tin mineralization, Phosphorus enrichment, Variscan Erzgebirge
Introduction
Pegmatite quartz from the tin deposit Ehrenfriedersdorf [1] contains key information on the formation of this tin-rich region. Over more than 40 years, the author studied samples from different locations there (Greifenstein granite, Sauberg mine, and others) and, with different coauthors, developed methods for the adequate study of present-day fluids, melts, and mineral inclusions. Very important steps were the development of methods to homogenize the unusually frequent melt inclusions under pressure to prevent decrepitation and water loss by diffusion. That was also an important step and a prerequisite for developing adequate analytical methods to study tiny inclusions with diameters of 10-20 µm and up to 100-200 µm. The first important samples I collected at that time were in the Sauberg mine near Ehrenfriedersdorf [2]. A stronger impulse for this work resulted from another mine exploration in 1984 in the same mine on the occasion of the completion of the joint project “Isotopic and element-geochemical as well as radio-geochronological investigations of the Ehrenfriedersdorf tin deposit” [3]. Gerhard Strauch from ZfI Leipzig call me attention to a pegmatite body in the deposit. I take a couple of samples with me to study the fluid and melt inclusions. To my surprise, the sample was extremely rich in melt inclusions (I called the sample Qu8). At that time, the necessary tools for a successful study of volatile-rich melt inclusions had not yet been developed [4]. Together with many coauthors, the author of this contribution developed analytical and experimental methods using the target-sample Qu8 [5-14]. An important methodological step was first the construction of solvus curves: water concentration in melt inclusions versus the trapping temperature [15], and later the correlating of main and trace elements in the melt inclusions with their water content, starting with the work on Be-daughter minerals in fluid and melt inclusions [16]. Later, we demonstrate that for pegmatite-derived solvus curves (in the coordinates water concentration in the melt versus the trapping temperature), about 20 different elements also correlate directly, mostly in the form of Lorentzian curves [17,18]. The number of such elements is probably open. The Lorentzian distribution of important elements as a function of melt water content was a novelty in geochemistry. We interpreted this correlation as resulting from the interaction of mantle-derived supercritical fluids (SCF) or supercritical melts (SCM) with crustal rocks, because we found in the affected minerals often high-pressure and high-temperature relicts (diamond, lonsdaleite, moissanite, coesite, orthorhombic cassiterite, and others [4,19,20]. Note: The involvement of SCF/SCM phases should therefore be interpreted as a consistent and plausible mechanism, not as a uniquely demonstrated source. Also, the Lorentzian distributions should therefore be regarded here as strong indicators of near-critical behavior rather than as standalone proof. Further studies show that isotopes of elements (e.g., boron, carbon, hydrogen-deuterium), which have in part a strong relationship with water, are highly prone to strong fractionation [21,22].
Key Observation
Starting with the water determination using Raman spectroscopy of melt inclusions in granites and pegmatites [15,23-25], it must be emphasized that the early-stage solvus curves for pegmatites are of fundamental significance for subsequent studies, as they have also been demonstrated for boron [26].
At this time, trace element data from the corresponding melt inclusions were relatively rare and yielded only unsatisfactory correlations. Therefore, an important step was the developing of analytical tools for the determination of elements and trace elements of the corresponding melt inclusions. At the beginning, only the microprobes SX50 and SX100 at the GFZ Potsdam and the SIMS in Woods Hole are available. After careful calibration of the microprobes by Dieter Rhede (GFZ Potsdam), we were able, besides the standard element, to determine boron and beryllium in the melt inclusions. Important was also the development of Raman spectroscopy for qualitative and quantitative analytical purposes, especially for the determination of water in melt inclusions – even under the sample surface [10]. At this time, we also began using the SYXRF-microprobe at DESY Hamburg (Thomas et al. 1995) [27] intensively, which was further improved by Rickerts et al. (2006) [10]. With this broad instrumentarium, we could, year after year, obtain a large amount of analytical data on melt inclusions in granites and pegmatites. An important result is the correlation between the rehomogenization temperature and the bulk water concentration in the melt inclusions. The first nearby complete solvus curve was already published by Thomas et al. (1999) [24]. An important prerequisite for the construction of such solvus curves was obtained from work on melt inclusions using the Stokes-Einstein equation to determine the viscosity and water content of melt inclusions at the homogenization temperature [28]. To produce reproducible values over 25 years, a constant homogenization time of 20 hours was generally used. Longer times for the re-homogenization of melt inclusions lead to significant diffusion losses of water and fluorine [24]. Figure 1 shows such a simplified solvus curve for pegmatites of the Ehrenfriedersdorf region. If we add boron oxide (B2O3) to water in the melt inclusion, the critical point shifts to 27.7% (H2O + B2O3). From that, a significant improvement results: an increase in the R2 value from 0.98995 to 0.99985 and the standard deviation from 9.44 to 2.19. It is also possible that some further element affects the solvus curve of the Ehrenfriedersdorf pegmatite. These are, for example, Rb and Sb [28].
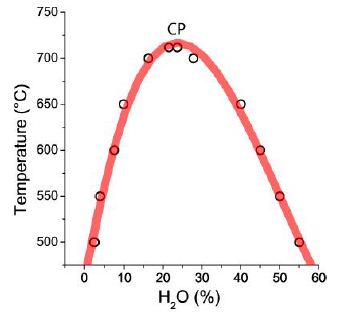
Figure 1: Solvus curve (polynom of third degree) for the Ehrenfriedersdorf pegmatite (simplified). Each point is the mean of more than 100 measurements. CP is the critical point (23.6 % H2O, 712°C). r2 is 0.98995, and the standard-deviation is 9.4.
The solvus curve is the basis for further relationships with other elements. Starting with the distribution of tin versus the water concentration (Figure 2), beryllium shows, in contrast to Sn, a more complex Lorentzian distribution, composed of two overlapping Lorentzian components established by two different Be-species: beryllonite [NaBePO4] and hambergite [ Be2BO3(OH, F)] – see Thomas et al., 2022) [18]. That is also a clear hint that the solvus curve near the solvus crest is relatively flat and not a single point, but a small range. A distribution similar to that of tin is also observed for phosphorus (Figure 3).
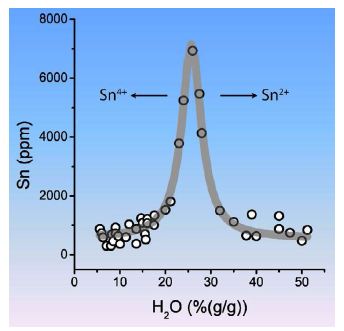
Figure 2: Lorentzian distribution of tin versus the water concentration of the corresponding solvus curve. The arrows indicate the tendency of Sn speciation.
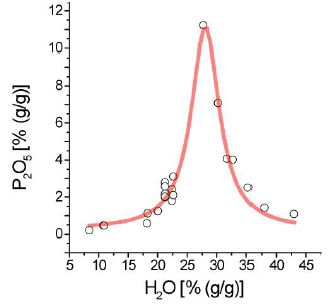
Figure 3: Lorentzian distribution of phosphorus versus the solvus water content.
Similar distribution curves result for about 11 elements (Table 1), so, for example, for a typical main element, phosphorus of the Variscan Ehrenfriedersdorf tin deposit. Besides high P concentration in melt inclusions in the pegmatite quartz, there are also many different P-rich minerals as inclusions, often as needles. As examples, we call here arrojadite, berlinite, herderite (with 11.65 % F), and hydroxylherderite. Arrojadite (see Figure 4a and b) has never been reported from the Variscan Ehrenfriedersdorf tin deposit to date, although this mineral is not rare there. Here, we will give a picture of such a crystal and a Raman spectrum.
Table 1: Fitting parameters for element distributions in the range of the critical point of the pseudo-binary melt-water (solvus) system.
|
Element/compound |
Distribution | Area ppm2 | Center [% H2O] | Width [% H2O] | Offset [ppm] | Height [ppm] |
| Li | Lorentzian | 273330 | 25.1 | 6.5 | 1363 |
26,660 |
|
Be |
Lorentzian | 131560 | 26.5 | 10.1 | 132 | 11,600 |
| B | Lorentzian | 217240 | 30.0 | 3.5 | 9993 |
39,718 |
|
Zn |
Gaussian | 217240 | 26.7 | 2.4 | 390 | 43,220 |
| Sn | Lorentzian | 54207 | 25.6 | 4.8 | 503 |
6,865 |
|
Cs |
Lorentzian | 266000 | 26.0 | 5.6 | 1300 | 28,000 |
| Ta | Lorentzian | 50148 | 27.4 | 9.9 | 86 |
3,236 |
|
WO3 |
Gaussian | 73258 | 26.8 | 7.5 | 558 | 47,626 |
| P | Lorentzian | 560320 | 28.5 | 5.8 | 1300 |
61,000 |
|
Cl |
Lorentzian | 147040 | 26.4 | 4.0 | 116 | 16,800 |
| As | Lorentzian | 46433 | 30.1 | 3.2 | 520 |
9,464 |
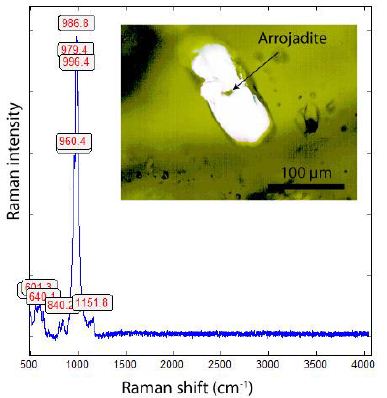
Figure 4a: Arrojadite in pegmatite quartz (Qu8) – Raman spectrum and micro-photograph.
Figure 4b shows another Raman spectrum of arrojadite [KNa4Ca(Fe2+, Mn2+)14Al(PO4)12(OH)2] in the same sample. According to Anthony et al. (2000) [29], arrojadite is a high-temperature (~800°C) primary mineral in granite pegmatite. Opposite to many small (Königshain) or large (Volyn) pegmatites, the pegmatite from the Sauberg mine near Ehrenfriedersdorf shows a very large number of different melt inclusions with different, sometimes exotic daughter minerals (forming a solvus curve) and countless small mineral inclusions from which only a small number are identified by microprobe or Raman spectroscopy. To the so-called system-relevant minerals of the tin deposit, HT-HP minerals are brought by supercritical fluids (SCF) or supercritical melts (SCM) from mantle depths, indicating that supercritical phases make a non-negligible contribution. In addition, such HT-HP minerals also formed on the spot under strong reducing conditions (whiskers of graphite, diamond, lonsdaleite, moissanite) – see, for example, (Thomas 2026) [20] or by shock events.
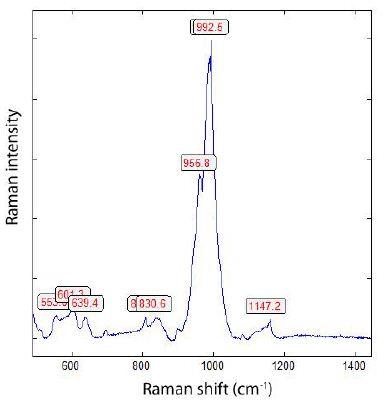
Figure 4b: Another Raman spectrum of arrojadite in pegmatite quartz (Qu8) from the Sauberg mine (Ehrenfriedersdorf).
Phosphorus is present in melt inclusions in pegmatite quartz from the Variscan tin mineralization of Ehrenfriedersdorf and is also well Lorentzian-distributed (Figure 4). Berlinite is often a daughter mineral in large melt inclusions [5]. The P2O5 content reaches about 7 % in melt inclusions, although the P-content in paragenetic feldspar is not higher than 1 %. Phosphorus is a relatively common element in melt inclusions and solid mineral inclusions in pegmatite quartz. In the sample Qu8, we found a remarkable, extremely P-rich inclusion with 50.7 ± 3.5 % P2O5 [5]. The components SiO2 (10.5 ± 2.2 %), Al2O3 (36.2 ± 1.6 %), and FeO (0.24 ± 0.06 %) are mainly contained in the Si-Al-glass phase, which means that the central “bubble” consist from nearly pure P2O5, which is an absolute novum and under normal geochemical conditions unthinkable in nature. Also, the small bubbles consist mainly of P2O5. The composition was determined with the microprobe SX50 at the GFZ Potsdam. During the acquisition of trace element data with SIMS in Woods Hole (J.D. Webster), the sample was destroyed during cleaning with distilled water. Here, the important point is that, for the formation of nearly pure P2O5 in a complex natural melt-water system, unusual conditions must be present (Figure 5).
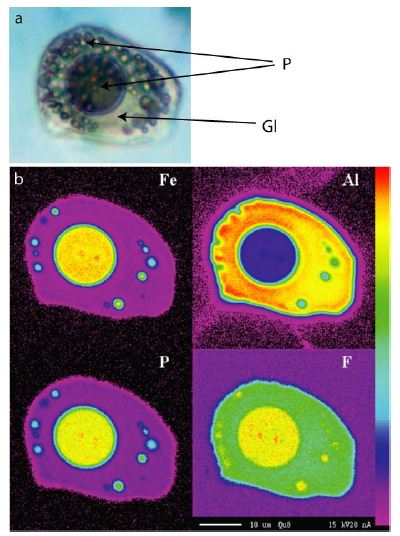
Figure 5: Phosphorus-rich melt inclusion in pegmatite quartz (Qu8). The figure a) shows the inclusion after rehomogenization (P – P2O5 globules, Gl – silicate glass), and plate b) shows the distribution of Fe, Al, P, and F presented. Al is mainly distributed in the silicate melt, while Fe, P, and F are distributed in the bubble-like part.
The most extreme melt inclusion compositions, such as near-pure P2O5 domains, represent rare boundary cases rather than modal system behavior. These inclusions define the upper solubility envelope attainable near the critical window, but they do not characterize average melt compositions. Such distributions (Figure 2, 3, 8, and data in Table 1) can be integrated into a standardized diagram using reduced coordinates (Figure 6) for all studied elements.
In Thomas et al. (2019 [17] and 2022 [18], some important elements are tabulated for the Ehrenfriedersdorf pegmatite system (besides many other pegmatites) and used to build Figure 6 and the shortened Table 1 for the Ehrenfriedersdorf case.
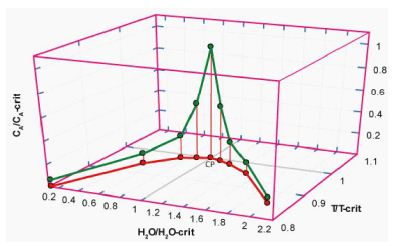
Figure 6: Combined and generalized solvus and Lorentzian curves in the reduced coordinates: X: water concentration divided by the water concentration at the critical point CP; Y: element concentration divided by the corresponding concentration at the critical point; Z: reduced temperature (temperature divided by the critical temperature CP (see also Thomas and Rericha, 2024) [30].
Table 1 shows the fitting parameters for the corresponding elements (including new ones) for the Ehrenfriedersdorf case.
The mean (center) of all 11 elements is 27.2 ± 1.6% H2O. That means at least the solvus crest is not a point, but a small range in reality. Table 1 shows two cases (Zn, WO3) where the data are Gaussian distributed (Zn and WO3). Maybe the data number is too small. Figure 7 shows a melt inclusion in pegmatite quartz Qu8 (partially homogenized) with a large sphalerite daughter crystal. Such inclusions are not rare.
Figure 7 shows a typical melt inclusion (with an attached fluid inclusion) containing a relatively large brown sphalerite crystal (Sp) with more than 60,000 ppm Zn and about 30,000 ppm S (see Roedder (1984 [31]), Figure 4-1), which would transform the Gaussian into a Lorentzian distribution. Furthermore, for sulfur, a similar distribution is to be expected (i.e., increasing the number of elements follows the Lorenzian distribution). From Figure 6, followed clearly that the Lorentzian element distribution curves are related to the corresponding solvus curve – they (solvus and Lorentzian curves) are not independent, they are together related. That is an important result of the longstanding studies on silicate melt inclusions in mostly pegmatite quartz from the Ehrenfriedersdorf region. An important question arises: Is the three-dimensional representation (Figure 6) real? Or can these presentation simplificated into the two coordinates water content versus temperature, and can the element concentration at the solvus crest be transformed into temperature values? However, that temperature is, in general, the maximum solubility of the element and cannot be determined exactly, because many measurements at melt inclusions representing the critical point are necessary.
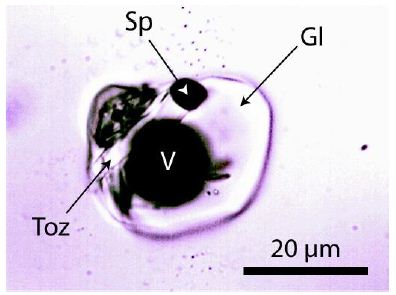
Figure 7: Melt inclusion in pegmatite quartz with a sphalerite daughter crystal (Sp). Gl – silicate glass, Toz – topaz, V – vapor phase.
Interpretation
The Meaning of the Critical Point (CP) at the Solvus Crest
At the critical point of a pseudo-binary solvus, the following statements are crucial:
- The silicate melt and the aqueous fluid become compositionally
- The system approaches a supercritical melt-water
- The density contrast and the interfacial tension approach
- The diffusion coefficients increase to extremely high
- The dynamic viscosity goes to extremely low
In other words, the system temporarily loses the sharp boundary between “melt” and “fluid”.
Far from the critical point, the element partition is different between the melt and the fluid. And the solubility is limited by phase boundaries and surface energy. Near the critical point, the element partition coefficients approach unity. Elements that normally prefer either a melt or a fluid can occupy the same continuous phase. The solubility maxima are reached. A typical example is Be (Figure 8).
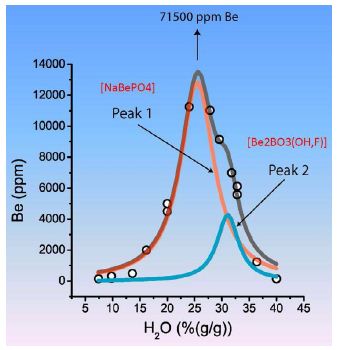
Figure 8: Distribution of Be in melt inclusions in pegmatite quartz from Ehrenfriedersdorf (see further above). It is here that at the solvus crest with the shown maximum at about 12,840 ppm Be is topped by a large daughter crystal of beryllonite [NaBePO4] in such a melt inclusion of the same sample corresponding to 71,500 ppm Be.
If we look at Table 1, it is striking that the solvus crest moves in very small limits: 27.2 ± 1.6 % H2O. In summary, element concentrations are highest at the critical point of a pseudo-binary melt-water solvus because phase boundaries vanish, solubility and diffusion reach maxima, and critical thermodynamic fluctuations allow extreme but transient enrichment that can be preserved upon quenching.
Small changes in temperature or composition can cause large changes in density, creating strong local concentration fluctuations. Elements with complexation tendencies (Be, Li, B, Sn, Nb, Ta, REE, etc.) are especially affected. Pegmatites are essentially the natural geological expression of what happens when a granite melt-water system (with extra input of water or water-rich melts by SCFs or SCMs) parks near the critical point of a pseudo-binary solvus for a prolonged time.
A key observation from pegmatite melt inclusions is that near the critical point, Lorentzian curves may degenerate into near-vertical lines (see Figure 8), controlled by the maximum solubility of the element (here Be) in the supercritical melt-water system. A nice example of a slightly different origin is the existence of graphite-like globules in silicate melt inclusions (Figure 9).
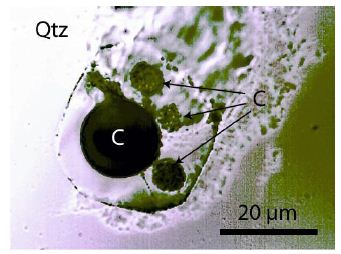
Figure 9: Carbon and graphite-like carbon (C) in a melt inclusion in pegmatite quartz (Qtz) from the Sauberg mine (sample Qu8). All black points are carbon. The larger ones contain nanodiamonds or diamond-like carbon (DLC).
That example is the trapping of micro-crystals suspended in the supercritical melt phase (SCM). The carbon and DLC here are not formed at the trapping site. A similar case shows Figure 10.
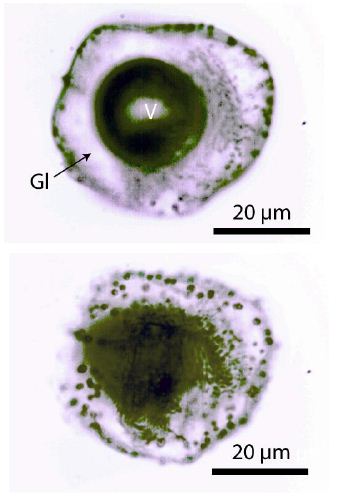
Figure 10: Melt inclusion in pegmatite quartz with suspended small carbon globules (black). Gl – silicate glass, V – vapor phase. The under photomicrograph shows a deeper look into the inclusion and significant mor carbon globules. The vapor phase is methane and hydrocarbon-rich.
Figures 9 and 10 clearly demonstrate that supercritical melts (SCM) from the deep mantle intrude into the pegmatite-forming melt and add water and water-rich melts, as well as carbon and DLC. According to Thomas (2026), the SCF and/or SCM may be responsible for the initial formation of larger pegmatite bodies within the Variscan tin deposit.
Why are most elements in melt inclusions at the critical point Lorentzian distributed, and why are Lorentzian peaks centered on the solvus crest (see Figure 6)?
- Element concentration maxima align precisely with the solvus crest.
- The offset of the Lorentzian curve corresponds to equilibrium (Clarke-level) concentration.
- The height and width measure the strength and duration of critical enrichment.
This tight geometric coupling between solvus geometry and Lorentzian statistics has been documented repeatedly in pegmatites [17,18,31]. Importantly, Lorentzian distributions are not mathematical conveniences. The encode real physics. The Lorentzian feature has, in our case, the following physical meaning:
- Sharp central peak – near-equilibrium background
- Heavy tails – critical enrichment
- Divergent variance – scale-free
- Vertical asymptote – maximum solubility
Lorentzian element distributions are typical near criticality because diverging correlation lengths, flattened chemical-potential landscapes, and transport-dominated non-equilibrium behavior produce scale-free, heavy-tailed concentration fluctuations that Gaussian statistics cannot describe.
Melts far from criticality (normal melts, equilibrium systems) are characterized by
- Fluctuations are small, local, and independent.
- Many random contributions add up.
- The central limit theorem applies
Therefore, the Gaussian distribution dominates. However, near criticality, the situation is different:
- Fluctuations become large, long-range, and correlated.
- There is no characteristic length or time scale.
- Rare but extreme events dominate the statisctics.
Therefore, the Lorentzian (heavy-tailed) distribution emerges. Meaning, the correlation length goes to infinity, composition, density, and speciation fluctuations extend over large volumes, and local chemical environments are no longer independent. As a result, the variance formally diverges, the system no longer has a well-defined “mean + small noise”, and the Gaussian statistics become invalid.
Lorentzian element distributions are typical near criticality because diverging correlation lengths, flattened chemical-potential landscape, and transport-dominated non-equilibrium behavior produce scale-free, heavy-tailed concentration fluctuations that Gaussian statistics cannot describe.
What Happens with the Supercritical System at Further Cooling?
Upon further cooling below the solvus crest, the supercritical melt–water system becomes thermodynamically unstable and separates into a two-phase assemblage consisting of a silicate melt and an aqueous fluid. The disappearance of the supercritical state is accompanied by the rapid re-establishment of density contrast, interfacial tension, and sharply reduced diffusion coefficients. As a result, melt–fluid immiscibility sets in abruptly. Elements that were homogenized in the supercritical state – where partition coefficients approach unity – are forced to repartition between melt and fluid as cooling proceeds. Because cooling in pegmatitic systems commonly outpaces diffusive re-equilibration, extreme and transient element enrichments generated near the critical point cannot fully relax to equilibrium. Instead, they become preserved by quenching, crystallization, and the entrapment of melt and fluid inclusions. This process effectively “freezes in” the chemical signature of criticality. Maximum solubilities attained at the solvus crest are converted into discrete mineral phases or highly enriched residual melts, explaining the coexistence of extreme element concentrations in melt inclusions and abundant rare-element minerals in pegmatites. Farther from the critical point, the system returns to normal magmatic–hydrothermal behavior characterized by Gaussian statistics and equilibrium partitioning.
Pegmatites thus represent the geological record of granite melt–water systems that hovered near the solvus crest and then cooled just fast enough to preserve critical-state chemistry. Further cooling transforms the supercritical melt–water system into a two-phase melt + fluid system, triggers rapid immiscibility, and locks in extreme, transient enrichments through quenching and crystallization. Pegmatites thus represent the geological record of systems that hovered near the solvus crest and then cooled just fast enough to preserve critical-state chemistry. The high number of small minerals, mostly trapped in quartz, demonstrates that at the transition from the supercritical to the undercritical state, we have local oversaturation of elements that form the basis for the crystallization of many, often very rare, however system-relevant, minerals, such as arrojadite, berlinite, beryllonite, hambergite, herderite, sassolite, and many others. So, the Sauberg pegmatite is a Cockaigne for mineral hunters. Besides such minerals, we have often observed untypical HT-HP minerals, such as diamond, lonsdaleite, coesite, orthorhombic cassiterite, and others, which demonstrate that they are added by supercritical fluids (SCF) or supercritical melts (SCM) from mantle depths [20,32]. However, graphite is a common mineral in the Variscan tin deposit Ehrenfriedersdorf. Obviously, we have four types of graphite-like stuff: (i) introduced by SCF or SCM, (ii) formed on the spot by strongly reducing conditions [33], forming whiskers of graphite, diamond-like carbon (DLC), and moissanite in quartz and beryl [20,34-36] or (iii) formed via a natural chemical vapor (CVD) process, and (iv) by a shock event.
Conclusion and Outlook
The recognition that pegmatites record prolonged residence near the critical point of granite–water systems has implications well beyond the Ehrenfriedersdorf case. It provides a unifying physical framework linking pegmatite textures, extreme trace-element enrichments, and the formation of rare-element minerals to critical-state melt–fluid behavior rather than to purely fractional crystallization or late hydrothermal overprinting. Lorentzian enrichment patterns emerge as diagnostic fingerprints of criticality, providing a transferable criterion for identifying supercritical processes in other granitic, pegmatitic, and even magmatic–hydrothermal systems worldwide. More broadly, these findings emphasize the importance of transient, non-equilibrium states in crustal differentiation, suggesting that critical phenomena play a fundamental role in concentrating economically and mineralogically significant elements during the evolution of continental crust. Future work should focus on strengthening the quantitative and comparative framework of critical-state interpretations in pegmatite systems. A priority is the systematic application of model-comparison statistics (e.g., Gaussian vs. Lorentzian vs. Voigt fits – see Thomas and Rericha, 2026) [28] to larger datasets, allowing the statistical robustness of heavy-tailed distributions to be assessed independently of visual inspection. Equally important is the extension of the reduced-coordinate approach to other granite-pegmatite provinces. Demonstrating that solvus-centered Lorentzian enrichment is reproducible across different tectonic settings, melt compositions, and volatile regimes would decisively establish critical-state behavior as a general process rather than a local peculiarity of the Ehrenfriedersdorf system. From a process perspective, coupling melt inclusion observations with diffusion kinetic and cooling rate constraints would further clarify how extreme enrichments generated near the critical window are preserved during rapid immiscibility and crystallization. Even order-of-magnitude kinetic estimates would significantly narrow the range of permissible evolutionary paths. Finally, the recognition of Lorentzian enrichment patterns as signatures of transient non-equilibrium states opens new perspectives for economic geology. If critical windows systematically maximize element solubility and mobility, they may represent a fundamental control on rare-metal fertility in granitic systems. Future studies integrating melt inclusions, mineral chemistry, and isotopic tracers may therefore transform critical-state analysis into a predictive tool for pegmatite- and granite-related mineralization.
Acknowledgment
This paper is dedicated to my teachers at the Mining Academy Freiberg in mineralogy, geochemistry, and ore deposits, Prof. Hans Jürgen Rösler (1920-2009) and Prof. Ludwig Baumann (1929-2008), as well as Prof. James D. Webster from the AMNH in New York, for his strong interest in the genesis of the tin deposit Ehrenfriedersdorf.
References
- Hösel G (1994) Das Zinnerz-Lagerst ättengebiet Ehrenfriedersdorf/Erzgebirge. Pg: 195.
- Thomas R, Baumann L (1980) Ergebnisse von thermometrischen und kryometrischen Untersuchungen an Kassiteriten des Zeitschrift für geologische Wissenschaften 8: 1281-1299.
- Schütze H, Stiehl G, Wetzel K, Beuge P, Haberlandt R, et (1983) Isotopen-und elementgeochemische sowie radiogeochronologische Untersuchungen an der Zinnlagerstätte Ehrenfriedersdorf. Akademie der Wissenschaften der DDR, Zentralinstitut für Isotopen- und Strahlenforschung Leipzig, ZfI-Mitteilungen, Nr. 76: 232-271.
- Thomas R (2024a) Vom Schmelzeinschluss zum superkritischen Fluid – Ergebnisse und Folgen der Befahrung der Grube Sauberg bei Ehrenfriedersdorf. Veröffentlichungen Museums für Naturkunde Chemnitz 47: 59-66.
- Thomas R, Webster JD, Rhede D (1998) Strong phosphorus enrichment in a pegmatite-forming Acta Universitatis Carolinae – Geologica 42: 150-164.
- Webster JD, Thomas R, Veksler I, Rhede D, Seltmann R, Förster H-J (1998) Late-stage processes in P- or F-rich granitic magmas. Acta Universitatis Carolinae – Geologica 42: 181-188.
- Veksler, IV, Thomas R (2002) An experimental study of B-, P- and F-rich synthetic granite pegmatite at 1 and 0.2 GPa. Contribution Mineral Petrol 143: 673-683.
- Veksler IV, Thomas R, Wirth R (2003) Crystallization of AlPO4-SiO2 solid solutions from granitic melt and implications for P-rich melt inclusions in pegmatitic quartz. American Mineralogist 88: 1724-1730.
- Thomas R, Förster H-J, Heinrich W (2003) The behaviour of boron in a peraluminous granite-pegmatite system and associated hydrothermal solutions: a melt and fluid-inclusion study. Contrib Mineral Petrol 144: 457-472.
- Rickers K, Thomas R, Heinrich W (2006) The behavior of trace elements during the chemical evolution of the H2O-, B-, and F-rich granite-pegmatite-hydtothermal system at Ehrenfriedersdorf, Germany: a SXRF study of melt and fluid Mineralium deposita 41: 229-245.
- Thomas R, Kamenetsky VS, Davidson P (2006) Laser Raman spectroscopic measurements of water in unexposed glass inclusions (2006). American Mineralogist 91: 467-470.
- Romer RL, Thomas R, Stein HJ, Rhede D (2007) Dating multiple overprinting Sn-mineralized granites – examples from the Erzgebirge, Mineral Deposita 42: 337-359.
- Borisova AY, Thomas R, Salvi S, Candaudap F, Lanzanova A, Chmeleff J (2012) Tin and associated metal and metalloid geochemistry by femtosecond LA-ICP-QMS microanalysis of pegmatite-leucogranite melt and fluid inclusions: new evidence for melt-melt-fluid Mineralogical Magazine 76: 91-113.
- Hurai V, Huraiová M, Slobodník M, Thomas R (2015) Geofluids – Development in Microthermometry, Spectroscopy, Thermodynamics, and Stable Isotopes. Elsevier. Pg:489.
- Thomas R (2000) Determination of water contents of granite melt inclusions by confocal laser Raman microprobe American Mineralogist 85: 868-872.
- Thomas R, Webster JD, Davidson P (2011) Be-daughter minerals in fluid and melt inclusions: implications for the enrichment of Be in granite-pegmatite Contrib Mineral Petrol 161: 483-495.
- Thomas R, Davidson P, Appel K (2019) The enhanced element enrichment in the supercritical states of granite-pegmatite systems. Acta Geoichim 38: 335-349.
- Thomas R, Davidson P, Rericha A, Voznyak DK (2022) Water-rich melt inclusions as “frozen” samples of the supercritical state in granites and pegmatites reveal extreme element enrichment resulting under non-equilibrium Mineralogical Journal (Ukraine) 44: 3-15.
- Thomas R (2024b) The CaCl2-to-rutile phase transition in SnO2 from high to low pressure in Geol Earth Mar Sci 6: 1-4.
- Thomas R (2026) Precede high-pressure, high-temperature mineralization in the Variscan tin deposit Ehrenfriedersdorf/Germany. Geol Earth Mar Sci 8: 1-6.
- Thomas R (2024c) 13C-rich diamond in a pegmatite from Rønne, Bornholm Island: Proofs for the interaction between mantle and crust. Geol Earth Mar Sci 6: 1-3.
- Thomas R (2025) Raman spectroscopy of boroc acid daughter crystals with different B-isotopes: H3 11BO3 and H3 10BO3 , and different hydrogen and deuterium concentrations. Geol Earth Mar Sci 7: 1-3.
- Thomas R, Davidson P (2012) The application of Raman spectroscopy in the study of fluid and melt inclusions. Z. dt. Ges.. Geowiss 163: 113-126.
- Thomas R, Webster JD, Heinrich W (1999) Melt inclusions in pegmatite quartz: Complete miscibility between silicate melts and hydrous fluids?. Terra Nostra 99: 305-307.
- Thomas R, Webster JD, Rhede D, Seifert W, Rickers K, Förster H-J, Heinrich W, Davidson P (2006) The transition from peraluminous to peralkaline granitic melts: Evidence from melt inclusions and accessory minerals. Lithos 91: 137-146.
- Thomas R (2002) Determination of the H3BO3 concentration in fluid and melt inclusions in granite pegmatites by laser Raman microprobe American Mineralogist 87: 56-68.
- Thomas R, Klemm W, Haller M, Knöchel A, Radtke M (1995) First results on melt inclusions in geological samples using SYXRF-microprobe. Hamburger Synchrotronstrahlungslabor HASYLAB am Deutschen Elektronen-Synchrotron Jahresbericht II 961-962.
- Thomas R, Rericha A (2026) From the granite-pegmatite solvus curves to extreme element enrichment indicated by Gaussian, Lorentzian, and Voigt Geol Earth Mar Sci 8: 1-6.
- Anthony JW, Bideaux RA, Bledh KW, Nichols MC (2000) Handbook of Mineralogy, Volume IV – Arsenate, Phosphates, Tucson, Arizona. Pg: 680.
- Thomas R, Rericha A (2024) Meaning of supercritical fluids in pegmatite formation and critical-element Geol Earth Mar Sci 6: 1-5.
- Thomas R (2025) Interpretation of the Lorentzian distribution of tin in the Variscan Ehrenfriedersdorf deposit/Germany. Geol Earth Sci 7: 1-5.
- Thomas R, Davidson P, Rericha A, Recknagel U (2023a) Ultrahigh-pressure mineral inclusions in a crustal granite: Evidence for a novel Transcrustal transport Geoscience 13: 1-13.
- Thomas R, Webster JD (2000) String tin enrichment in a pegmatite-forming Mineralium Deposita 35: 570-582.
- Thomas R, Recknagel U, Rericha (2023b) A moissanite-diamond-graphite paragenesis in a small beryl-quartz vein related to the Variscan tin-mineralization of the Ehrenfriedersdorf deposit, Germany. Geosciences 13: 1-13.
- Thomas R (1994) Estimation of the viscosity and the water content of silicate melts from melt inclusion Eur J Mineral 6: 511-535.
- Thomas R, Webster JD, Heinrich W (2000) Melt inclusions in pegmatite quartz: complete miscibility between silicate melts and hydrous fluids at low Contrib Mineral Petrol 139: 394-401.