Abstract
Starting with the determination of the Raman spectra of synthetic boric acid and deuterated boric acid and using the two boric acid lines that show a linear correlation between 10B and 11B, we estimate the boron isotope composition of the silicate melt and the coexisting fluid phase on two examples: a hydrothermal diamond anvil cell (HADAC) experiment and the Elba pegmatite. Using the graphic pegmatite from the Elba Island/Italy, we show that the fluid and melt are strongly enriched in boron and cesium, as well as a relatively high deuterium concentration of melt inclusions trapped in the immediate vicinity of the critical point of the solvus. These results support the idea that supercritical fluids have a significant effect on the pegmatite formation in the upper crust.
Keywords
Raman spectroscopy, Boric acid, Deuterated boric acid, Pegmatites, Elba Island/Italy
Introduction
The study of melt inclusions in minerals, mainly quartz, from pegmatites has provided significant insights into the formation conditions of pegmatites. This information includes data on temperature, pressure, and the composition of the mineral-forming melts. Essential data are the primary water content in the melt. In recent years, increasing amounts of information have prompted a rethink of the origin of water [1]. The author and his coauthors have collected numerous proofs for these new ideas [2,3]. The first ideas on the meaning of solvus curves for pegmatite formation date back to the first presentation of water determination in melt inclusions in a pegmatite from the Ehrenfriedersdorf tin-tungsten deposit in the Central Erzgebirge/Germany [4-6]. In Thomas et al. (2003) [2], the role of boron in the formation of solvus curves is described. New results for boron in the Elba granite pegmatite (Elba Island/Italy) are in Thomas 2025a and 2025b [7,8]. In this contribution, we will show, using new observations on boron and heavy water, that supercritical fluids make a significant contribution to pegmatite formation in the upper crust. So far, we have found many indications that supercritical fluids from the deep mantle are carriers of minerals untypical of the upper crust and their pegmatites. Among such minerals are coesite, boron, diamond, moissanite, orthorhombic cassiterite, stishovite, and many others. Here, we show that the composition of boric acid (B-isotopes and hydrogen substitution by deuterium) provides a further crucial hint for the origin of water during pegmatite formation.
Methods and Samples
Methods
Generally, we used boron acid-bearing fluids and melt inclusions in pegmatite quartz from Elba Island. It means fluid- and melt- inclusion with sassolite [H3BO3] daughter crystals. However, boron is primarily in silicate melt inclusions dissolved in the oxide form. Over time, boron from that melt migrates into the water-rich bubbles that form during cooling, forming later well-crystalized solid boric acid and, sometimes, metaboric acid. Solid boric acid (sassolite) crystals are easy to identify under crossed Nicols under the transmission light by their peculiar interference color. To select suitable samples, we used a transmission polarization microscope (JenaLab Pol). All Raman spectroscopic studies are performed with a petrographic polarization microscope (BX 43) equipped with an XY- or rotating stage, coupled to the EnSpectr Raman spectrometer R532 (Enhanced Spectrometry, Inc., Mountain View, CA, USA) in transmission. The Raman spectra were recorded in the spectral range of 0–4000 cm-1 using the 30 mW of a single-mode 532 nm laser, an entrance aperture of 20 µm, a holographic grating of 1800 g/mm, and a spectral resolution of 4 cm-1.
Hydrothermal Diamond Anvil Cell Experiments
For the first test of isotope fractionation, we used an HDAC experiment conducted in 2002 [9]. Synthetic pegmatite glass with 5.0 % nB2O and destilled water, which we used for the experiment, was heated to 840°C at 0.4 GPa. At this temperature, a homogeneous water-rich glass formed, and on cooling, this homogeneous phase separated into two phases: a homogeneous glass with some dissolved boron and a water-rich phase with small amounts of boric acid, with a ratio of about 1: 1. Also, a small number of fluid bubbles appear on cooling. Over about 22 years in these bubbles, boric acid crystallized. These crystals should provide an initial indication of boron isotope fractionation. Figure 1 shows the sample chamber after the experiment.
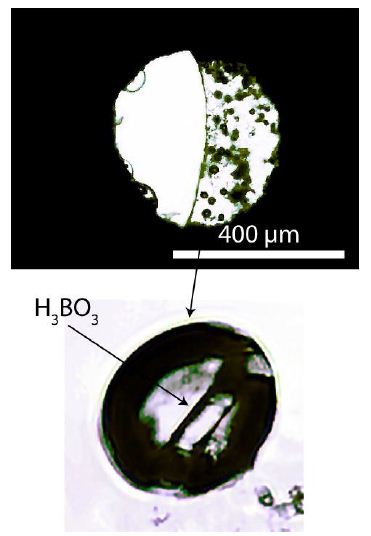
Figure 1: The upper picture shows the sample chamber formed by the diamond anvils and the Re-gasket in between, with a hole of 400 µm. The melt, with some bubbles and a concave meniscus, is on the right side of the chamber. Smaller glass bubbles hem the left side of the chamber. The lower picture shows a boric acid crystal in a fluid bubble in the pegmatite glass.
Homogenization Experiments
To homogenize the melt inclusions, we used two techniques: (i) the cold-seal pressure vessel homogenization experiments and (ii) the hydrothermal rapid-quench homogenization experiments. Further details are available in the electronic supplemental material to Thomas et al. (2009 and 2016) [10,11] as well as in the most cited papers by Thomas and Thomas et al.
Boron Determination in Silicate Class
Boron was analyzed with the Cameca SX-50 microprobe, equipped with the PC2 pseudo-crystal for light elements, with a counting time of 300s, 10 kV, and 40 nA, using an anti-contamination cold trap cooled by liquid nitrogen [9]. The boron determination of silicate glass or boric acid in the melt and in fluid inclusions deep under the sample surface was performed by Raman spectroscopy [12,13].
Experimental Section
Boric acid (H3 nBO3 ), H3 10BO3 , H3 11BO3 and the Deuterated H3 nBO3
The samples and the preparation of the deuterated boric acid are described in Thomas (2025a and 2025b) [7,8]. Table 1 shows the results of Raman measurements on deuterated boric acid (minor corrected).
Table 1: Important Raman band of solid H3BO3, H2DBO3, HD2BO3, and D3BO3.
|
H3BO3 |
H2DBO3 | HD2BO3 | D3BO3 |
| 75.4 ± 1.5 | 103.3 ± 1.3 | 116.6 ± 0.6 |
128.8 ± 2.2 |
|
119.1 ± 3.8 |
|||
| 207.8 ± 1.6 |
|
||
|
499.3 ± 1.0 |
484.5 ± 2.6 | 471.9 ± 1.7 | 466.2 ± 1.0 |
| 879.0 ± 1.9 | 854.0 ± 0.6 | 835.5 ± 1.7 |
817.6 ± 4.7 |
|
1092.0 ± 7.2 |
|||
| 1158.9 ± 2.2 | 1201.9 ± 6.2 | 1305.8 ± 5.4 |
1386.6 ± 3.2 |
|
1383.5 ± 6.3 |
|||
| 2384.7 ± 4.5 | 2406.8 ± 2.5 | 2416.7 ± 2.7 |
2432.0 ± 2.3 |
|
3173.6 ± 4.2 |
3211.0 ± 2.8 | 3235.9 ± 7.7 | 3254.9 ± 4.3 |
| 3249.6 ± 4.2 |
|
Figures 2 and 3 represent typical Raman spectra of deuterated boric acid. The main phases of simple deuteriation are H2DBO3 and HD2BO3. However, the pure phases of H3BO3 and D3BO3 are present too.
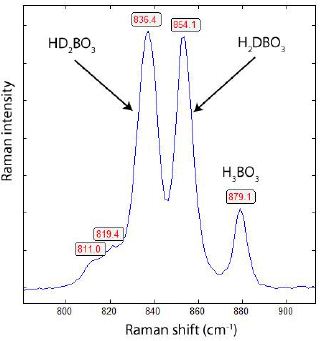
Figure 2: Raman spectrum of HD2BO3 -H2DBO3 -H3BO3
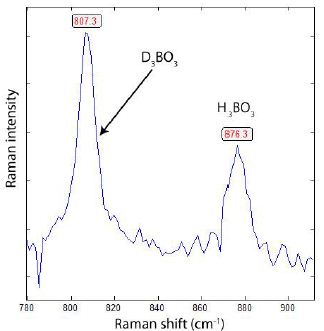
Figure 3: Raman spectrum of a solid mixture of D3BO3-H3BO3.
Table 2 shows the two Raman bands that can be used for the concentration determination of boron isotopes. The 1066 cm-1 band is influenced by deuterium; the 1384 cm-1 band is not.
Table 2: Raman lines of B-isotopes of solid boric acid with the most substantial differences, determined with the 532 nm laser (20 measurements each).
|
B-isotopes |
Raman bands (cm-1) | |
| 11B | 1165.8 ± 0.3 |
1380.8 ± 0.9 |
|
nB |
1166.6 ± 2.7 | 1383.5 ± 6.3 |
| 10B | 1171.6 ± 0.4 |
1411.9 ± 0.6 |
n – refers to boron of natural abundance with 19.78% 10B and 80.22 % 11B. The significant standard deviation for nB results from the isotope fractionation during preparation.
For the first test, we used the silicate glass with fluid bubbles, shown in Figure 1, formed during the cooling of the HDAC experiment. After a long time, boric acid crystallized out in such bubbles.
Graphic Pegmatite Sample from Elba Island/Italy
The sample is from the Mining Academy of Freiberg. It’s a small graphic granite sample from Prato alla Valle, located 400 m south of the cemetery of the village San Piero in Campo on the Island of Elba. A detailed description of paragenesis and the melt and fluid inclusions is in Thomas et al. (2008). For the study presented here, we used quartz chips approximately 300 µm thick, polished on both sides. All quartz chips contain melt and fluid inclusions with relatively large boric acid (sassolite) [H3BO3] daughter crystals, making the sample suitable for in situ isotope studies. Figure 4 shows such a melt inclusion, 17 years after the homogenization experiment.
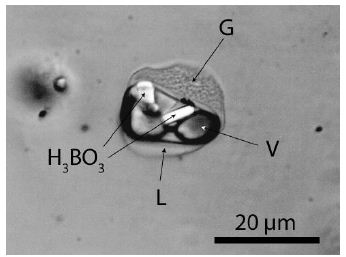
Figure 4: Type-B melt inclusion in graphic quartz from the Elba pegmatite: re- homogenized at 600°C and two kbar, heterogenized after quenching. H3BO3 – boric acid (sassolite), G – silicate glass, L – solution, V – vapor bubble.
Results
Boron Isotopes in the Synthetic Silicate Glass Obtained by a Hydrothermal Diamond Anvil Cell Experiment
The results clearly show that the tendency goes in the right direction. In the aqueous phase, the heavy isotope is enriched, but in the silicate melt, the light B isotope predominates. The standard deviation is substantial for the 1165 cm-1 line. That result is already valid for the Elba pegmatite. (Thomas, 2025b) [8], as we see in the following section (Table 3).
Table 3: Presents the results of Raman isotope analysis of inclusions in the glass phase of the HDAC experiment, based on data from Table 2 (20 measurements each).
|
Raman band H311BO3 (theoretical) |
11B (%) | Raman band H311BO3 (measured) | 11B (%) (measured) |
| 1165.8 ± 0.3 | 80.22 | 1167.5 ± 0.2 |
70.7 ± 3.4 |
|
1380.8 ± 0.9 |
80.22 | 1387.8 ± 0.2 |
77.5 ± 0.6 |
Boron Isotopes in Boric Acid in the Elba Graphic Pegmatite
In case of melt inclusions, the 1166 cm-1 Raman band could not be used because, as a rule, the values are significantly smaller than the line at 1165.8 ± 0.3 for pure H3 11BO3. The reason may be the influence of deuterium or of other elements in the melts. Deuterium in boric acid significantly shifts the Raman lines, primarily affecting the low-intensity lines used for boron isotope determination (Figure 5) (Table 4).
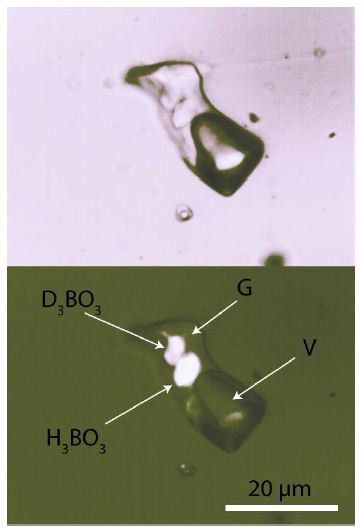
Figure 5: Recrystalized melt inclusion (homogenized at 720°C, 2 kbar, 20 hours) in quartz from the Elba pegmatite with H3BO3 and D3BO3 daughter crystals. For the upper photo, we used unpolarized light; for the lower image, polarized light. H3BO3 – boric acid, D3BO3 – deuterated boric acid, G – silicate glass, V – vapor. In Thomas (2025b) [8], the glass (G) was misinterpreted as liquid (L).
Table 4:
|
Raman band H311BO3 (theoretical) |
11B (%) | Raman band H311BO3 (measured) | 11B (%) (measured) |
n |
| Boric acid in fluid inclusions | ||||
| 1165.8 ± 0.3 |
80.22 |
1166.6 ± 0.7 | 86.2 ± 12.0 | 20 |
|
1380.8 ± 0.9 |
80.22 | 1383.3 ± 2.3 | 91.9 ± 7.4 |
27 |
| Boric acid in re-homogenized melt inclusions | ||||
| 1380.8 ± 0.9 |
80.22 |
1387.6 ± 0.3 | 78.1 ± 1.0 |
20 |
Pseudo-binary Solvus Curve of the System: Pegmatitic Silicate System – Boric Acid-rich Fluid
Figure 6 shows the pseudo-binary solvus curve for the Elba graphic pegmatite obtained from re-homogenization of melt inclusions in pegmatite quartz at 600, 650, 700, and 720°C and two kbar, and always 20 hours using the cold-seal pressure vessel homogenization or the hydrothermal rapid-quench homogenization experiments. The point under 550°C was obtained from homogenization measurements using the Linkam microscope heating stage (in 2003).
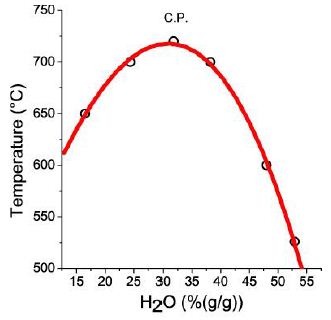
Figure 6: Solvus curve constructed from re-homogenized melt inclusions in quartz from the graphic pegmatite of Elba Island. Each measuring point is the mean of the homogenization measurements on 10 different melt inclusions. CP – critical point (30.0 % H2O, 712°C).
The highest boron concentration in the silicate glass was found in melt inclusions around the critical point: 15.6 % B2 O3 [14]. However, the fluid inclusions are notably higher in boron, as shown in Figure 7. The distribution of B and Cs on the pseudo-binary solvus curve can be calculated using the reduced coordinates (Figure 3b in Thomas et al. 2019) [15,16]. Extreme high concentration of different elements are connected to the critical point, which degenerate to vertical line.
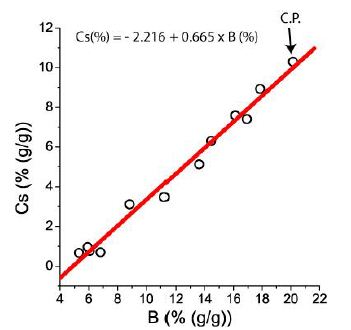
Figure 7: Cs-B correlation of boric acid and ramanite-(Cs)-bearing fluid inclusions in pegmatite quart from the graphic pegmatite of the Elba Island/Italy (see also Thomas et al., 2008) [14].
From Raman measurements, we now know that near the solvus crest (CP), in addition to extremely high boron and cesium concentrations, deuterium has its highest concentration. The determination is not straightforward because deuterium is associated with multiple deuterium-bearing species: H2DBO3, HD2BO3, and D3BO3. Figures 8 and 9 show the Raman spectrum of a typical melt inclusion in quartz with the two different boric acid phases.
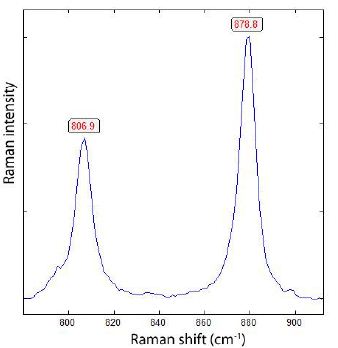
Figure 8: D3BO3 and H3BO3 phases in a near-critical melt inclusion homogenized at 700°C and 2 kbar.
In a small distance (left and right) and the same depth from the sample surface to the critical point, the melt inclusions show only the H3BO3 band at about 880 cm-1. The slight shift from 880 to 878.9 cm-1 is due to contamination with deuterium. Figure 9 allows a rough estimate of deuterium concentration. If we take the analytically determined boron content of the silicate melt at the critical point (720°C and 30 % H2O) of 3.9 % B2O3 [14] we obtain a boric acid concentration of 6.9 %, Because the intensity of both species H3BO3 and D3BO3 is about similar, we have 3.45 % D3BO3, corresponding to 0.32 % (g/g) deuterium in the fluid. That is a high amount.
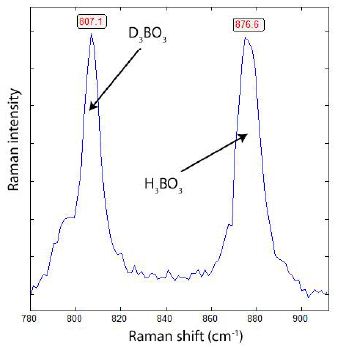
Figure 9: Raman spectrum of boric acid taken from the melt inclusion shown in Figure 5. Both boric acid daughter crystals (D3BO3 and H3BO3 have the same B-isotope composition: 11B is 91.9% and 8.1% 10B.
Discussion
The described fluid and melt inclusions in the graphic pegmatite from Elba Island/Italy are extremely rich in boron (B) and cesium (Cs), as well as deuterium in the supercritical fluid. The isotopic composition of these phases differs significantly between that of the fluid and the melt. The silicate melt is more enriched in the light 10B isotope, whereas the fluid inclusions, representing the fluid, are enriched in the heavy 11B isotope. However, at the critical point, the situation is reversed. That means at least that the supercritical fluid coming from the mantle is enriched in the heavy 11B isotope. That is a further hint at the extraordinary properties and origin of the supercritical fluids. The high deuterium concentration of the supercritical fluid makes it clearer. Furthermore, these observations indicate that isotope fractionation depends strongly on the origin of that phase, which is the deep mantle.
Acknowledgment
The author thanks A. Anderson, William (Bill) A. Bassett, I-Ming Chou, and Robert Mayanovich for the introduction to the hydrothermal diamond anvil cell technique during a stay at the Argonne National Laboratory near Chicago in June/July 2001.
References
- Thomas R, Brümmer G, Scheiblauer K (2025) Paradigm change of pegmatite formation – where does the water come from? Geol Earth Mar Sci 7: 1-7.
- Thomas R, Davidson P, Rericha A, Recknagel U (2023) Ultrahigh-pressure mineral inclusions in a crustal granite: Evidence for a novel transcrustal transport mechanism. Geosciences 13: 1-13.
- Thomas R (2023) Ultrahigh-pressure and temperature mineral inclusions in more crustal mineralizations: The role of supercritical fluids. Geo Earth Mar Sci 5: 1-2.
- Thomas R (2000) Determination of water contents of granitic melt inclusions by confocal laser Raman microprobe American Mineralogist 85: 868-872.
- Thomas R, Webster JD, Heinrich W (2000) Melt inclusions in pegmatite quartz: complete miscibility between silicate melts and hydrous fluids at low Contrib Mineral Petrol 139: 394-401.
- Thomas R, Kamenetsky VS, Davidson P (2006) Laser Raman spectroscopic measurements of water in unexposed glass inclusions. American Mineralogist 91: 467-470.
- Thomas R (2025a) Behavior of deuterium on boric acid: Raman spectrometric measurements: Preliminary Results 7: 1-4.
- Thomas R (2025b) Raman spectroscopy of boric acid daughter crystals with different B-isotopes: H 11BO and H 10BO , and different B-isotopes hydrogen and deuterium concentrations. Geo Earth Mar Sci 7: 1-3.
- Veksler LV, Thomas R, Schmidt C (2002) Experimental evidence of three coexisting immiscible fluids in synthetic granitic pegmatite. American Mineralogist 87: 775-779.
- Thomas R, Davidson P, Rhede D, Leh M (2009) The miarolitic pegmatites from the Königshain: a contribution to understanding the genesis of pegmatites. Contrib Mineral Petrol 157: 505-523.
- Thomas R, Davidson P (2016) Origin of miarolitic pegmatites in the Königshain granite/Lusatia. Lithos 250: 225-241.
- Thomas R (2002) Determination of the H3BO3 concentration in fluid and melt inclusions in granite pegmatites by laser Raman microprobe American Mineralogist 87: 56-68.
- Thomas R, Förster H-J, Heinrich W (2003) The behaviour of boron in a peraluminous granite-pegmatite system and associated hydrothermal solutions: a melt and fluid- inclusion study. Contrib Mineral Petrol 144: 457-472.
- Thomas R, Davidson P, Hahn A (2008) Ramanite-(Cs) and ramanite-(Rb): New cesium and rubidium pentaborate tetrahydrate minerals identified with Raman American Mineralogist 93: 1034-1042.
- Thomas R, Davidson P, Appel K (2019) The enhanced element enrichment in the supercritical states of granite-pegmatite systems. Acta Geochim 38: 335-349.
- Thomas R, Rericha A (2023) The function of supercritical fluids for the solvus formation and enrichment of critical Geol Earth Mar Sci 5: 1-4.