Abstract
First, we present Raman spectroscopic results for commercial boric acid [H3 nBO3] and for the boric acid end members containing 10B and 11B. Furthermore, we show in this short contribution, using boric acid as a daughter mineral in melt and fluid inclusions in pegmatite quard from Elba Island/Italy, that the isotopic composition of boric acid is determinable in situ with an acceptable error of 6%. As a result, we obtain an 11B concentration of 91.9 ± 7.4 %. To our surprise, we also found detectable amounts of D3BO3 in the inclusions, in addition to H3BO3. The very high D concentration clearly shows that a significant portion of the pegmatite-forming fluids originated in the deep mantle.
Keywords
Raman spectroscopy, Pegmatites, Boric acid, Bor isotopes, D3BO3, Supercritical fluids
Introduction
Boron is the fifth element (atomic number) in the periodic table of elements in the third main group. Boron is a rare element, and its concentration in the lithosphere is, according to Rösler and Lange (1975) [1], 12 ppm. In granitic rock, according to the same authors, the concentration is 15 ppm. In Sn-granites from Ehrenfriedersdorf, Central Erzgebirge/Germany, the B-concentration can increase to 132 ppm [2]. In melt and fluid inclusions related to the granites and pegmatites from the Ehrenfriedersdorf deposit, boron concentrations as boric acid increase significantly to 6.88 ± 0.40 % [3] Recent studies [4] showed an extreme rise in B2O3 to 16% (corresponding to nearly 50000 ppm B) with the introduction of supercritical fluids from the mantle. At such high concentrations, it should be possible to determine boron isotopes with Raman spectroscopy. The concentration of boric acid in fluid and melt inclusions in the studied pegmatite from Elba Island can reach up to 20% (vol/vol), corresponding to about 30%(g/g).
Methods and Samples
Methods
Generally, we used boron acid-bearing fluids and melt inclusions in pegmatite quartz from Elba Island. That means fluid- and melt- inclusion with sassolite [H3BO3] daughter crystals. Solid boric acid (sassolite) crystals are easy to identify under crossed Nicols under the transmission light by their peculiar interference color. To select suitable samples, we used a transmission polarization microscope (JenaLab Pol). All Raman spectroscopic studies were performed with a petrographic polarization microscope (BX 43) equipped with an XY- or rotating stage, coupled to the EnSpectr Raman spectrometer R532 (Enhanced Spectrometry, Inc., Mountain View, CA, USA) in transmission. The Raman spectra were recorded in the spectral range of 0–4000 cm-1 using the 30 mW of a single-mode 532 nm laser, an entrance aperture of 20 µm, a holographic grating of 1800 g/mm, and a spectral resolution of 4 cm-1.
Samples
The sample is from the Mining Academy of Freiberg. It’s a small graphic granite sample from Prato alla Valle, located 400 m south of the cemetery of the village San Piero in Campo on the Island of Elba. A detailed description of the paragenesis and the melt and fluid inclusions is in Thomas et al. (2008) [5]. For the study presented here, we used quartz chips approximately 300 µm thick, polished on both sides. All quartz chips contain melt and fluid inclusions with relatively large boric acid (sassolite) [H3BO3] daughter crystals, making the sample suitable for in situ isotope studies. Figure 1 shows such a fluid inclusion.
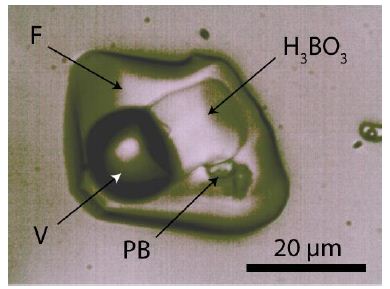
Figure 1: Fluid inclusion in pegmatite quartz from Elba Island. F -fluid, V – vapor, H3BO3 – boric acid (sassoline), PB – pentaborate: ramanite-(Cs).
Some inclusions also contain meta-boric acid crystals. Generally, the used samples are exceptionally rich in inclusions with soluble B-bearing phases
Basic Experimental Section
At first, we took Raman measurements of commercial boric acid (H3 nBO3 ) and of both pure B-isotopes of solid boric acid. The results are in Table 1.
Table 1: Raman of crystallized H3 nBO3 , H3 10BO3 , and H3 11BO3 (n = 20 measurements each).
|
Boric acid with different B-isotopes |
|||
| Raman band (cm-1) H3nBO3 | Raman band (cm-1) 10B-isotope |
Raman band (cm-1) 11B-isotope |
Irel |
|
76.0 ± 1.6 |
74.2 ± 0.5 | 75.4 ± 0.2 | w |
| 119.1 ± 3.8 | 118.3 ± 1.0 | 118.2 ± 0.3 |
w |
|
207.8 ± 1.6 |
211.0 ± 0.4 | 208.3 ± 0.2 | m |
| 497.2 ± 3.8 | 499.7 ± 0.4 | 498.3 ± 0.2 |
s |
|
879.8± 0.3 |
880.1 ± 0.4 | 880.0 ± 0.2 | vs |
| 1092.0 ± 7.2 | – | – |
w |
|
1166.6 ± 2.7 |
1171.6 ± 0.4 | 1166.4 ± 0.4 | w |
| 1383.5 ± 6.3 | 1411.9 ± 0.6 | 1381.8 ± 1.1 |
w |
|
2294.1 ± 2.7 |
– | – | vw |
| 3173.6 ± 4.2 | 3172.2 ± 1.3 | 3170.4 ± 0.2 |
w |
|
3246.4 ± 4.1 |
3252.0 ± 0.6 | 3252.0 ± 0.1 |
w |
nB refers to boron of natural abundance with 19.78 % 10B and 80.22% 11B.
Irel – relative intensity: vs – very strong, s – strong, m – medium, w – weak, vw -very weak.
Table 2 presents both Raman lines of boric acid, which show the most significant differences between the two B-isotopes.
Table 2: Raman lines of B-isotopes of solid boric acid with the most substantial differences(for the 532 nm laser: 20 measurements each).
|
Hilger quartz spectrograph: 253.7 nm |
EnSpectr Raman: 532 nm | |||
| B-isotopes | Raman band (cm-1) |
Raman band (cm-1) |
Raman band (cm-1) |
Raman band |
|
11B |
1166 | 1373 | 1165.8 ± 0.3 | 1380.8 ± 0.9 |
| nB | 1168 | 1375 | 1166.6 ± 2.7 |
1383.5 ± 6.3 |
|
10B |
1173 | 1422 | 1171.6 ± 0.4 |
1411.9 ± 0.6 |
n – refers to boron of natural abundance with 19.78% 10B and 80.22% 11B.
Results
The basis of the present study is the determination of the Raman spectra of commercial and isotope-pure boric acid. The obtained results were applied to the melt and fluid inclusion in quartz from a graphic pegmatite of the Island of Elba/Italy. The study shows that the ~1380 cm-1 Raman band yields the best results. From 27 studied inclusions, we obtained a mean value of 1383.3 ± 2.3 cm-1. Using the data from Table 2, we obtained a linear curve with a correlation coefficient (R2 = 0.99839) and an 11B concentration of 91.9 ± 7.4 %. For the other Raman line (1165.2 ± 1.65 cm-1), we obtained a similar mean, but with a larger standard deviation. This result may be that the deuterium content influences the position of the Raman line (Figure 2).
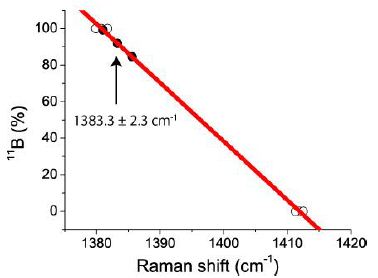
Figure 2: Correlation of the B-isotopes in daughter crystals of boric acid in quartz from an Elba Island pegmatite. 11B-isotope content = 4532.64139 – 3.21026 * RS. RS – Raman shift. The black points are the measured ones, and the open points are from Table 2. The data for commercial boric acid were not used for the correlation because of uncontrolled partial fractionation on the microscope specimen slide.
That means the 11B concentration is incredibly high (91.9 ± 7.4 %) in the boric acid samples from the studied Elba Island pegmatite. Besides the high 11B concentration, there are also, in part, very high deuterium concentrations in the boric acid daughter crystals, as shown in Figure 3. The key results are given in Thomas (2025) [6]. Almost every boric acid crystal shows the Raman band for D3BO3. An extreme example is shown in Figure 4, along with the corresponding Raman spectrum from Figure 3. That should be the first natural example of nearby pure D3BO3. Note that each Raman spectrum of pure H3BO3 daughter crystals shows a very weak Raman band at about 807 cm-1, caused by the quartz host.
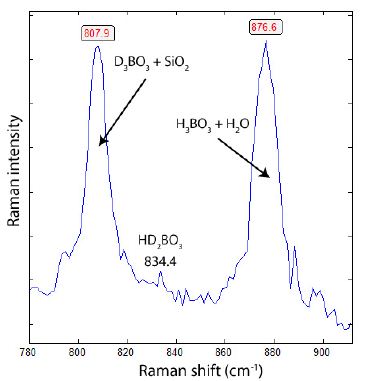
Figure 3: Raman spectrum of H and D-rich boric acid crystals shown in Figure 4. A perfect separation of both phases (H3BO3 and D3BO3) is at the moment not possible with the used Raman spectrometer, because the solution also contains both components. In the case of D3BO3, the separation from the SiO2 host is not unambiguously possible. However, the intensity of the SiO2 band at 807 cm-1 is usually very low (about 5% of the whole band).
Figure 4 shows the two daughter crystals (D3BO3 and H3BO3), which differ slightly in color and represent different phases.
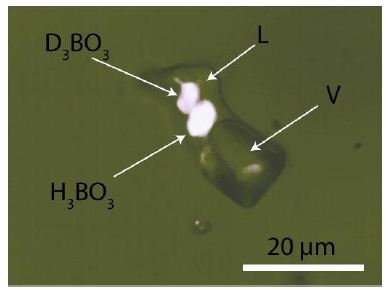
Figure 4: Fluid inclusion in quartz from the Elba pegmatite with H3BO3 and D3BO3 daughter mineral phases. L – liquid phase, V – vapor phase.
Both boric acid daughter crystals in Figure 4 (H3BO3 and D3BO3) have the same B-isotope composition: 11B is 91.9% and 8.1% 10B.
Discussion
We report here, for the first time, unusual boric acid daughter crystals with extremely high 11B and high deuterium content at the % level. Both findings underline the author’s view that, for some pegmatites, a significant part of the volatiles and rare elements comes via supercritical fluids from the, in part, deep mantle of the Earth (Thomas and Rericha, 2024). Furthermore, we demonstrate that B-isotopes can be determined using Raman spectroscopy. That provides an opportunity to directly and non-destructively explore B-isotope fractionation in mineral-forming fluids, because the boric acid daughter minerals in primary inclusions represent the isotope composition of this solution (see Roedder, 1984).
Acknowledgment
We thank in memory Prof. Ludwig Baumann (1929-2008), of the Mining Academy Freiberg, for the provision of the sample from the Island of Elba.
References
- Rösler HJ, Lange H (1975) Geochemische Leipzig. Pg: 675.
- Hösel G (1994) Das Zinnerz-Lagerstättengebiet Ehrenfriedersdorf/Erzgebirge. Pg: 195.
- Thomas R, Förster H-J, Heinrich W (2003) The behaviour of boron in a peraluminous granite-pegmatite system and associated hydrothermal solutions: a melt and fluid- inclusion study. Contrib Mineral Petrol. 144: 457-472.
- Thomas R, Rericha A (2024) Extreme element enrichment, according to the Lorenzian distribution at the transition of supercritical to critical and under-critical melt or Geol Earth Mar Sci. 6: 1-6.
- Thomas R, Davidson P, Hahn A (2008) Ramanite-(Cs) and ramanite-(Rb): New cesium and rubidium pentaborate tetrahydrate minerals identified with Raman American Mineralogist. 93: 1034-1042.
- Thomas R (2025) Behavior of deuterium on boric acid: Raman spectrometric measurements: Preliminary Geol Earth Mar Sci. 7(7): 1-4.
- Roedder E (1984) Fluid Reviews in mineralogy. 12.
- Gmelin L (1954) Gmelins Handbuch der anorganischen Chemie: Bor (Ergänzungsband). Verlag Chemie, Weinheim. Pg: 253.
- Krishnan K (1963) The Raman spectrum of boric acid. Proceedings of the Indian Academy of Sciences, Section 57: 103-108.