Abstract
During the Raman study of gray cast iron, we found graphite flakes decorated with spherical diamond crystals. The first-order Raman bands of these diamonds and the graphites that belong to them are given. The diamond pattern leads us to assume that the diamonds were primarily crystallographically arranged. The now arcuate arrangement lets us presume that stress deformed the graphite flake perpendicular to the c-axis. The often present Raman forbidden 867 cm-1 line, which is usually IR-active, is found together with frequently found methane and benzene in graphite, maybe as intercalates. As a rule, the studied diamonds always show the graphite line besides the diamond band because the cross-section for sp2 is much greater than for sp3– bonded structures.
Keywords
Raman spectroscopy, Graphite flakes, Diamond in cast iron, Pressure questions, Forbidden Raman line, CH4 intercalation, Deformation of graphite
Introduction
During the study of gray cast iron in “as-cast state”, we found diamond crystals in graphite for the first time using Raman spectroscopy. In the past, Sobolev et al. (1993) [1] synthesized diamond in cast iron by detonation. Forerunners were DeCarli PS, Jamieson JC (1961) [2] and Cowan et al. (1968) [3], who produced diamonds from carbon by high-pressure shock waves. They could make a hexagonal diamond for the first time. In our gray cast iron samples, we also found in graphite nodules hexagonal lonsdaleite crystals with their characteristic Raman triplet at 1244, 1305, and 1356 cm-1 [1,4]. Sobolev et al. (1993) [1] and Sobolev et al. (2020) [5] synthesized diamonds in gray cast iron; however, they obviously did not check the cast iron for the presence of diamonds before their detonation experiments. So, diamonds/nanodiamonds are probably always present and serve in part as seeds for the formation of larger diamonds. In our case, detonation or shock waves can definitely be excluded.
Samples and Methods
For the study, we selected six different gray cast iron samples, in which we found diamonds. One sample (Sample 2) served for detailed research [6]. Sample 2, a rectangular parallelepiped of 15.2 g, is treated in two steps with hydrochloric acid (25%). In the first step, we solved 1.90 g to remove possible remnants of diamonds from the grinding and polishing. We rejected this part. In the second step, we extracted an additional 1.60 g of iron from the sample. The solid remnants in the hydrochloric acid solution of the second sample (graphite, boron, and carbides) were cleaned with destilled water and placed on a microscope slide to dry. The amount of the remnant was not determined, therefore the exact amount of diamonds is not possible. For the study, we generally used a polarization microscope for transmission and reflection (Olympus BX43) equipped with an X-Y or rotating stage coupled with the EnSpectr Raman spectrometer R532. Details are in Thomas et al. (2025) [7]. Figure 1 shows the reference Raman spectrum of diamond from Brazil (Mining Academy Freiberg: 2453/37) in the range of 0 to 2000 cm-1, taken at 30 mW on the sample.
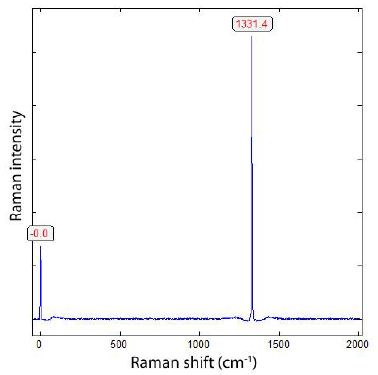
Figure 1: Reference Raman spectrum of diamond. The FWHM (Full-Width at Half Maximum) is 4.26 ± 0.42 cm-1.
Experimental Section and Results
From the second cleaned solution fraction, we put small graphite flakes on the microscope slice. Under many graphite flakes with single or a couple of diamonds, we found two flakes with many diamonds, which are ± regularly distributed (Figure 2). For a more detailed study, we used the number two shown in Figure 2. The diamonds show in graphite a double arrangement of hyperboloids perpendicular to each other, demonstrating two-dimensional stress.
Notes to Figure 2: A picture tells us more than 1000 words. For the distortion of 3.8 µm, a force of 3.8 N is applied over the area of the graphite flake, which corresponds to a pressure of approximately 3.04 GPa. That means, in local areas, high pressure is possible (see further below).
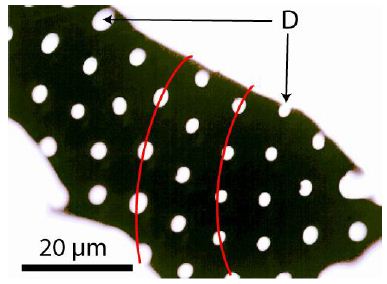
Figure 2: Graphite flake (black) with ± regularly crystallographically arranged diamonds (white). The graphite flakes have a thickness of about ≥ 2.5 µm, and the percentage of diamonds is ~7.4 vol%. The red lines show schematically the bend of the graphite plate perpendicular to the c-axis.
From Raman spectrometric measurements, we obtained the following data for 11 diamonds (Table 1).
Table 1: Results of the measurements on the diamond spheres shown in Figure 2 (532 nm laser, four mW excitation on the sample).
|
Crystal |
Diamond (cm-1) | FWHM (cm-1) | Graphite (cm-1) | FWHM (cm-1) | n |
| Flake 1b | 1329.2 ± 2.8 | 66.4 ± 0.6 | 1582.4 ± 7.7 | 62.2 ± 2.1 |
11 |
n: number of studied crystals; FWHM: Full-Width at Half Maximum.
A typical Raman spectrum is shown in Figure 3. Note, according to Prawer (1998) [8], the Raman cross-section for sp2 clusters is significantly greater (by a factor of 50, including the 1580 cm-1 band) than that for sp3-bonded carbon of diamond. The large FWHM values are a problem because all diamonds (in cast iron or in nature: see Thomas, 2025) [9] show such large values for FWHM. It is conceivable that the partial hydrogenation of the diamond surface is its origin [10].
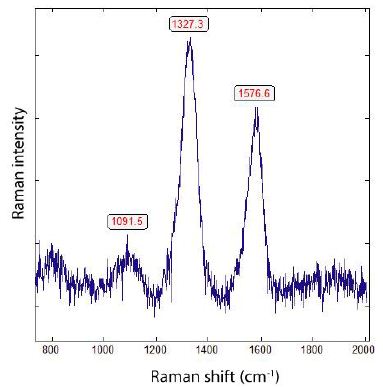
Figure 3: Raman spectrum (4 mW excitation) of diamond from Figure 2. Because the measuring point is about 1 µm in diameter, the Raman band of “graphite” is the result of a relatively high concentration of sp2 cluster in diamond [8], by a thin carbon coating on the diamond, or simply by the excitation of the graphite matrix by chance.
From a rough estimation (Figure 2), we obtain a diamond volume of about 7.4 vol% for the graphite flake. The regular arrangement of the more or less spherical diamond crystals points to a growth of the diamonds in the graphite flake during the production of the gray cast iron. Extreme high pressure to produce diamonds can, in each case, be excluded. The exact origin of such diamonds can not be explained at present. It is clear that the diamonds grow after the formation of graphite, and they are not trapped in graphite by change, as the regular arrangement shows. Obviously, the diamonds mark the grain boundary edges. The low number of diamonds shows that the graphite is less defective and reduces the number of nucleation sites. The process of transforming graphite into a diamond typically requires very high pressures (4.5-6 GPa) and temperatures (900-1,300°C). Such high values for pressure are probably not achieved in the production of gray cast iron. The exact pressure and temperature can vary slightly depending on impurities and the presence of catalysts. Here is iron the favorite. Generally, other catalysts are nickel, cobalt, and alloys of Fe, Ni, Co, and rare-earth metals. These can dramatically lower the pressure and temperature needed for diamond formation. The metals dissolve graphite and facilitate the rearrangement of carbon atoms into the diamond structure at much lower pressure, or even lower with optimized catalysts.
Figure 4 results are approximately obtained using the temperature, the molar volume of graphite and diamond, and the entropy of both using Dean’s (1979) [11] and Jacob’s (1995) [12] data. According to Figure 4, the pressure reduces from 2.19 to 1.82 GPa (triangle), which also corresponds to the stability of calcite as a melt droplet in the gray cast iron (see Brümmer et al. 2025 [6]), which demonstrates a high pressure for the stabilization, because at atmospheric pressure, calcite decomposes into CaO and CO2 [13]. An increase in the molar volume is, for example, possible by the formation of a porous texture or impurities (Fe3C). One all-present catalyst is the iron in the surroundings of the graphite flakes, the primary catalyst. Another one is the methane sitting in the graphite lattice, as we assume from Figure 5. This figure shows the sharp Raman forbidden band at 867 cm-1; however, this band is usually only IR active [14,15]. According to Kawashima and Katagiri (1999) [16], it arises from impurities and/ or structural imperfections. Dmitruk et al. (2012) showed that after quantum-chemical investigations, the methane molecule intercalates between graphite planes. The most stable form of these is methane, which is in the form of dimers or clathrates. The concentration of such intercalated amounts to mole% [14]. With Raman spectroscopy, we can show that most graphite in the gray cast iron contains methane and benzene, which, at high temperatures, behave supercritically and move very fast to the grain boundary edges, forming there clathrates as a preliminary stage of DLC (Diamond Like Carbon).
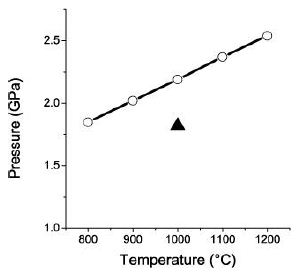
Figure 4: The graph shows the calculated equilibrium curve of graphite and diamond, as well as the effect of the increase in the molar volume of the graphite (black triangle) by 7.4% resulting in a drop in pressure of 0.95 GPa at 1000°C.
Note: In all studied samples, this remarkable Raman-forbidden line was found, which means that at least this line is typical for gray cast iron. More studies on this problem are necessary. The intercalated methane (CH4) together with hydrogen (H2) serves in the supercritical state as seeds for the nucleation of diamonds in the graphite grain boundaries, and with fewer defects.
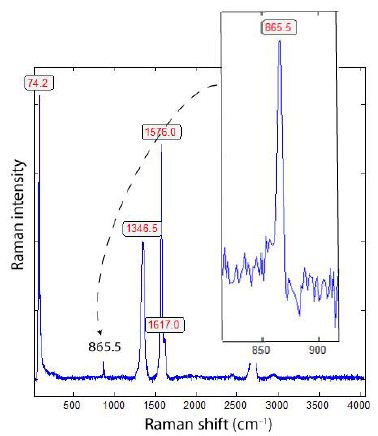
Figure 5: Raman bands of graphite (D-band at 1350 cm-1; G-band at 1580 cm-1). The insertion shows the forbidden Raman line in graphite, which is usually only IR-active. This line is typical for graphite in gray cast iron. The intensity of the forbidden Raman band at 866 cm-1 is only 1/30 of the G-band.
Discussion
We found diamonds using Raman spectroscopy in all the gray cast iron samples studied. Finding diamonds with classic light- microscopical methods in gray cast iron is somewhat tricky. Raman spectroscopy is very helpful for making a clear decision. To prevent diamonds from being used for the preparation of the samples, we rigorously removed the surface of the samples with hydrochloric acid. During that process, we found occasional flakes of graphite with crystallographically arranged diamonds. Most graphite flakes show only, if at all, a single or a small couple (1-3) of diamonds. In a recent paper by Shumilova et al. (2025) [17], the results of glassy carbon synthesized from supercritical fluid in the C-O-H system at 800°C and pressures of 500 to 1000 atm show similar carbon bodies; however, with strongly different Raman band positions using the 532 nm laser (Table 1 in that paper). Because the FWHM values for diamonds are huge [9], more sophisticated studies are necessary.
Acknowledgement
The author extends his sincere gratitude to Gregor Brümmer (Altzheim, Germany) and Klaus Scheiblauer (Wiener-Neustad, Austria).
References
- Sobolev VV, Taran Yu N, Gubenko SI (1993) Synthesis of diamond in cast iron. Met Sci Heat Treat 35: 3-9.
- DeCarli PS, Jamieson JC (1961) Formation of diamond by explosive Science 133: 1821-1823. [crossref]
- Cowan GR, Dunnington BW, Holtzman A H (1968) Process for synthesizing United States Patent Office, 3,401,019, 12 P.
- Goryainov SV, Likhacheva Ayu, Ovsyuk NN (2018) Raman scattering in Journal of Experimental and Theoretical Physics 127: 20-24.
- Sobolev VV, Gubenko SI, Rudakov DV, Kyrychenko OL, Balakin OO (2020) Influence of mechanical and thermal treatments on microstructural transformations in cast ions and properties of synthesized diamond Solid State Physics, Mineral Processing 4: 53-62.
- Brümmer G, Thomas R, Scheiblauer K (2025) Wie wächst er nun? Der Graphit im Gußeisen unter dem Raman-Spektroskop. Giesserei Rundschau 72, 4: in press.
- Thomas R, Brümmer G, Scheiblauer K (2025) Unexpected carbon phases in grey cast iron – diamond, calcite, and GEMS 7(4): 1-6.
- Prawer S, Nugent KW, Jamieson DN (1998) The Raman spectrum of amorphous Diamond and Related Materials 7: 106-110.
- Thomas R (2025) Diamond in pegmatites and related rocks in the upper GEMS 7: 1-5.
- Datta J, Ray NR, Sen P, Biswas HS, Vogler EA (2012) Structure of hydrogenated diamond like carbon by micro-Raman spectroscopy. Material Letters 71: 131-133.
- Dean JA (1979) Lang’s Handbook of 15th ed. McGraw-Hill, New York. 1291 P.
- Jacob KT (1995) Determination of the Gibbs energy of diamond using a solid state Solid State Communications 94: 763-765.
- Hou M, Zang Q, Tao R, Liu H, Kono Y, et al. (2019) Temperature-induced amorphization in CaCO3 at high pressure and implications for recycled CaCO3 in subduction Nat Commun 10: 1-8.
- Dresselhaus MS, Dresselhaus G, Eklund PC, Chung DDL (1977) Lattice vibrations in graphite and intercalation compounds of graphite. Materials Science and Engineering 31: 141-152.
- Thomas R, Rericha A, Pohl WL, Davidson P (2018) Genetic significance of the 867 cm-1 out-of-plane Raman mode in graphite associated with V-bearing green Mineralogy and Petrology 112: 613-645.
- Kawashima Y, Katagiri G (1999) Observation of the out-of-plane mode on the Raman scattering from the graphite edge plane. Physical Review B 59: 62-64.
- Shumilova TG, Ivanova LA, Isaenko VV, Ulyashev VV, Medvedev Vya, et al. (2025) Glassy carbon synthesis from supercritical fluid in the C-O-H system at 800°C and pressues of 500-1000 Glass and Ceramics 81: 401-408.