Abstract
During the study of graphite in grey cast iron, we found unexpectedly small diamond crystals similar to those shown by Gong et al. (2024). Using Raman spectroscopy, we have characterized the graphite nodules as well as the diamond crystals, which can obtain dimensions up to 25 x 9 µm. We have also found diamond films. Our finding shows that diamond can grow at high temperatures and low pressure (> 10 kPa), possibly by an unknown catalyst. This study is a bridge between the diamond synthesized at about 5-6 GPa and 900-1400°C and the diamond formed at about 700°C and 0.1 GPa in the Earth’s crust.
Keywords
Diamond, Graphite, Cast iron, Raman spectroscopy, Forbidden Raman lines in graphite
Introduction
The first author has found diamond and related minerals, like SiC (moissanite), and complex boron carbides as small (10-20 µm), very smooth spheres in minerals of crustal origin and has interpreted these as little presents brought into the crust by supercritical fluids or melts from the Earth’s mantle. Such testimonies to the past are not uncommon in the German and Czech Variscan Erzgebirge and also in the Lusatian Mountains. Further examination of the rock bearing such evidence brought an enormous surprise: the formation of such minerals on the spot, means in crustal regions. Such unambiguous proofs include whiskers of diamond, moissanite, and boron carbides in quartz, topaz, cristobalite, and others [1,2]. Also unnoticed were small diamond crystals in synthetic fluorite produced at room pressure and high temperature using the Stockbarger method [1].
Carbon liquifies iron and makes it much easier to cast than steel (Figure 1). After solidification, carbon ends up in castings either as graphite (grey cast iron) or as iron carbide (chilled cast iron). If graphite appears, solidification takes place according to the stable Fe-C binary phase system; if iron carbide appears, solidification happens according to the metastable Fe-Fe3C system. Usually, cast iron contains both carbon phases; thus, foundrymen are used to thermodynamic metastable phases, and the enormous range of material properties which cast iron could offer is caused by the knowledge of foundrymen how to modify the solidification of their castings to get the right shape and balance of stable and metastable carbon phases. Ductile Iron (GJS) is available with tensile strength starting from 350 N/mm² in conjunction with elongations up to 25 % – free of Fe3C – to „as cast“ 700 N/mm² tensile strength and a limited elongation at that level containing a lot of Fe3C formed at about 723°C. Grey Cast Iron is available with tensile strength between 150 and 300 N/mm², has nearly no elongation, and includes, in most cases, Fe3C formed at about 723°C. Besides Carbon, Silicon is always present as an alloying element at a level of typically 2 %. This range of properties could be modified and enlarged by additional alloying elements as well as specific heat treatments and makes cast iron applicable for such different products as pillars for forging, rolls for paper production, pipes for freshwater supply, callipers and brake discs for vehicles up to little keys with a weight range from some 100 metric tons down to some few grams.

Figure 1: Draft of the combined stable and metastable iron-carbon binary phase system [3].
Although grey cast iron is a relatively well-known material used industrially for much more than 200 years, the question of how carbon precipitates and carbon phases grow in detail is still under investigation. Thus, collecting more information about the crystallinity of carbon in grey cast iron by using Raman spectroscopy was the key target of the research (report will be published soon). During this study, we found for ourselves surprising nanodiamonds and diamonds. Here we will briefly describe our observations.
Sample Material
Several samples of various kinds of cast iron are studied. But just in one of them, all these unexpected carbonaceous phases have been detected rather close together. Figure 2 shows the microstructure of this specific ductile iron, which is quite typical for a rapid solidified thin-walled casting in conjunction with a bismuth-cerium inoculation. Both rapid cooling and the bismuth-cerium inoculation increase the number of nodules and cause a sound casting free of Fe3C where a high elongation above 20 % in conjunction with a tensile strength of roughly 420 N/mm² could be expected.
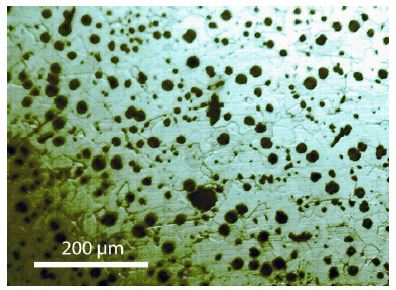
Figure 2: Micrograph of the sample referring to phases shown in Figure 1. It is an etched GJS 400. Foundrymen would consider all black particles as nodules of graphite. The white area between them is ferrite, and the grey lines within ferrite are the borders between eutectic cells. Thus, all material within a grey line belongs to one austenite crystal, which became ferrite below the eutectoid transformation point.
This casting and thus the sample have been produced while using a standard FeSiMg below 10 % magnesium, containing a reasonable amount of Ca, but no rare earths (REE). The treatment was done using the sandwich method. High-purity pig iron, low-Mn steel scrap, and electrode graphite were used as raw materials. The melting has been performed in an induction furnace. As a preconditioner, a FeSiBa- alloy with approx. 2 % Ba and less than 50 % Si has been added together with FeSiMg. After Mg-treatment, approximately 0,15 % of a FeSiBiCe-inoculant (containing besides 74 % of silicon roughly 1 % Bi, 1 % Ca, and 2 % Ce) is added in stream, and finally a mould inoculation with approx. 0,1 % of a FeSiAl4 optimizes successfully the microstructure. The final composition of the melt was 3.55 % C, 2.72 % Si, 0.05 % Cu, 0.003 % Sn, 0.20 % Mn, 0.15% Ni, 0.035 % Mg, 0.010 % S, 0.0017 % Ce, 0.0013 % Bi, 0.001 % Ca. The main target was to identify the crystallinity of the graphite phase, and Figure 3 shows one Raman spectrum of the centre of one of such nodules. For our studies, we used a rectangular parallelepiped, about 14 x 14 x 9 mm. The large area is diamond-polished. To distinguish between the diamonds used for this polishing procedure, we show a Raman spectrum of such diamonds in Figure 4, which has been detected in samples as well [4].
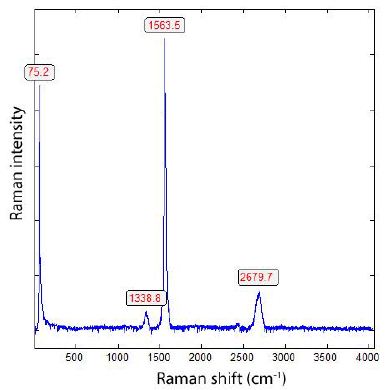
Figure 3: Raman spectrum of a graphite nodule of the sample (see Figure 2). The meaning of the band at 75.2 cm-1 is unclear, and its general appearance must be a task for the future.
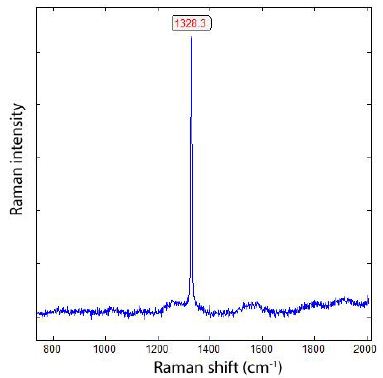
Figure 4: Raman spectrum of diamond used for sample polishing. Typical is the strong intensity and very small FWHM (about 4 cm-1; see further below). The graphite band (G-band) is absent.
Microscopy and Raman Spectroscopy
Besides a polarization microscope for transmission and reflection (JenaLab Pol), we performed all microscopic and Raman spectroscopic studies with a petrographic polarization microscope (BX 43) with a rotating stage coupled with the EnSpectr Raman spectrometer R532 (Enhanced Spectrometry, Inc., Mountain View, CA, USA) in reflection and transmission. The Raman spectra were recorded in the spectral range of 0–4000 cm-1 using an up-to-50 mW single-mode 532 nm laser, an entrance aperture of 20 µm, a holographic grating of 1800 g/mm, and a spectral resolution of 4 cm-1. Generally, we used an objective lens with a magnification of 100x: the Olympus long-distance LMPLFLN100x objective (Olympus, Tokyo, Japan). The laser power on the sample is adjustable down to 0.02 mW. The Raman band positions were calibrated before and after each series of measurements using the Si band of a semiconductor-grade silicon single-crystal. The run-to-run repeatability of the line position (based on 20 measurements each) is ± 0.3 cm-1 for Si (520.4 ± 0.3 cm-1) and 0.4 cm−1 for diamond (1332.7 cm-1 ± 0.4 cm-1 over the range of 80–2000 cm-1). The FWHM = 4.26 ± 0.42 cm-1. FWHM is the Full-Width at Half Maximum. We also used a water-clear natural diamond crystal (Mining Academy Freiberg: 2453/37 from Brazil) as a diamond reference (for more information, see Thomas et al., 2023) [5]. The zero-point position for the Raman spectroscopic measurements is checked before each measurement campaign. For the identification of mineral phase, we used Hurai et al. (2015) [6], the RRUFF database by Lafuente et al. (2015) [7], and Liu et al. (2024) [8]. Figure 5 shows the Raman spectrum of the diamond reference and the zero point of the used Raman spectrometer.
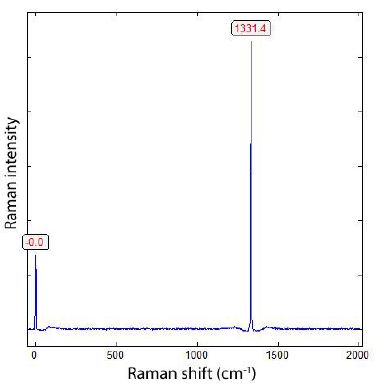
Figure 5: Raman spectrum of the reference diamond No. 2453/37 from the Mining Academy Freiberg. From 20 measurements, the mean is (1332.7 ± 0.4) cm-1 and the FWHM is 4.26 ± 0.42 cm-1.
Results
During the study of graphite nodules in ductile iron, we also found inclusions of calcite, and besides them, a small diamond crystal (26 x 9 µm). Others are even smaller and spherical. Figure 6 shows details of such as calcite and diamond-bearing area (Figures 6, 7a and 7b). Also important is the very strong Raman band of methane (CH4). Figure 7b shows the Raman spectrum of methane dissolved in the calcite of Figure 6. Other calcite crystals show the Raman band of saturated hexane (C6H14) (2931.8 cm-1) – see Hurai et al. (2015) [6]. The Raman spectrum of diamond (D) in Figure 6 is shown in Figure 9. Characteristically, there are the double peaks of diamond and graphite. Figure 8a shows the Raman spectrum of a graphite nodule. Typical is the presence of the forbidden Raman band at 866 cm-1 (Figure 8b). According to Estandia et al. (2014), the irreducible representation of the graphite modes is ΓGr = 2A2u + 2B2g + 2E1u + 2E2g. There are two infrared (IR) modes: E1u at 1587 cm-1 and A2u at 870 cm-1, and two Raman modes: E2g at 1580 cm-1 and E2g at 42 cm-1. For the Madagascar graphite, the E2u lies between 65.6 and 75.8 cm-1. The often observed Raman line at 1350 cm-1 (D-mode) stands for disordered graphite. The A2u mode at about 870 cm-1 is an infrared (IR) band and is Raman forbidden. In our case, this forbidden band is present at about 865 cm-1 and may be the result of intercalated sulfur, which changes the symmetry of graphite [10,11]. However, the concentration of sulfur is with 0.01% so low that this interpretation is very doubtful. A better candidate would be Si or REEs. According to Gong et al. (2024) [12], Si is critical for the diamond growth at low pressure and high temperature (Figures 8b and 9). In the same sample, there are also larger diamond “aggregates” as can be seen in Figure 10. This aggregate is composed of two diamond grains and a diamond film in between. The Raman spectra of the studied sample are not uniform. There are also those without or only a tiny or weak graphite Raman band. Single diamond bands without graphite are scarce. The Raman spectrum in Figure 11 shows the ideal graphite G-band at 1580.0 cm-1. The carbon D-mode at 1350 cm-1 is characteristic of disordered graphite (see e.g., Enstandia et al. 2014) [9] and is here not present. The strong Raman band at 1320.7 cm-1 is representative of the first-order line of diamond. The shift of about 12 cm-1 (1320.7 cm-1) from the 1333 cm-1 standard position of diamond can be attributed, according to Zaitsev (2001) [13], to highly doped diamonds (e.g., aluminium). Another possibility is, according to the same author, stacking faults oriented in (111) planes of lonsdaleite (hexagonal diamond polytypes). A further explanation for these observations is that the Raman values of the diamond main line are low. However, there are two further possibilities: (i) isotope shift in the direction of higher 13C contents, and (ii) the position of the Raman line decreases strongly with the increase of the temperature [13], which means the temperature state is frozen during cooling. The first case (i) is not valid because 13C-rich carbon was not used. The Raman value of 1325 cm-1 for diamond speaks for freezing the diamond in the sample at about 730°C (see Figure 1 and Zaitsev 2001) (Figure 11 and Table 1) [13].
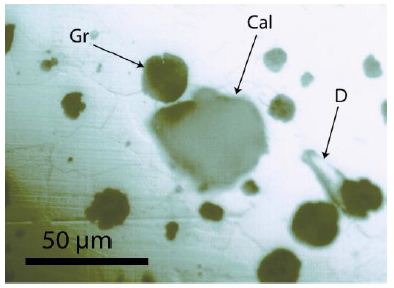
Figure 6: Surface of cast iron with calcite (Cal), diamond (D), and graphite (Gr). The calcite crystal is about 48 x 44 µm in size, and the graphite spheres are ≤ 20 µm in diameter. This diamond here is exceptionally huge. Most diamonds are more petite, similar to nanodiamonds. Calcite could be identified with the typical Raman lines at 152.4, 276.3, 710.7, and 1084.6 cm-1 (see Figure 7a). Figure 7b represents the typical Raman band of methane (CH4).
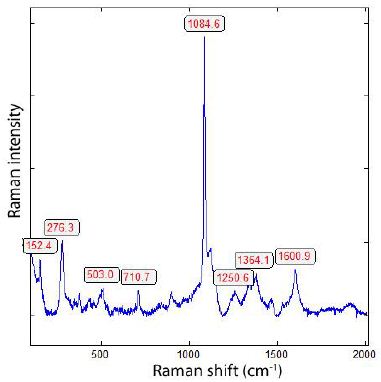
Figure 7a: Raman spectrum of calcite. Noteworthy are also the typical Raman bands of carbon at 1364 and 1600 cm-1. The color of calcite is black due to the distributed carbon particles. CaO could not be proved.
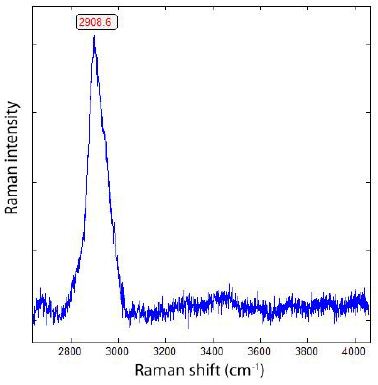
Figure 7b: Raman spectrum of methane (CH4) in calcite, shown in Figure 6. Hydrogen is always present in cast iron.
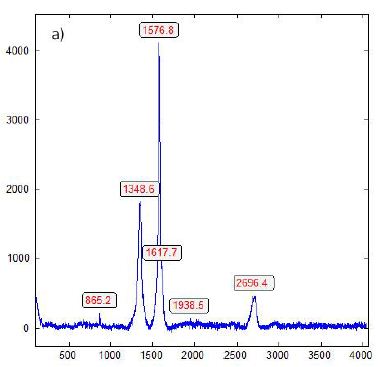
Figure 8a: Raman spectrum of a graphite nodule in ductile iron. The presence of the D-band in graphite (G-band) shows that the graphite is not defect-free. Note the very weak Raman band at 865 cm-1. The Raman band at about 75 cm-1 was cut off because they should lie at about 42 cm-1 (Estandia et al., 2014) – [9]. The significant difference is unclear.
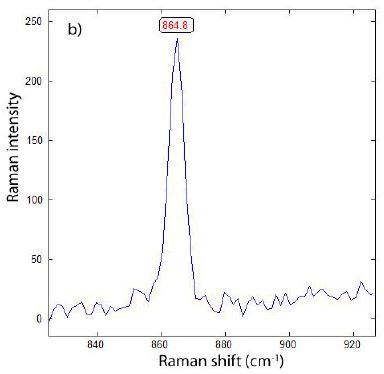
Figure 8b: Raman-forbidden A2u mode of a graphite nodule in cast iron, sample 2 – counting time about 8 times the time used for the spectrum in Figure 8a.
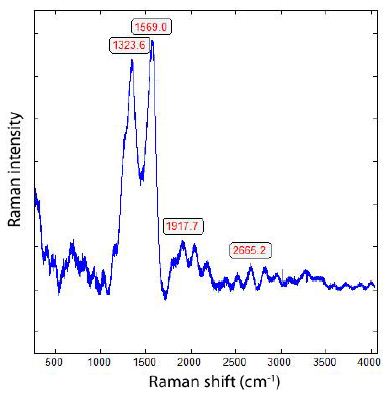
Figure 9: Raman spectrum of the diamond in Figure 6. The intense 1569.0 cm-1 band is, according to Zaitsev (2001) – [13], a feature of the Raman spectra of low-quality diamond films.
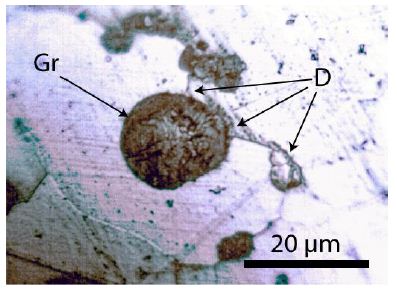
Figure 10: Larger diamond aggregate and a film in the sample shown in Figure 2.
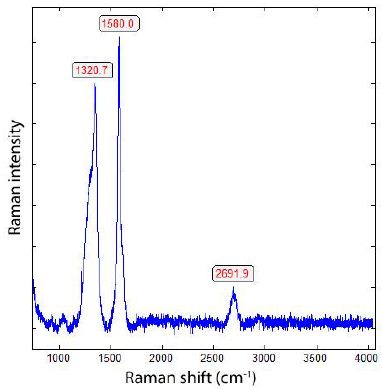
Figure 11: Raman spectrum of diamond with a very sharp graphite band. The origin of the band at 2692 cm-1 is the 2D band (second order) of graphite.
Table 1: Results of the Raman measurements on the main lines of 12 diamond-graphite crystals in cast iron (Sample 2) – 12 different diamond crystals. The exact number is for 2a after etching.
|
Sample |
Diamond |
FWHM |
Graphite |
FWHM |
|
2 |
1324.6 ± 11.8 cm-1 |
66.9 ± 13.8 cm-1 |
1572.3 ± 9.5 cm-1 |
42.0 ± 21.1 cm-1 |
|
2a |
1317.8 ± 10.0 cm-1 |
77.7 ± 15.8 cm-1 |
1580.2 ± 7.1 cm-1 |
62.1 ± 22.7 cm-1 |
Remark to sample 2a: These diamond grains are on all sides of the sample parallelepiped exposed after strongly etching sample 2 with HCl (25%) for 24 hours and strong cleaning with distilled H2O to prevent measurement on diamonds used for preparation.
Interpretation
Thomas (2025a and b) [13,14] has shown that diamond can be brought via supercritical fluids or melts from the mantle into the crustal regions as small spherical crystals. The introduction of diamond in this way poses no problems. A larger problem is the growth of such minerals, such as diamond and moissanite (SiC) whiskers, in minerals formed at the crustal places (at about 700°C and 0.1 GPa). Traditionally, for the development of diamonds, we need temperatures of 900-1400°C and 5-6 GPa. Gong et al. (2024) [12] have now demonstrated that diamond can grow on a graphite crucible at one atmospheric pressure and 1175°C without any diamond seeds with a mixture of methane and hydrogen, and a mixture of Ga, Ni, Fe, and Si as metallic melt. The Fe/Si ratio within cast iron is similar to that reported by Gong et al. (2024) [12]. After these authors, Si played a critical role in the growth of diamond. We have now shown that diamonds can also grow in standard cast iron. The found macroscopic diamond crystals are up to 20 µm large. There are also many nanodiamonds present. A careful investigation is necessary to quantify the amount of diamond in the cast iron. There are also a lot of questions to solve: What is the critical component for the formation of diamond? Does calcite, together with hydrogen as a supplier of methane, have a key meaning (see Matjuschkin et al. (2020).
Practical Conclusions
Ductile cast iron is made from a melt, for which at least 10 key elements need to be considered, as well as some more, and all of them influence the precipitation of the crystalline phases. Metastable compounds, especially Fe3C, are known and used to modify the mechanical properties of cast iron. Oxides and sulphides are considered to play an essential role during graphite nucleation and avoid eutectic growth of Fe3C. Thus, a wide range of nanoparticles found within cast iron is standard and well documented over decades (e.g., Stefanescu 2020, Sommerfeld & Tonn 2008, Zykova et al. 2018) [15-17]. Cast iron solidifies at temperatures around 1140°C, and although graphite expansion causes some pressure within the casting during solidification as well as during further cooling phases, the sum of pressures measured outside at the casting surface, according to Nandori & Dul (1982) [18,19], is not impressive. Therefore, considering the formation conditions needed to generate such phases as diamond and calcite just out of their elements, it is surprising that they exist under the circumstances of cast iron production. On the other side, if their amount is marginal – and it seems so, as it took until now to detect them – they will not have any practical influence on cast iron production. Whether the “cast iron synthesis” of nanoparticles, as e.g., those three-dimensional carbon structures, might have any value for other applications is doubtful, but at least foundrymen might feel now that the value of their castings is higher than what they get traditionally paid for.
Acknowledgment
Thanks to DI Dieter Nemetz, managing owner of Johann Nemetz & Co. GmbH and chairman of PROGUSS Austria, for supporting this research as well as others with ongoing interest.
References
- Thomas R (2025a) The change from the supercritical fluid-melt system into the under-critical stage: The Zinnwald example. Geol Earth Mar Sci 7: 1-9.
- Thomas R, Trinkler M (2024) Monocrystalline lonsdaleite in REE-rich fluorite from Sadisdorf and Zinnwald/E-Erzgebirge, Germany. Geol Earth Mar Sci 6: 1-5.
- Bauer W (2013) Gusseisen mit Lamellengraphit, Leoben, ÖGI-Eigenverlag.I-V and 95 PG.
- Keller DS, Ague JJ (2022) Possibilities for misidentification of natural diamond and coesite in metamorphic Neues Jb. Mineral Abh 197: 253-261.
- Thomas R, Davidson P, Rericha A, Recknagel U (2023) Ultrahigh-pressure mineral inclusions in a crustal granite: Evidence for a novel transcrustal transport mechanism. Geosciences 13: 1-13.
- Hurai V, Huraiová M, Slobodník M, Thomas R (2015) Geofluids – Developments in Microthermometry, Spectroscopy, Thermodynamics, and Stable Isotopes. Elsevier.
- Lafuente B, Downs RT, Yang H, Stone N (2015) The power of database: the RRUFF project. In: Armbruster T, Danisi, R.M. (eds). Highlights in mineralogical W. De Gruyter, Berlin. Pg: 1-30.
- Liu Q, Miao H, Liu W, Bu L, Yao J, et (2024) Selective transformation of cementite: Graphitization or spheroidization. Materials Today. 18 pages, under review.
- Estandia B, Rodriguez L, Alvarez, JA, Ferreño D, Hernández D, et al. (2014) Raman spectroscopy of flake graphite as a tool to detect stress-strain states in cast Advanced Sustainable Foundry. 71st World Foundry Congress in Bilbao. 6 pages.
- Yang H-P, Wen H-H, Zhao Z-W, Li S-L (2001) Possible superconductivity at 37 K in graphite-sulphur Chin Phys Lett 18: 1648-1650.
- Thomas R, Rericha A, Pohl WL, Davidson P (2018) Genetic significance of the 867 cm-1 out-of-plane Raman mode in graphite associated with V-bearing green Mineralogy and Petrology 112: 613-645.
- Gong Y, Luo D, Choe M, Seong WK, Bakharev P, et (2024) Growth of diamond inliquid metal at 1 atm pressure. Nature 629: 348-354.
- Zaitsev AM (2001) Optical Properties of A Data Handbook. Springer, I-XI, and 1-502 pages.
- Thomas R (2025b) Strong Isotope Fractionation Between 13C and 12Cin the Supercritical Fluids Related to the Variscan Mineralizations in Erzgebirge, Slavkovský Les (Kaiserwald), and Lusatian Mountains, Germany, and the Czech Republic, and Some Remarks on the Low-Pressure Formation of Geol Earth Mar Sci 7: 1-6.
- Stefanescu DM, Alonso G, Suarez R (2020)Recent Developments in Understanding Nucleation and Crystallization of Spheroidal Graphite in Iron-Carbon-Silicon Metals 10 Bericht-Nr. 221.
- Sommerfeld A, Tonn B (2008) Nucleation of graphite in cast iron melts depending on manganese, sulphur, and oxygen. International Journal of Cast Metals Research 21: 23-26.
- Zykova A, Lychagin, D, Chumaevsky, A, Popova N, Kurzina (2018) Influence of Ultrafine Particles on Structure, Mechanical Properties, and Strengthening of Ductile Cast Iron. Metals.
- Nandori G, Dul J (1982) Beurteilung von Gußeisenschmelzen durch Messung der Makrovolumenänderungen und der Ausdehnungskräfte während der Erstarrung. Giesserei-Rundschau 29: 9-16.
- Matjuschkin V, Woodland Ab, Frost DJ, Yaxley M (2020) Reduced methanebearing fluids as a source for diamond. Scientific Peports. 10: 6961, 8 pages.