Abstract
We show the relationship between supercritical fluids or melts from mantle regions with the Variscan tin mineralization in the Ehrenfriedersdorf region in Central Erzgebirge, Germany. The formation of the primary tin mineralization and the granite pegmatites are immediately triggered or generated by such fluids, which by their load of high-pressure and high-temperature minerals such as diamond, lonsdaleite, graphite, and moissanite, as well as by the orthorhombic cassiterite (CaCl2-type) show clearly his origin. At least that means that the old ideas of the formation of the tin deposit Ehrenfriedersdorf (and others) need a critical reassess.
Keywords
Supercritical fluids, Pegmatites, Melt inclusions, Immiscibility, Extreme element enrichment, Lorentzian element distribution
Introduction
From the study of silicate melt inclusions, mostly in quartz, of evolved Variscan granites and pegmatites of the Erzgebirge region, Germany, we have found in both rock types melt inclusion which forms pseudo-binary solvus curves [1]. Both curves of granites and pegmatites in the coordinates of the water content of the silicate melt versus homogenization temperature are similar. The main difference between both rocks is the frequency of the relative water-rich melt inclusions. In granites, these inclusions are significantly rarer than in pegmatites; maybe the α-β-transition of quartz caused an influx of hydrothermal water and the destruction of melt inclusions by that. However, the solvus crests of both curves lie about in the same order of water concentration, slightly lower for the pegmatites. The temperature for the granite solvus is noticeably higher, ~760 vs. 700°C for pegmatites. Figures 1a and 1b show the solvus curves for granites (a) and pegmatites (b) in the coordinates of water content versus temperature. The asymmetry of the solvus curve for the pegmatites is striking and typically for most studied pegmatites [1]. Both solidus curves for granites and pegmatites suggest a relatively simple formation process. According to Vogel (1992) [2], the immiscibility process can proceed in different steps (with different composed droplets and matrix composition). Figures 6.18, 7.27, 7.28, and 7.29 in Vogel (1992) [2] show that impressive. Using hydrothermal diamond anvil cell (HDAC) experiments on synthetic pegmatite systems, such multi-stage immiscibility processes could be visually demonstrated (see also further below).
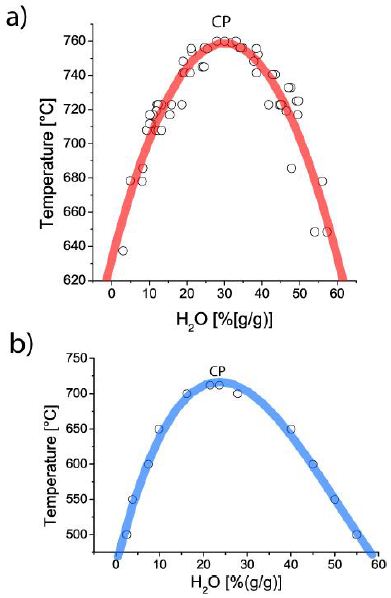
Figure 1: Solvus curves for the Variscan granites (a) and pegmatites (b) belonging to the Ehrenfriedersdorf region in central Erzgebirge, Germany. CP is the critical point.
By the rarity of melt inclusions in granites, we could, up to now, obtain no element distribution curves similar to the pegmatites for this rock. However, in some granite melt inclusions, there are also higher values of rare elements. Table 1 shows exemplary data for the Greifenstein granite near Ehrenfriedersdorf (Li, V, Zn, Rb, Nb, Cs, Ta) – see Borisova et al. 2012 [3].
Table 1: Enrichment of some elements in melt inclusions in quartz of the Greifenstein granite near Ehrenfriedersdorf, Central Erzgebirge, Germany. Clarke values according to Rösler and Lange (1975) [4].
|
Element |
Clarke for granitic rocks | MI E2 in Greifenstein granite |
Enrichment |
|
Li |
40 |
4353 | 109 |
| V | 20 | 63.2 |
3.2 |
|
Zn |
40 | 905 | 22.6 |
| Rb | 200 | 3999 |
20 |
|
Nb |
20 | 1063 | 53 |
| Cs | 5 | 526 |
105 |
|
Ta |
3.5 | 488 |
139 |
The high concentration of trace elements in the accompanying granite (Greifenstein) makes it possible that the high concentration of trace elements in the granite and those of the pegmatites have a common source. The proof for that statement is the relicts of high- pressure and high-temperature minerals (diamond, lonsdaleite, moissanite, and others coming from mantle depths.
Sample Material and Methodology
Sample Materials
The used sample material is mentioned in the text and cited in the corresponding references. Generally, we used quartz crystals from pegmatites of the Variscan Ehrenfriedersdorf tin-tungsten deposit in the Central Erzgebirge/Germany. Most samples come from pegmatites of the Sauberg mine in the South of Ehrenfriedersdorf. A detailed description is in Hösel (1994) – [5-7]. Thermometrische data on fluid inclusions are in Thomas 1982 – [8]. Studies on melt inclusions in pegmatite, mainly from the Ehrenfriedersdorf mining district, are being stimulated by Thomas (2024a) [9].
Methodology
Details for the preparation (homogenization and analyses of the melt inclusions) of the used samples are in numerous publications of the first author [8,10-13], Thomas and his coauthors [1,14-17]. For homogenization of the melt inclusions, we generally used the conventional rapid hydrothermal quenching technique at 100, 300, and 500 MPa [15] as well as the cold-seal pressure vessel homogenization technique, using CO2 (± Ar) up to temperatures, starting at 500°C, to 800°C. For the chemical analysis (main and trace elements) of the melt inclusions, we used different micro-techniques [3,14,15,18,19].
Raman Spectroscopy
From 1993, the first author used a Dilor XY Laser RamanTriple 800mm spectrometer, and starting in 2005, the Jobin-Yvon LabRam HR800 spectrometer (grading: 1,800 g/mm) equipped with an Olympus optical microscope. We used the intern 633 nm and the 325, 488, and 514 nm excitation of a Coherent Ar+ laser Model Innova 70-3, and for the UV excitation (325 nm), the 35 mW HeCd-laser. After 2022, we performed all microscopic and Raman spectroscopic studies with a petrographic polarization microscope with a rotating stage coupled with the EnSpectr Raman spectrometer R532 for reflection and transmission. The Raman spectra were recorded in the spectral range of 0–4000 cm-1 using an up to 50 mW single-mode 532 nm laser, an entrance aperture of 20 μm, a holographic grating of 1800 g/mm, and a spectral resolution ranging from 4–6 cm-1. Generally, we used an objective lens with a magnification of 100x – the Olympus long-distance LMPLFLN100x objective. The laser power on the sample is adjustable down to 0.02 mW. The Raman band positions were calibrated before and after each series of measurements using the Si band of a semiconductor-grade silicon single-crystal. The run-to-run repeatability of the line position (based on 20 measurements each) is ± 0.3 cm-1 for Si (520.4 ± 0.3 cm-1) and 0.4 cm-1 for diamond (1332.7 ± 0.4 cm-1 over the range of 80–2000 cm- 1). The FWHM = 4.26 ± 0.42 cm-1. FWHM is the Full-Width at Half Maximum. We also used a water-clear natural diamond crystal (Mining Academy Freiberg: 2453/37 from Brazil) as a diamond reference (for more information, see Thomas et al. 2022) [17].
Results
In the papers of Thomas et al. [1,20], we have shown the general results on melt inclusions in pegmatite quartz from different locations. The main results are the specific distribution of some trace and main elements, which show Gaussian or Lorentzian distributions with the water content of the pegmatite melt. The maximum of the Gaussian or Lorentzian distribution curves is mainly related to the solvus crest of the pseudo-binary melt-water system. A schematic picture shows Figure 2.
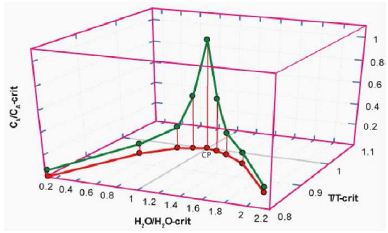
Figure 2: Schematic diagram of the solvus curve of melt-H2O systems (red) and the Lorentzian distribution of some trace and main elements (green) according to Thomas and Rericha (2024) [21]. CP is the critical point of the pseudo-binary solvus curve. Water content, temperature, and concentration are in reduced coordinates (see Guggenheim 1945) [22].
That is typical for pegmatites primarily associated with the Variscan tin-specialized granite Erzgebirge. In the case of different species of an element (e.g., phosphate or borate of Be), the maxima of molecule species are distinct. Figure 3 shows such a case for the relationship of water versus Be concentration for some pegmatites of the Ehrenfriedersdorf tin deposit.
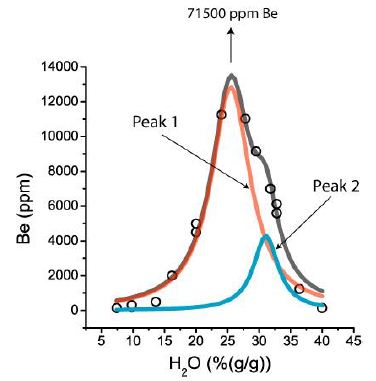
Figure 3: Distribution of Be (in ppm) in some melt inclusions in pegmatite quartz from Ehrenfriedersdorf. The sum curve (grey) results from the overlapping of two Lorentzian components caused by different Be-complexes in the melt inclusions: Peak 1 (red) for beryllonite [NaBePO4], and peak 2 (blue) for hambergite [Be2BO3(OH,F)] as daughter phases in the melt inclusions.
In Figure 3, the center of peak 1 is at 25.5 (%(g/g)) H2O, the height of the Lorentzian curve is at 12840 ppm Be, and the center of peak 2 is at 31.0 (%(g/g)) H2O and 4280 ppm Be. The highest Be value measured in a melt inclusion was 71500 ppm Be (from a large daughter crystal hambergite in a melt inclusion. Such runaway data destroy the nearby ideal Lorentzian into a pseudo-Lorentzian curve. Such runaway data are not only related to Be. We have found such a relationship, for example, for Sn and B, too (Figure 4).

Figure 4: Tin distribution in the pegmatite system Ehrenfriedersdorf (Sauberg mine). The Lorentzian maximum corresponds to about 0.6 (% (mol/mol)) SnO2. The up to now found maximal value corresponds to 1.39 (% (mol/mol)) SnO2, probably as Sn2+.
Figure 4 shows the Lorentzian plot of Sn (in ppm) versus the H2O concentration for water-rich melt inclusions in pegmatite quartz from Ehrenfriedersdorf: Area 54207, Center 25.8 (% (g/g) H2O, width 5.2 (% (g/g)) H2O, offset 547 ppm Sn, height 6606 ppm Sn. With cooling, there is also a change in the tin speciation, starting from the critical point in the direction of lower water concentration, an increase of Sn4+, and in the direction of higher water concentration, the Sn2+ bearing species increase, indicated by the arrows. Studies also show that not only species (cations and anions) are separated during the formation of the immiscibility curve, but also isotopes. At this place, we must remember that obviously, a lot of tin, in the case of Ehrenfriedersdorf, is supplied by the supercritical fluid or melt, solved in these phases or suspended as orthorhombic high-pressure and high-temperature cassiterite [21-24].
Figure 5 shows the B content of melt inclusions from pegmatite quartz, which plots a nice solvus curve. More details are given by Thomas (2002) [25]. The point over the solvus crest (CP) – 16.0 % B2O3 (= 28.42 % H3BO3) – represents an early value beyond the bulk equilibrium conditions. Similar runaway concentration data for elements (over the solvus crest) are not rare. A typical case describes Borisova et al. (2012) [3] for the extreme enrichment of zinc (75,258 ppm) and wolfram (4617 ppm) and further elements in two adjoining pegmatite inclusions. Figures 1 and 5 show pseudo-binary solvus curves. They represent equilibrium conditions obtained from homogenization experiments up to 760°C. The runaway data in Figures 3, 4, and 5 represent data trapped at higher temperatures and pressures. These are single points (melt inclusions) representing higher temperatures because, at conditions of the critical point of the solvus, the solubility of elements at higher temperatures must also be significantly higher. If they would form another complete solvus curve, more points around the critical temperature would be found. If we plot the B-concentration versus the temperature of melt inclusions from the Erzgebirge region, we obtain the following graph (Figure 6).
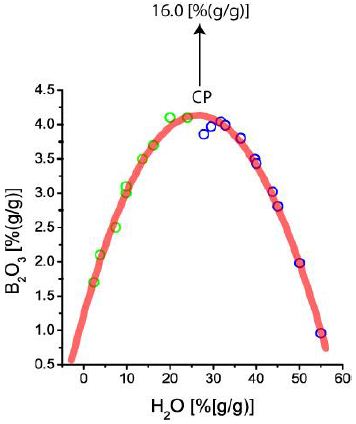
Figure 5: Boron versus water concentration in conjugate type-A (green) and type-B melt inclusions (blue) in the Ehrenfriedersdorf pegmatite quartz. Both points portray a solvus curve (melt-water system). CP is the critical point.
The plot (Figure 6) shows that the solvus curves represent the magmatic equilibrium end state and that the beginning of the evolution is at significantly higher temperatures (supercritical state) and under non-equilibrium conditions. Up to a temperature of about 500°C, the points represent the hydrothermal state, and from 500°C upwards start the pegmatitic and magmatic stages.

Figure 6: Correlation between B2O3 concentration in pegmatite melt inclusions and the homogenization temperature, mainly for the Ehrenfriedersdorf tin deposit (simplified, without standard deviations for B2O3 and T). The pegmatite and the magmatic stages end at about 500°C. Lower temperatures are typically for hydrothermal mineralizations.
Discussion
The origin of this type of element distribution is up to now unknown. Further studies have shown that the samples that show such exceptional element distribution contain minerals like diamond, lonsdaleite, moissanite, and orthorhombic cassiterite transported as solid aggregates, which are totally foreign to the parageneses in a more crustal region see Thomas et al. 2023) [26]. We interpret these as remnants of minerals coming from high-pressure and high-temperature areas – from the Earth’s mantle. Besides these solid aggregates suspended in the supercritical fluid or melt, the supercritical medium contains a lot of chemical ions. The content of solid and solved load depends on the way in which the supercritical phase moves from the mantle to the crust, which varies from place to place. If older ore deposits in the mantle by subduction are present, the origin of ore-forming elements or their more substantial enrichment is explainable. The processes of element enrichment at the transition from supercritical to critical and under-critical states and high temperatures are not well understood. Because the elements and compounds are in the melt inclusions, there are a lot of different processes working more or less simultaneously for the enrichment of elements. To obtain an idea of the complexity of pegmatite-forming processes, look at Figures 7 and 8.
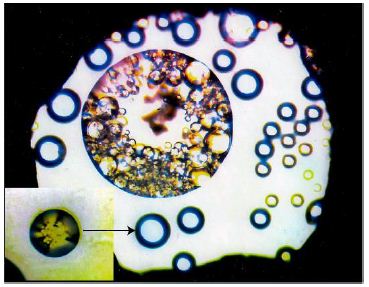
Figure 7: HDAC experiment on a synthetic pegmatite melt (740°C). All bubble-like bodies are melt droplets (see insert). The large bubble contains smaller ones with different compositions. The white field is an aqueous pegmatite phase. The gasket diameter is 400 µm (according to unpublished data by Veksler et al. 2002) [25].
From the experiences obtained in the last 55 years on the Variscan tin-tungsten deposit Ehrenfriedersdorf and the related pegmatites, the following generalizations are possible:
- Quartz crystals start to grow and trap droplets of the surrounding (quasi-supercritical) fluid.
- At high temperatures, the trapping of rare elements (B, Be, Cs, Sn) depends only on the water content level, which the solvus crest determines – that is, outside the system equilibrium.
- With further cooling, the incorporation of rare elements, according to the Lorentzian distribution,
- Further growth of the quartz crystals is related to forming a thin semipermeable quartz film closing the trapped inclusion from the surrounding, which locks up the trapped droplet.
- Diffusion exchange between inclusion and surrounding via that semipermeable film, which increases in thickness up to the end of diffusion.
- The increasing thickness of the semipermeable film determines the change in the molecules passing this barrier, too.
- At the same time, a liquid boundary layer forms around the growing quartz crystal. In this boundary layer, the concentration of SiO2 is strongly reduced, and other elements are very enriched.
- Maybe microcrystals of different minerals grow in this boundary layer via Ostwald ripening and are trapped together with droplets into the growing quartz crystal.
- Multi-step immiscibility at falling temperatures leads to a heterogenic enrichment and distribution of some elements and compounds that are trapped at different temperatures.
- The micro-crystals growing in the boundary layer also receive the ions from the bulk fluid reservoir.
- The high diffusivity and low viscosity favor the Ostwald ripening, beginning at the transition from supercritical to critical and under critical stages.
- According to HDAC experiments, we know that immiscibility processes down to the microscale work during the whole crystallization of quartz and the connected trapping process of
- At high temperatures, the forming and trapping of rare compounds, g., beryllonite and hambergite, is energetically preferred because the solubility of beryllium is also very high in supercritical fluids.
- If the temperature falls under 500-400°C, an extremely fast crystallization starts.
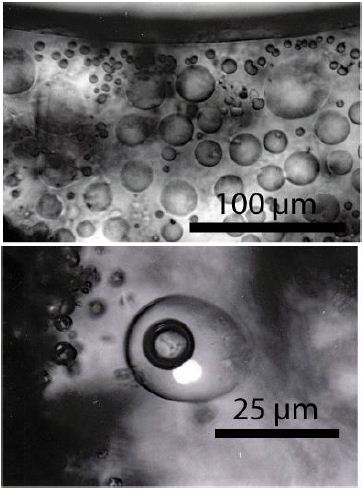
Figure 8: HDAC experiment on a synthetic pegmatite melt (up to 900°C, now at room temperature). All bubble-like grey globules are at room-temperature glass (the former melt 2 is suspended in matrix glass – melt1). The fluid inclusion in the lower photomicrograph, produced by a rapid-quench cold-seal pressure vessel experiment (900°C, 0.2 GPa) contains a vapor bubble (dark) and an H3BO3 crystal (white) in a boric acid-rich solution (see Veksler et al. 2002 [25]). The bulk H3BO3 concentration is about 8.6 [%(g/g)].
Let’s consider the results and the generalization of the complex processes related to the formation of granite pegmatites, probably triggered by supercritical fluids coming from mantle depths. We see that the old ideas of the formation of the tin deposit Ehrenfriedersdorf (and others) need a critical reassess.
Acknowledgment
We thank many colleagues very much who have supported the work on pegmatites in the last 55 years (O Leeder, J D Webster, R Bodnar, W Heinrich, P Davidson, I Veksler, E Badanina, and many others).
References
- Thomas R, Davidson P, Appel K (2019) The enhanced element enrichment in the supercritical states of granite-pegmatite systems. Acta Geochim 38: 335-349.
- Vogel W (1992) Springer. Pg: 548.
- Borisova AY, Thomas R, Salvi F, Candaudap F, Lanzanova A, et al. (2012) Tin and associated metal and metalloid geochemistry by femtosecond LA-ICP-QMS microanalysis of pegmatite-leucogranite melt and fluid inclusions: new evidence for melt-melt-fluid Mineralogical Magazine 76: 91-113.
- Rösler JH, Lange H (1975) Geochemische Leipzig. Pg: 675.
- Hösel G (1994) Das Zinnerz-Lagerstättengsebiet Ehrenfriedersdorf/Erzgebirge (1994). Freiberg. Pg: 195.
- Schröcke H (1954) Zur Paragenese erzgebirgischer Zinnlagerstätten. Neues Jahrbuch Mineralogie, Abhandlungen 87: 33-109.
- Schütze H, Stiehl G,Wetzel K, Beuge P, Haberlandt R, et al. (1983) Isotopen- und elementgeochemische sowie radiogeochronologische Aussagen zur Herkunft des Ehrenfriedersdorfer Granites. – Ableitung erster Modellvorstellungen. ZFI- Mitteilungen Leipzig 76: 232-254.
- Thomas R (1982) Ergebnisse der thermobarometrischen Untersuchungen an Flüssigkeitseinschlüssen in Mineralen der postmagmatischen Zinn-Wolfram- Mineralisation des Erzgebirges. Freiberger Forschungshefte C370, Pg: 85.
- Thomas R (2024a) Vom Schmelzeinschluss zum superkritischen Fluid – Ergebnisse und Folgen der Befahrung der Grube Sauberg bei Ehrenfriedersdorf. Veröffentlichungen Museum für Naturkunde Chemnitz 47: 59-66.
- Thomas R (2000) Determination of water contents of granite melt inclusions by confocal laser Ramanan microprobe American Mineralogist 85: 868- 872.
- Thomas R (2002) Determination of the H3BO3 concentration in fluid and melt inclusions in granite pegmatites by laser Raman microprobe spectroscopy. American mineralogist 87: 56-68.
- Thomas R, Klemm W (1997) Microthermometric study of silicate melt inclusions in Variscan granites from SE Germany: Volatile contents and entrapment conditions. Journal of Petrology 38: 1753-1765.
- Thomas R, Webster JD (2000) Strong tin enrichment in a pegmatite-forming Mineralium Deposita 35: 570-582.
- Thomas R, Förster, H-J, Rickers K, Webster JD (2005) Formation of extremely F-rich hydrous melt fractions and hydrothermal fluids during differentiation of highly evolved tin-granite magmas: a melt/fluid inclusion study. Contrib Mineral Petrol 148: 582-601.
- Thomas R, Davidson P, Rhede D, Leh M (2009) The miarolitic pegmatites from the Königshain: a contribution to understanding the genesis of Contribution to Mineralogy and Petrology 157: 505-523.
- Thomas R, Webster JD, Davidson R (2011) Be-daughter minerals in fluid and melt inclusions: Implications for the enrichment of Be in granite-pegmatite systems Contrib Mineral Petrol 161: 483-495.
- Thomas R, Davidson P, Rericha A, Recknagel U (2022a) Water-rich coesite in prismatine-granulite from Waldheim/Saxony. Veröffentlichungen Naturkunde Museum Chemnitz 45: 67-80.
- Rickers K, Thomas R, Heinrich W (2004) Trace element analysis of individual synthetic and natural fluid inclusions with synchrotron radiation XFR using Monte Carlo simulation for European Journal of Mineralogy. 16: 23-35.
- Rickers K, Thomas R, Heinrich W (2006) The chemical evolution of a water-, B- and F-rich granite-pegmatite system related to a Sn-W mineralization: a melt/fluid inclusion study. Mineralium Deposita. 41: 229-245.
- Thomas R, Davidson P, Rericha A, Voznyak, DK (2022b) Water-rich melt inclusions as “frozen” samples of the supercritical state in granites and pegmatites reveal extreme element enrichment resulting under non-equilibrium conditions. Mineralogical Journal (Ukraine). 44: 3-15.
- Thomas R, Rericha A (2024) Meaning of supercritical fluids in pegmatite formation and critical-element Geology, Earth and Marine Sciences. 6: 1-5.
- Guggenheim EA (1945) The principle of corresponding The journal of chemical physics. 13: 253-261.
- Thomas R (2024b) The CaCl2-to-rutile phase transition in SnO2 from high to low pressure in Geology, Earth and Marine Sciences. 6: 1-4.
- Thomas R (2024c) Rhomboedric cassiterite as inclusions in tetragonal cassiterite from Slavkovský les – North Bohemia (Czech Republic). Geology, Earth and Marine Sciences. 6: 1-6.
- Veksler IV, Thomas , Schmidt C (2002) Experimental evidence of three coexisting immiscible fluids in synthetic granitic pegmatite. American Mineralogist. 87: 775-779.
- Thomas R, Davidson R, Rericha A, Recknagel U (2023) Ultra-high pressure mineral inclusions in crustal rocks: Evidence for a novel trans-crustal transport mechanism. Geosciences. 94: 1-3.