Abstract
To explore the studying method for pharmacokinetics in the target site of drugs, the pharmacokinetic process of acetaminophen in the hypothalamus of rats was investigated. Male Sprague-Dawleyrats were anaesthetized and secured in a stereotaxic frame. A microdialysis probe was implanted into the hypothalamus and perfused with artificial cerebrospinal fluid at a flow rate of 2 µL/min. Adaptation for 1 h, rats were administrated with acetaminophen (150 mg/kg, i.p.) and microdialysates were collected continuously at 12-min intervals for 6 h. The acetaminophen concentrations in microdialysates were determined by HPLC-Ultraviolet detection (HPLC-UV), and the concentration-time profile and pharmacokinetic parameters of acetaminophen were calculated by DAS software. The results showed that the concentration-time curve of acetaminophen in the hypothalamus of rats was fitted to a one-compartment open model. The main pharmacokinetic parameters t1/2, Tmax, Cmax and AUCinf were (1.95 ± 0.59) h, (1.26 ± 0.22) h, (11.39 ± 2.17) µg/mL and (58.04 ± 18.39) µg·h/mL, respectively. In conclusion, by means of in vivo microdialysis approach, the pharmacokinetic process of acetaminophen in the hypothalamus of rats is investigated and an experimental method for studying pharmacokinetics of drugs in the target site is established, which is simple, feasible and reliable.
Keywords
Acetaminophen, HPLC, in vivo Microdialysis, Pharmacokinetics, Rats
Introduction
In pharmacokinetic studies, the traditional method is to measure drugs or their metabolites concentrations in blood, and calculate pharmacokinetic parameters based on the plasma drug and/or its metabolite concentrations, which are used for guiding drug administration and dosing regimens in clinic. However, the biochemical events and pharmacological effects do not usually take place in the bloodstream, but in target organs and/or tissues [1, 2]. Therefore, it is unreasonable to use the plasma drug or its metabolite concentration to in place of the target organ/tissue drug concentration for calculating pharmacokinetic parameters. For example, a study by Konings et al. [3] found that the 5-Fuorouracil concentrations in the extracellular fluid (ECF) of tumors were lower than the unbound plasma concentrations. Furthermore, especially for central nervous system (CNS) drugs, there exists significant difference between the plasma drug concentration and the CNS drug concentration because of the influence of the blood-brain barrier (BBB). Bostrom et al. [4] showed that the unbound concentrations of oxycodone in brain were higher than those in blood, due to the presence of active influx of oxycodone at the BBB.
Acetaminophen, (N – (4 – Hydroxyphenyl) acetamide), an antipyretic-analgesic drug, is widely used for the treatment of mild pain and fever. The mechanism of acetaminophen hypothermia is not fully understood, but is assumed to be related to inhibit cyclooxygenase in the CNS [5, 6] and the target site locates in the hypothalamus [7]. At recommended therapeutic doses, acetaminophen is safe and effective, however, excessive intake of acetaminophen may cause acute liver failure and even death [8–10]. And acetaminophen overdose is a major cause of liver injury in the USA and Europe [8]. Hence, more accurate and precise pharmacokinetics data of acetaminophen in the CNS (target site) should be obtained. However, so far little research has been done on the pharmacokinetics of acetaminophen at the target site.
Microdialysis, a semi-invasive probe-based sampling technique, is able to measure the unbound drug or endogenous substance concentrations in the ECF of target tissues [11], which is widely used to pharmacokinetics, metabolic as well as tissue distribution studies [1, 12, 13]. Moreover, compared with traditional sampling methods such as tissue biopsy, saliva sampling, skin blister, etc., microdialysis is currently the most appropriate, highly efficient and well-established sampling method [12, 14, 15]. The purpose of this study is to utilize the microdialysis method coupled with high performance liquid chromatography-Ultraviolet detection (HPLC-UV) to analyze the pharmacokinetic process of acetaminophen in the ECF of rats’ hypothalamus. And the results would provide suitable references for the clinical development of dosing schedules of acetaminophen. At the same time, it may also establish a new studying method for pharmacokinetics of drugs in the target tissue.
Materials and Methods
Chemicals
Acetaminophen was purchased from Anhui Yongan Pharmaceutical Co. Ltd. Urethane (ethyl carbamate) and propylene glycol were obtained from Shanghai Chemical Reagent Co. Ltd (Shanghai, China) and Hunan Erkang Pharmaceutical Co. Ltd. (Hunan, China), respectively. HPLC-grade methanol andacetic acid were purchased from Tianjin Fu Chen Chemical Reagent Factory (Tianjin, China) and Nanjing Chemical Reagent Co. Ltd. (Nanjing, China), respectively. Artificial cerebrospinal fluid (aCSF) included KCl 3.0 mM, MgCl2 1.0 mM, CaCl2 1.3 mM, NaCl 140 mM, Na2HPO4 2.0 mM and NaH2PO4 0.2 mM. Purified water from an AHJZ water purification system was used throughout the experiment. All other chemicals and reagents were of analytical grade.
Animals
Healthy male Sprague-Dawley rats, weighing 250–320g, were purchased from Qing Longshan Animal Breeding Laboratory (Nanjing, China). All animals had free access to food and tap water and were housed at a constant temperature (25 ± 2°C) with a relative humidity (60 ± 2%) under a 12 h light/dark cycle. All experimental protocols were performed in accordance with the principles of animal use and care approved by the ethnical committee of Wannan Medical College.
Chromatographic System
The chromatographic analysis was carried out on Agilent 1100 LC system (Agilent, USA), coupled to an ultraviolet detection (G1314A). The chromatographic system was used under the following condition: Ultimate XB-C18 column (4.6 × 150 mm, particle size 5μm, USA); mobile phase consisting of phosphate buffer-methanol-glacial acetic acid (90: 10: 0.25, v/v/v) at a flow rate of 1.0 mL/min; injection volume of 20 µL; Column temperature of 25°C and UV detection at 248 nm.
Microdialysis System
The microdialysis system consisted of a microinjection pump (KD Scientific, USA) connected to a 5.0 mL plastic syringe (Hamilton, USA), a MAB 85 fraction collector (Stockholm, Sweden) and a microdialysis probe (EICOM, Japan) which was inserted into the target site.
Preparation of Standard Solutions and Quality Control Samples
The acetaminophen was dissolved in aCSF for obtaining standard final concentrations of 0.25, 0.5, 2.5, 5.0, 10.0, 25.0 µg/mL. Quality control (QC) samples with low (0.5 µg/mL), medium (5.0 µg/mL) and high (25 µg/mL) were also prepared. And then 20 µL of microdialysate samples were injected into the chromatographic system for analyzing.
Selectivity, Linearity and Sensitivity
The selectivity was determined by comparing the chromatograms of blank aCSF sample, blank aCSF spiked with acetaminophen, and microdialysate sample obtained after administration of acetaminophen. To calculate the linearity, the calibration curve with six points in the range of 0.25–25.0 µg/mL was built using peak area of acetaminophen versus acetaminophen concentration. The limit of detection (LOD) was defined as the lowest concentration of analyte and calculated by signal/noise (S/N) ratio equal to 3.
Precision and Relative Recovery
Inter- and intra-day precision were calculated from replicate analysis (n = 5) of QC samples for microdialysate samples, on five consecutive days. The relative recovery was also determined by analyzing the same QC samples in replicate analysis (n = 5). The relative recovery (mean ± SD) was estimated by comparing the measured concentrations to the known concentrations. The relative standard deviation (R.S.D.%) was used to judge the precision.
In vivo Microdialysis Experiment
After rats (n = 5) were anaesthetized by the 20% urethane solution (1.2 g/kg, i.p.) and placed in a stereotaxic apparatus, a microdialysis probe was implanted stereotaxically into the hypothalamus zone (from lambda 4.0 mm posterior, 1.0 mm lateral, 8.0 mm ventral) according to the atlas of George Paxinos & Charles Wastson[16]. The probe was perfused with aCSF solution at a flow rate of 2 μL/min by a microinjection pump. After the probe was allowed to equilibrate for 1 h, the rat was treated with acetaminophen (150 mg/kg, i.p.). Then, the microdialysate samples were collected at 12-min intervals (24 µL) for 6 h and preserved at – 40°C refrigerator until analysis.
Recovery of Microdialysis Probes
The in vivo microdialysis probe recovery was determined by using a retrodialysis method [17]. For in vivo recovery, the microdialysis probe was implanted into the hypothalamus zone (above mentioned) of urethane anaesthetized rats. The microdialysis probe was perfused with aCSF solution containing acetaminophen (0.5, 5 and 10 µg/mL, respectively) at a constant flow rate of 2 μL/min by a microinjection pump. Following equilibration 1 h after probe implanted, microdialysates were collected at 12 min intervals for 1 h. And the concentrations of acetaminophen in the perfusate (Cin) and dialysate (Cout) were determined by the HPLC-UV system. The in vivo recovery was calculated by following equation: R = 1 – (Cout/Cin) × 100%.
Pharmacokinetics data
The concentrations of acetaminophen in rat microdialysates were determined from the calibration curve. The actual concentration in the ECF of hypothalamus (CHypo) were calculated from the concentrations in microdialysates (CMdia) by following equation: CHypo= CMdia/R. The observed data was used for the calculation of pharmacokinetic parameters by a one-compartment model method using DAS2.0 software. The main pharmacokinetic parameters: elimination of half-life (t1/2), peak time (Tmax), peak concentration (Cmax), and area under the concentration-time curve (AUClast, AUCinf), etc., were determined. The results are presented as mean ± standard deviation (mean ± SD). All data were analyzed by SPSS 13.0 software.
Results
Selectivity, Linearity and Sensitivity
The acetaminophen’s retention time was 7.9 min. The high selectivity was proved by the absence of interfering peak of endogenous compounds around the retention time of acetaminophen (Fig. 1). The calibration curve for acetaminophen in microdialysates (0.25–25.0 µg/mL) was fitted to a linear equation which was A = 57.467 C – 1.9726 (r = 0.9993, n = 5), where A represents the peak area of acetaminophen, and C represents the concentration of acetaminophen. The LOD of acetaminophen for the microdialysate method was 0.25 µg/mL.
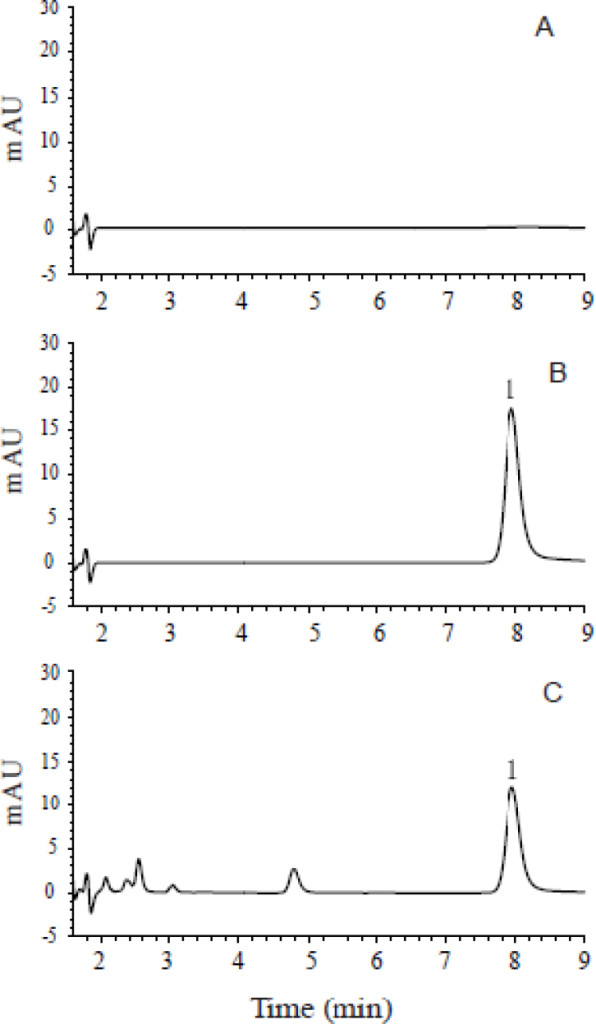
Figure 1. Chromatograms of (A) blank aCSF sample, (B) blank aCSF spiked with acetaminophen (peak 1), and (C) microdialysate sample obtained after administration of acetaminophen (peak 1). aCSF, artificial cerebrospinal fluid.
Precision and Relative Recovery
The inter- and intra-day precision and the relative recovery of the method were shown in Table 1. The inter- and intra-day precision of QC samples were 2.13%, 3.98% ,4.78%, and 2.56%, 3.44%, 6.37%, respectively. The relative recoveries of QC samples were 99.13 ± 2.17%, 99.53 ± 3.49% and 98.20 ± 5.24%, respectively. These results showed that the method had good precision and accuracy.
Recovery of Microdialysis Probe
The probe recovery determined by retrodialysis was showed in Table 2. At the concentrations of 0.5, 5.0 and 10.0 µg/mL (n = 5), the average recovery rate of microdialysis probe was 18.3%.
Table 1. The recovery rate and precision of acetaminophen in ECF (mean ± SD, n = 5)
|
Marked Conc. (µg/mL) |
Measured Conc. (µg/mL) |
Relative recovery rate (%) |
Precision (RSD, %) |
|
|
Inter-day |
Intra-day |
|||
|
25.0 |
24.78 ± 0.54 |
99.13 ± 2.17 |
2.13% |
2.56% |
|
5.0 |
4.98 ± 0.17 |
99.53 ± 3.49 |
3.98% |
3.44% |
|
0.5 |
0.49 ± 0.03 |
98.20 ± 5.24 |
4.78% |
6.37% |
All means presented are arithmetic.
ECF: Extracellular fluid; SD: Standard deviation; Conc.: Concentration; RSD: Relative standard deviation.
Table 2. The recovery rate of microdialysis probe (mean ± SD, n = 5)
|
Cin (μg/mL) |
Cout (μg/mL) |
R (%) |
|
0.50 |
0.41 ± 0.00 |
18.27 ± 0.02 |
|
5.00 |
4.08 ± 0.00 |
18.34 ± 0.02 |
|
10.00 |
8.17 ± 0.00 |
18.28 ± 0.01 |
All means presented are arithmetic.
SD, standard deviation; Cin, concentration in perfusate; Cout, concentration in dialysate.
Pharmacokinetic Process of Acetaminophen
The mean concentration vs. time profile of acetaminophen in the ECF of rats’ hypothalamus after administration (150 mg/kg. i.p.) was presented in Figure 2. The concentration-time curve of acetaminophen was fitted to a one-compartment open model, and the main pharmacokinetic parameter estimates were t1/2 = (1.95 ± 0.59) h, Tmax = (1.26 ± 0.22) h, Cmax = (11.39 ± 2.17) μg/mL, AUClast = (42.93 ± 5.39) μg·h/mL and AUCinf = (58.04 ± 18.39) μg·h/mL, as shown in Table 3.
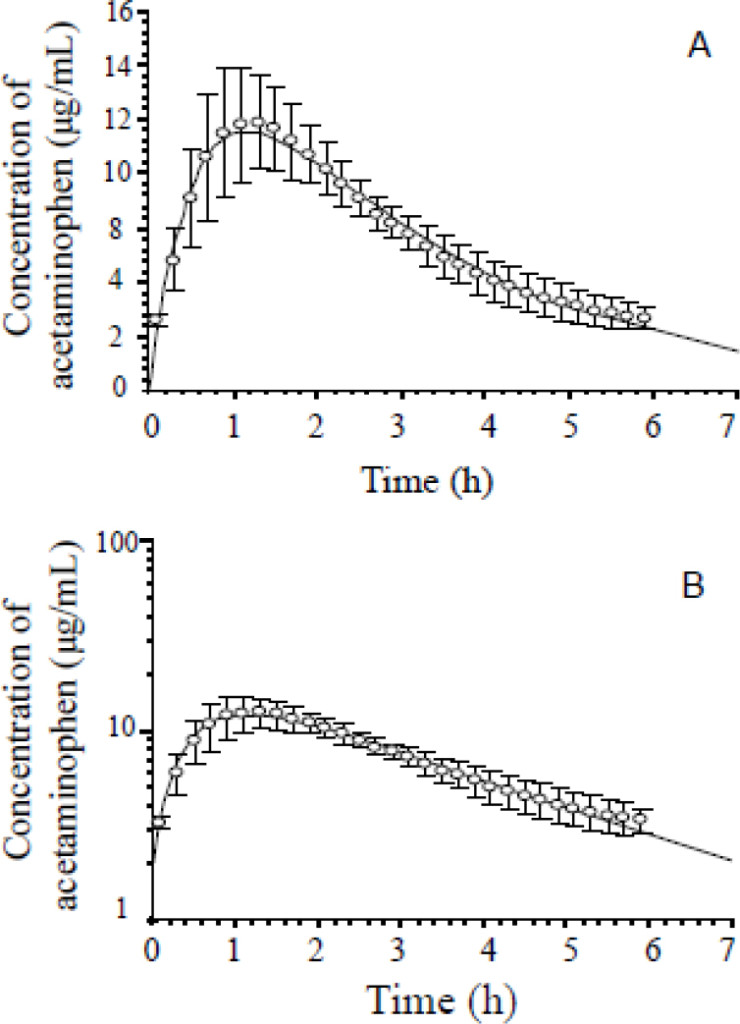
Figure 2. Mean C-T curves of acetaminophen in the hypothalamus extracellular fluid of rats after administration of acetaminophen (150 mg/kg, i.p., n = 5). (A) arithmetical C-T curve, (B) logarithmic C-T curve. C-T, concentration-time, error bars indicate standard deviation.
Table 3. Main pharmacokinetic parameters of acetaminophen (150 mg/kg, i.p.) in the ECF of rats (mean ± SD, n = 5)
|
Parameter |
Hypothalamus |
|
t1/2 (h) |
1.95 ± 0.59 |
|
Cmax (μg/mL) |
11.39 ± 2.17 |
|
AUClast (μg·h/mL) |
42.93 ± 5.39 |
|
AUCinf ( μg·h/mL) |
58.04 ± 18.39 |
|
Tmax (h) |
1.26 ± 0.22 |
All means presented are arithmetic.
ECF, extracellular fluid; SD standard deviation; t1/2, terminal elimination half-life, Cmax, maximum concentration; AUClast, area under the concentration–time profile to the last measurable concentration; AUCinf, area under the concentration–time profile from the time of dosing extrapolated to infinity; tmax, time to reach maximum concentration.
Discussion
In the present study, we used in vivo microdialysis sampling method combined with HPLC-UV to investigate the pharmacokinetics process of acetaminophen in the hypothalamus of rats which is the target site (active-site ) of acetaminophen, and obtained some main pharmacokinetic parameters, such as t1/2, Tmax, Cmax, etc. Compared with data in plasma (t1/2, Tmax and Cmax were 1.20 ± 0.30 h, 0.58 ± 0.13 h and 97.09 ± 11.08 μg/mL, respectively), the t1/2 of acetaminophen in the hypothalamus was prolonged significantly, indicating that acetaminophen eliminated more slowly in the hypothalamus. While the Tmax in the hypothalamus was 2-fold longer than that in plasma, suggesting the delayed distrib ution of acetaminophen into the hypothalamus, which might be attributed to the presence of the BBB. It is apparent that the Cmax in plasma was higher than that in the hypothalamus as the acetaminophen concentration in plasma consisted of the free (unbound) and bund concentrations of acetaminophen. All these results suggested that there were significant differences in pharmacokinetic processes between the plasma and target organs/tissues.
In general, the biochemical events and pharmacological effects do not usually take place in the bloodstream, but in target tissues [1, 2]. And active site concentrations of unbound substances are better predictors of drug effects than total plasma or whole tissue concentrations. This is partly due to the presence of active transporters at tissues, but is also due to differences in plasma protein binding and non-specific tissue binding [11]. The active-site concentrations can be defined as the concentrations of unbound, pharmacologically active substances at the site of action. In contrast, the total concentrations of the drug in plasma ⁄ organ ⁄ tissue also include the protein- or tissue-bound molecules that are pharmacologically inactive [11].
Traditionally, plasma and whole tissue concentrations are used as predictors of effects and side effects, as well as calculating pharmacokinetic parameters because of their ease of sampling, while the concentrations of unbound drug in tissue are more difficult to measure. But just as mentioned above, better predictors of drug effects are the active site concentrations of unbound substances. The results in the present study suggested that there were significant differences between pharmacokinetic parameters based on the plasma drug concentrations and active-site drug concentrations, implicating that the dosing schedule of acetaminophen in clinic should be designed according to the pharmacokinetic parameters based on the active-site drug concentration for decreasing acetaminophen-causing side effects, i.e. hepatotoxicity. Therefore, it is not accurate and precise to calculate pharmacokinetic parameters using the plasma or whole tissue concentrations for dosing schedule of drugs in clinic.
With the introduction of microdialysis, the first technique with which unbound concentrations could be easily measured in vivo. Compared with plasma or tissue sampling, the in vivo microdialysis method possesses many advantages. Firstly, in vivo microdialysis method can obtain the active site concentrations of unbound drugs [1], which can more accurately predict drug effects and calculate pharmacokinetic parameters. Secondly, the microdialysate samples obtained by in vivo microdialysis method can be directly detected by HPLC or HPLC/MS/MS because only low-molecular weight substances can be diffusible through the semi-permeable membrane [2, 18]. Yet, before detecting, the plasma or tissue samples must be dealt with by series of pretreatment, such as protein precipitation, homogenization and centrifugation, etc. These procedures were relatively complex and resulted in unreliable drug concentrations. Finally, in vivo microdialysis method can be continuously sampling without loss of the body fluid during the experiment [19], especially small animals such as mice, rats, etc. In brief, in vivo microdialysis is a simple, feasible and reliable sampling method, which is of unique advantages in pharmacokinetics study.
For in vivo microdialysis method, it is essential to obtain the recovery rate of probe for determining the actual concentration of endogenous drugs or substances, which is determined by several factors such as physicochemical properties of the analyte, semi-permeable membrane materials, diffusion coefficient and temperature [20–23]. The flow rate of microdialysis probes is also a significant factor on the recovery rate of probe increasing with lower flow rate [20]. Generally, the perfusate is usually at a flow rate from 0.1 to 5.0 μL/min. In this study, taking several factors, such as sample volume, sampling time and sensitivity to detect the analyte, into account, we thought that the ideal flow rate was 2 μL/min. Moreover, there are many methods to calibrate the recovery rate of probe, for instance, retrodialysis method [17], external standard method [24], internal standard method [25] and zero-net flux method [26]. In this study, the recovery rate of probe was determined by using the retrodialysis method, the most common calibration method.
This study provided one sample of in vivo microdialysis applications in acquiring drug concentration at the target sites for studying pharmacokinetics in rats. In fact, in vivo microdialysis has been also widely applied in humans for obtain unbound drug or endogenous substance concentrations in the ECF of target tissues/organs. La Favor et al. [27] successfully utilized microdialysis to measure in vivo reactive oxygen species in human skeletal muscle, demonstrating the feasibility of measuring both in vivo H2O2 and superoxide in the extracellular environment of human skeletal muscle. Simmel et al. [28] provided the proof of principle of long-term subcutaneous microdialysis in humans in which they developed a special setting to ensure good clinical practice compliance, tolerability, and convenience for participants and personnel. Moreover, Prolonged microdialysis sampling over several days has been used for endogenous compounds and/or drugs in humans in neonatal [29–31] and adult [32–35] diabetic patients, in patients admitted for breast reconstruction with transverse rectus abdominis muscle flaps after mastectomy [36], in patients with ischemic heart disease [37], and in patients for neurochemical monitoring or on the neurosurgical ICU [38]. Hence, unquestionably, with the development of experimental science and technology, in vivo microdialysis would be more wide and deep application in basic and clinical pharmacokinetics studies.
Conclusion
Our results reveal that there are significant differences between pharmacokinetic parameters based on the plasma drug concentration and the active-site drug concentration, implicating that the dosing schedule of drugs in clinic should be designed according to the pharmacokinetic parameters based on the active-site drug concentration. And this study provides a simple, feasible and reliable experimental method for studying pharmacokinetics of drug in the target.
Acknowledgement: This work was supported in part by grants-in-aid for the National Natural Science Foundation of China (81671318, 81171255) and the Programs for Science and Technology Development of Anhui Province (1501041157).
Conflict of interest: All authors declare no conflict of interest
Ethical approval: All experimental protocols were performed in accordance with the principles of animal use and care approved by the ethnical committee of Wannan Medical College.
References
- Azeredo FJ, Dalla Costa T, Derendorf H (2014) Role of microdialysis in pharmacokinetics and pharmacodynamics: current status and future directions. Clin Pharmacokinet 53: 205–212. [crossref]
- Chaurasia CS, Müller M, Bashaw ED, Benfeldt E, Bolinder J, et al. (2007) AAPS-FDA Workshop White Paper: Microdialysis Principles, Application and Regulatory Perspectives. Pharmaceu Res 24: 1014–1025.
- Konings IR, Sleijfer S, Mathijssen RH, de Bruijn P, van Dam LM, et al. (2011) Increasing tumoral 5-fluorouracil concentrations during a 5-day continuous infusion: a microdialysis study. Cancer Chemother Pharmacol 67: 1055–1062.
- Bostrom E, Simonsson US, Hammarlund-Udenaes M (2006) In vivo blood-brain barrier transport of oxycodone in the rat: indications for active influx and implications for pharmacokinetics/pharmacodynamics. Drug Metab Dispos 34: 1624–1631.
- Larsen FS, Wendon J (2014) Understanding paracetamol-induced liver failure. Intensive Care Med 40: 888–890. [crossref]
- Botting R, Ayoub SS (2005) COX-3 and the mechanism of action of paracetamol/acetaminophen. Prostagland Leukot Essent Fatty Acids 72: 85–87.
- Yang BF, Su DF (2013) Pharmacology. Beijing: People’s Medical Publishing House.
- Lancaster EM, Hiatt JR, Zarrinpar A (2015) Acetaminophen hepatotoxicity: an updated review. Arch Toxicol 89: 193–199. [crossref]
- Lee WM (2008) Acetaminophen-related acute liver failure in the United States. Hepato Rese Official J of the Japan Society of Hepatology 38: S3.
- Larson AM, Polson J, Fontana RJ, Davern TJ, Lalani E, et al. (2005) Acetaminophen-induced acute liver failure: results of a United States multicenter, prospective study. Hepatology 42: 1364–1372.
- Hammarlund-Udenaes M (2009) Active-site concentrations of chemicals – are they a better predictor of effect than plasma/organ/tissue concentrations?. Basic & clinical pharmacology & toxicology 106: 215–220.
- Deitchman AN, Heinrichs MT, Khaowroongrueng V, Jadhav SB, Derendorf H, et al. (2017) Utility of Microdialysis in Infectious Disease Drug Development and Dose Optimization. AAPSJ 19: 334–342. [crossref]
- Joukhadar C, Müller M (2005) Microdialysis: current applications in clinical pharmacokinetic studies and its potential role in the future. Clin Pharmacokinet. 44: 895–913.
- Jadhav SB, Khaowroongrueng V, Derendorf H (2016) Microdialysis of Large Molecules. J Pharm Sci 105: 3233–3242. [crossref]
- Brunner M, Langer O (2006) Microdialysis versus other techniques for the clinical assessment of in vivo tissue drug distribution. Aaps J 8: 263–271.
- Paxinos G, Wastson C (1997) The Rat Brain in Stereotaxic Coordinates. San Diego: Academic Press.
- Ma ZQ, Tao F, Fang H, Xu T, Hong ZY, et al. (2013) Pharmacokinetics of tramadol hydrochloride in the extracellular fluid of mouse frontal cortex studied by in vivo microdialysis. Yao Xue Xue Bao 48: 406–410.
- Johansen MJ, Newman RA, Madden T (1997) The use of microdialysis in pharmacokinetics and pharmacodynamics. Pharmacotherapy 17: 464–481. [crossref]
- Zhuang L, Xia H, Gu Y, Derendorf H, Li Y, et al. (2015) Theory and Application of Microdialysis in Pharmacokinetic Studies. Curr Drug Metab 16: 919–931. [crossref]
- Kho CM, Enche Ab Rahim SK, Ahmad ZA, Abdullah NS (2017) A Review on Microdialysis Calibration Methods: the Theory and Current Related Efforts. Molecular neurobiology. 54: 3506–3527.
- Sun H, Bungay PM, Elmquist WF (2001) Effect of capillary efflux transport inhibition on the determination of probe recovery during I n vivo microdialysis in the brain. J Pharmacol ExpTher 297: 991–1000.
- Khan SH, Shuaib A (2001) The technique of intracerebral microdialysis. Methods 23: 3–9. [crossref]
- Lange D, Boer D, Breimer DD (2000) Methodological issues in microdialysis sampling for pharmacokinetic studies. Advanced Drug Delivery Reviews 45: 125–148.
- Kit Lee MK (2013) Crosstalk the Microdialysis in Scientific Research: from Principle to its Applications. Pharmaceutica Analytica Acta 05: 276–295.
- Larsson CI (1991) The use of an “internal standard” for control of the recovery in microdialysis. Life Sci 49: 73–78. [crossref]
- Song Y, Lunte CE (1999) Comparison of calibration by delivery versus no net flux for quantitative in vivo microdialysis sampling. Anal Chimica Acta 379: 251–262.
- La Favor JD, Anderson EJ, Hickner RC (2014) Novel method for detection of reactive oxygen species in vivo in human skeletal muscle. Physiol Res 63: 387–392. [crossref]
- Simmel F, Kirbs C, Erdogan Z, Lackner E, Zeitlinger M, et al. (2013) Pilot investigation on long-term subcutaneous microdialysis: proof of principle in humans. AAPSJ 15: 95–103. [crossref]
- [crossref] Horal M, Ungerstedt U, Persson B, Westgren M, Marcus C (1995) Metabolic adaptation in IUGR neonates determined with microdialysis–a pilot study. Early Hum Dev 42: 1–14.
- Baumeister FA, Rolinski B, Busch R, Emmrich P (2001) Glucose monitoring with long-term subcutaneous microdialysis in neonates. Pediatrics 108: 1187–1192. [crossref]
- Holzinger A, Bonfig W, Kusser B, Eggermann T, Muller H, et al. (2006) Use of long-term microdialysis subcutaneous glucose monitoring in the management of neonatal diabetes A first case report. Biol neonate 89: 88–91.
- Bolinder J, Ungerstedt U, Arner P (1992) Microdialysis measurement of the absolute glucose concentration in subcutaneous adipose tissue allowing glucose monitoring in diabetic patients. Diabetologia 35: 1177–1180.
- Bolinder J, Ungerstedt U, Arner P (1993) Long-term continuous glucose monitoring with microdialysis in ambulatory insulin-dependent diabetic patients. Lancet 30 342: 1080–1085.
- Hashiguchi Y, Sakakida M, Nishida K, Uemura T, Kajiwara K, et al. (1994) Development of a miniaturized glucose monitoring system by combining a needle-type glucose sensor with microdialysis sampling method. Long-term subcutaneous tissue glucose monitoring in ambulatory diabetic patients. Diabetes care 17: 387–396.
- Lutgers HL, Hullegie LM, Hoogenberg K, Sluiter WJ, Dullaart RP, et al. (2000) Microdialysis measurement of glucose in subcutaneous adipose tissue up to three weeks in type 1 diabetic patients. Neth J Med 57: 7–12.
- Edsander-Nord A, Röjdmark J, Wickman M (2002) Metabolism in pedicled and free TRAM flaps: a comparison using the microdialysis technique. Plast Reconstr Surg 109: 664–673. [crossref]
- Kennergren C, Mantovani V, Lonnroth P, Nystrom B, Berglin E, et al. (1999) Monitoring of extracellular aspartate aminotransferase and troponin T by microdialysis during and after cardioplegic heart arrest. Cardiology 92: 162–170.
- During MJ, Fried I, Leone P, Katz A, Spencer DD, et al. (1994) Direct measurement of extracellular lactate in the human hippocampus during spontaneous seizures. J Neurochem 62: 2356–2361.