Abstract
Objective: To provide program methodology and outcomes data identifying the impact of clinical pharmacy services provided to patients with diabetes mellitus.
Design: Prospective pilot study.
Patients: Adult patients with diabetes mellitus identified by a member of the primary care team were referred to the pharmacist-led disease state management program, a patient-centered medication therapy management (MTM) program developed through university collaboration with a local Federally Qualified Health Center.
Interventions: Pharmacist-delivered disease state management and medication therapy management across three or more face-to-face encounters over the course of six months.
Main outcome measures: Clinical outcomes were followed for 6 months from the time of referral and enrollment into the program. The primary diabetes endpoint, glycosylated hemoglobin, and patient-reported experience with care were collected at baseline and the end of the study. Clinical pharmacists documented the content of clinical visits, including the number of visits per patient, duration of encounters, number and proportion of identified medication therapy problems, and the number and proportion of associated interventions to optimize pharmacotherapy.
Results: Glycosylated hemoglobin was significantly reduced versus baseline at the 6-month assessment in both the intent-to-treat (−2.7%; P < 0.0001) and the per-protocol groups (−3.0%; P < 0.0001). Patient-reported satisfaction with care was higher for the pharmacists as compared to the primary care providers with significantly more patients rating the care received from the pharmacist as excellent (P = 0.001). The pharmacists completed 158 visits, identifying and resolving an average of 7.7 medication therapy problems for each subject included in the analysis.
Conclusion: In this model of MTM, the clinical pharmacists were able to identify and resolve interventions which subsequently resulted in statistically significant reductions observed in the primary diabetes endpoint and high levels of satisfaction with care.
Background
The pharmacist’s role in direct patient care is ever evolving. Traditionally, the pharmacist’s ability to provide care to patients has been associated with the provision of a medication product. However, the past several decades have witnessed a significant expansion in how pharmacists may provide care. Unlike other healthcare providers, pharmacists are unique in their extensive training in performing medication therapy management (MTM) as part of their clinical service, whereby MTM is defined by the American Pharmacists Association (APhA) [1] as “a distinct service or group of services that optimize therapeutic outcomes for individual patients.” The goal of MTM is to promote safe and effective medication use via collaboration among pharmacists and other healthcare professionals in order to achieve optimal patient outcomes. As described by the joint framework developed by the APhA and the National Association of Chain Drug Stores Foundation, [2] MTM services incorporate five core elements:
- A medication therapy review
- A personal medical record
- A medication-related action plan
- Intervention and/or referral, and
- Documentation and follow up.
There are a large number of publications in the literature that support the role of a pharmacist in disease state management via MTM services. However, there is a relative scarcity of structured studies evaluating the potential impact of MTM in the primary care medical home. In a review of randomized-controlled trials evaluating MTM services in this setting, it was determined that the most appropriate delivery methods were those that resulted in efficient implementation of recommended interventions [3]. In those studies that demonstrated positive impact, the practice settings were associated with an educational institution and promoted pharmacist autonomy, such as through the use of collaborative practice agreements authorizing pharmacists to directly adjust medications without need to consult the primary care provider (PCP) first. Study authors concluded that in order for MTM to be successful in the primary care medical home and to benefit patient care, it should be delivered discriminately to patients with a specific therapeutic problem as determined by the PCP. Also, MTM services should involve timely communication with PCPs to discuss therapeutic problems and routine patient follow up should be incorporated into the model to support adherence to changes in therapy.
In order to add to the evidence supporting the role of clinical pharmacists in delivering MTM in the primary care collaborative practice setting and to expand our current knowledge of the role of the pharmacist in the indigent population, a descriptive report of MTM was conducted at the FOCUS Clinic in Newark, New Jersey [4]. Over the course of 8 months, there were 313 documented patient-centered pharmacist interventions (PCPIs) affecting 69 unique patients across a range of chronic illnesses, such as hypertension, diabetes mellitus, dyslipidemia, and asthma.
While this report provides preliminary evidence supporting the role of a pharmacist in the management of a variety of disease states, it does not consider clinical outcome measures. Therefore, in 2017 we began a prospective pilot study to assess the impact of adding a pharmacist to the healthcare team in a Federally Qualified Health Center (FQHC). Through this study, pharmacists provide MTM services as suggested by Kucukarslan et al [3]. in the context of a structured study protocol that quantifies MTPs and interventions while also documenting impact on clinical outcome measures. This report presents interim data demonstrating the impact of chronic disease state management by clinical pharmacists on patients with diabetes mellitus at Henry J. Austin Health Center (HJAHC) in Trenton, New Jersey.
Methods
Between March 21, 2017 and March 21, 2018, 50 patients were referred to and enrolled into the study for management of diabetes mellitus by a clinical pharmacist. To be included in the study, patients may be referred to the pharmacist by any member of the healthcare team. In instances when the patient is referred by someone other than the PCP, the PCP is contacted to ensure that the PCP agrees with and supports the referral. If the PCP does not agree with the referral, the patient is not enrolled. Patients may be enrolled if they are 18 years old or older with at least one chronic medical condition in which pharmacotherapy is indicated and the total duration of pharmacotherapy is expected to continue for at least 6 months after referral. The disease state may be newly diagnosed or pre-existing. Patients are excluded from participation if they are less than 18 years old, pregnant, or referred for a disease state that is managed by an outside provider, is not chronic, or is one in which pharmacotherapy is not indicated and/or the total duration of pharmacotherapy is not expected to continue for at least 6 months after referral. Patients are administratively withdrawn from the study under the following circumstances:
- The patient is no longer being managed by a HJAHC PCP for the referred medical condition;
- The patient misses three appointments during the study period;
- The pharmacist is unable to schedule an appointment within 30 days of a missed appointment;
- The patient does not complete a minimum of three visits within the 6 month study period or the third appointment does not occur at least 30 days prior to the ideal study close out date; or
- The patient becomes pregnant at any point during the course of the study.
Patients who are seen by an outside provider for management of the referred disease state are excluded as the pharmacists cannot work directly with that provider and will not be able to make interventions within a team-based setting. As the purpose of this study is to assess the impact a pharmacist can make on chronic disease states over a 6 month period of time through MTM, patients who do not have at least one chronic medical condition that is expected to last for at least six months and requires pharmacotherapy are excluded. Any patient who fails to adhere to the study protocol is withdrawn to allow the pharmacists to enroll additional patients who may benefit from the intervention. Pediatric patients and/or pregnant patients are excluded due to variable disease course throughout the six month period of time and potential to create a non-homogenous sample. Upon enrollment, the pharmacists collect demographic information, clinical information, including the primary outcome measure, the patient’s self-rated health, which is reported on a 5-point Likert scale, healthcare utilization over the 6 months prior to enrollment, including visits to the PCP, emergency departments visits, and hospital admissions, and the patient’s satisfaction with care as it relates to his or her PCP measured by a seven question patient-reported survey.
Patients meet with clinical pharmacists for a minimum of three study visits over the course of 6 months. Visits include a comprehensive medication review and MTM, with a specific focus on improving clinical outcomes for the referred disease state. Clinical pharmacists document all clinical measures, vital signs, and contents of the encounters in HJAHC’s Electronic Medical Record (EMR) system to make this information available to all HJAHC team members. Recommendations are also communicated to PCPs verbally or via electronic notifications within the EMR. Patients complete routine blood work as it relates to their medical conditions. Meetings with the clinical pharmacists are conducted independently or in conjunction with the PCP or other healthcare professional visits. The following data is collected at each visit:
- Date of study visit,
- Duration of study visit,
- Number and type of MTPs identified by the pharmacist, and
- Number and type of PCPIs.
Upon completion of the study, patients undergo a final study evaluation. In addition to collection of the patient’s self-rated health and healthcare utilization, the patient completes a satisfaction survey regarding care received from the pharmacist.
Outcomes
The primary outcome of this interim report is to evaluate the change in glycosylated hemoglobin (A1C) from baseline to end of study for those patients referred to the pharmacist for chronic disease state management of diabetes mellitus.
Secondarily, this report evaluates the content of the interaction between clinical pharmacists and ambulatory care patients by reporting on the frequency and duration of clinical pharmacy appointments, total number and type of MTPs identified and associated disease states, and total number and type of pharmacist-initiated interventions. Additionally, patient satisfaction with care is compared between care received from the PCP and care received from the pharmacist.
Statistical Analysis
The intention-to-treat (ITT) analysis for the primary outcome includes all the participants who had at least one additional A1C measurement after the baseline assessment and within six months of enrollment. The per-protocol (PP) population includes all participants who adhered adequately to the study protocol, which is defined as follows. The patients completed at least three visits with the clinical pharmacist with the third visit conducted no later than 30 days prior to the ideal end of study date. The patients continued to receive treatment for diabetes from a HJAHC PCP throughout the duration of the study. Patients did not miss three or more scheduled appointments with the pharmacists, and in the event that the patient did miss an appointment, that appointment was rescheduled within 30 days of the missed appointment. Patients did not become pregnant at any time during the trial.
Change in A1C is compared from baseline to end of study using two-sample T-test assuming unequal variances for the ITT analysis and a paired T-test for the PP analysis. Differences in patient satisfaction with care between care received from the PCP and the pharmacist are compared using a chi-square test. Only patients who completed both baseline and final provider satisfaction surveys are included in the analysis of patients’ satisfaction with care. Statistical analysis is performed in Microsoft Excel. Descriptive statistics are reported for the MTM analysis.
The point of care (POC) A1C machine used to measure the A1C is unable to detect the exact value for any A1C that is greater than 15%. Therefore, the A1C value is reported as 15% for any patient who experienced an undetectable A1C greater than 15% at baseline.
Results
Participant Population
Fifty patients were referred and enrolled into the study between March 21, 2017 and March 21, 2018 for management of diabetes mellitus. Of those patients, 47 were referred for type 2 diabetes mellitus (T2DM), one was referred for type 1 diabetes mellitus, one was referred for gestational diabetes, and one was referred for pre-diabetes. Thirty-one patients were referred by a nurse practitioner, 18 by a physician, and one by a registered dietician. Of the 50 patients referred and enrolled into the study, 27 patients were included in the ITT population and 15 were included in the PP analysis. All patients included in either analysis were referred for T2DM. Demographic information for the patients included in the ITT analysis is summarized in (Table 1).
Table 1. Demographic Data
|
Age (mean ± SD years) |
53 ± 11.9 |
|
Sex, n (%) |
|
|
Female |
16 (59.3) |
|
Male |
11 (40.7) |
|
Race, n (%) |
|
|
Back or African American |
18 (66.7) |
|
White |
9 (33.3) |
|
Highest Level of Education, n (%) |
|
|
None |
1 (3.7) |
|
Elementary/Middle School |
5 (18.5) |
|
Some High School |
3 (11.1) |
|
High School Degree |
8 (29.6) |
|
Some College |
2 (7.4) |
|
Associate Degree |
5 (18.5) |
|
Declined to Answer |
3 (11.1) |
|
Employment Status, n (%) |
|
|
None |
17 (63.0) |
|
Part Time |
3 (11.1) |
|
Full Time |
5 (18.5) |
|
Declined to Answer |
2 (7.4) |
|
Annual Income, n (%) |
|
|
$0 to $4999 |
9 (33.3) |
|
$5000 to $9999 |
2 (7.4) |
|
$10000 to $14999 |
1 (3.7) |
|
$20000 to $25000 |
4 (14.8) |
|
Greater than $25000 |
2 (7.4) |
|
Declined to Answer |
9 (33.3) |
|
Housing Status, n (%) |
|
|
Renting |
12 (44.4) |
|
Living with Others |
5 (18.5) |
|
Living in Own Home |
4 (14.8) |
|
Living in Public Housing |
2 (7.4) |
|
Declined to Answer |
4 (14.8) |
|
Number of Comorbidities (mean ± SD) |
3.2 ± 1.8 |
|
Years with Diabetes (mean ± SD) |
12.1 ± 9.9 (n = 26) |
Of the 27 patients with at least one additional A1C result prior to the end of the study period, twelve patients were not included in the PP analysis. Three patients were lost to follow up, three patients did not reschedule a missed appointment within 30 days, two patients did not complete three visits with the pharmacists within the study period, two patients transferred care to an outside facility, one patient missed three appointments within the study period, and one patient was inappropriately enrolled into the study for diabetes management as the patient was referred for medication reconciliation. Four of the 27 patients included in the ITT analysis were newly diagnosed with T2DM at the time of referral.
Impact on A1C
Impact on A1C for the ITT and PP groups are summarized in Figures 1a and 1b. For the 27 subjects included in the ITT analysis, the mean baseline and final A1C results were 11.1% and 8.4%, respectively, resulting in a mean reduction in A1C of 2.7% (P=0.00003). For the 15 subjects included in the PP analysis, the mean baseline A1C was 10.9% and the mean final A1C was 7.9% to provide a mean reduction of 3% (P = 0.00007). (Figure 1a, 1b).

Figure 1a. Impact of Pharmacist Management of Diabetes on A1C for Intent-To-Treat Population
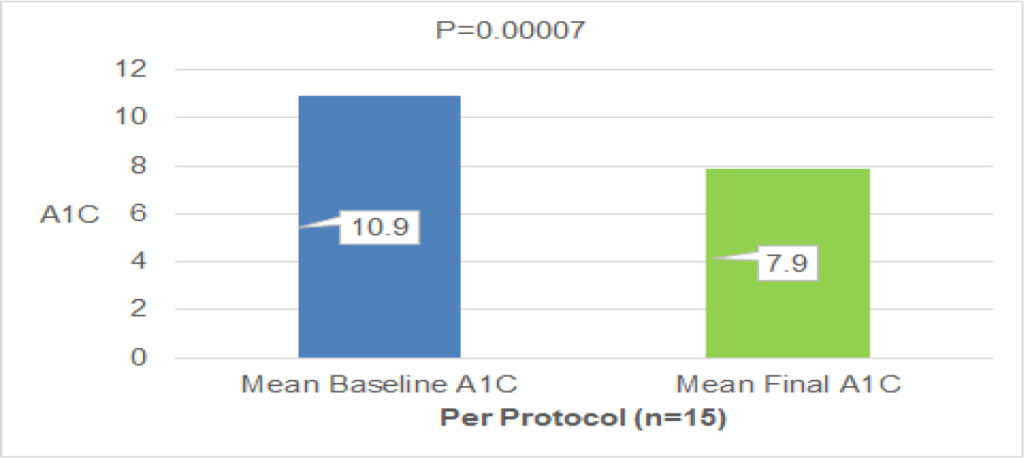
Figure 1b. Impact of Pharmacist Management of Diabetes on A1C for Per Protocol Population
Medication Therapy Management
Overall, the pharmacists conducted 158 visits with those patients included in the ITT analysis. During these visits, the pharmacists identified a total of 209 MTPs and associated PCPIs (Table 2).
Table 2. Summary of Medication Therapy Management Visits
|
Number of Patients Included in Analysis (n) |
27 |
|
Number of Visits with the Pharmacist (n) |
158 |
|
Average Duration of Visits with the Pharmacist (minutes) |
26.2 |
|
Total Number of Medication Therapy Problems Identified (n) |
209 |
|
Average Number of Interventions Per Visit (n) |
1.3 |
|
Average Number of Interventions Per Patient (n) |
7.7 |
The most common disease states requiring pharmacist intervention were T2DM (61.2%), hypertension (11.5%), dyslipidemia (5.3%), and vitamin D deficiency (3.3%). The most common MTPs identified by the pharmacists included an indication for additional medication therapy (29.7%), medication nonadherence (26.8%), sub-therapeutic medication dosage (20.5%), and presence of an adverse drug reaction (10.0%). Common associated PCPIs included counseling the patient or caregiver (35.4%), initiating therapy (30.1%), increasing dosage (20.6%), and discontinuing therapy (7.2%).
(Table 3) provides a summary of the number of patients for whom diabetic medication therapy required adjustment and the types of interventions made.
Table 3. Patients Requiring Adjustment of Diabetes Medication Therapy
|
Type of Intervention |
Number of Patients [n (%)] |
|
|
Any Intervention to Adjust Therapy |
23 |
85.2 |
|
Dose Adjustment |
17 |
63.0 |
|
Initiation of Therapy |
16 |
59.3 |
|
Discontinuation of Therapy |
5 |
18.5 |
|
Change in Formulation |
3 |
11.1 |
|
Change in Frequency of Administration |
1 |
3.7 |
(Table 4) highlights the number of patients for whom other interventions were recommended by the pharmacy team with relative frequency.
Table 4. Patients Requiring Other Interventions
|
Type of Intervention |
Number of Patients [n(%)] |
|
|
Identification and Management of Nonadherence to Any Medication |
18 |
66.7 |
|
Identification and Management of Adverse Drug Reaction to Any Medication |
17 |
63.0 |
|
Initiation or Adjustment of Antihypertensive for Uncontrolled Blood Pressure |
10 |
37.0 |
|
Initiation of Vitamin D Therapy |
6 |
22.2 |
|
Initiation of Vaccination |
6 |
22.2 |
|
Initiation or Adjustment of Statin Therapy Based on ASCVD Risk |
5 |
18.5 |
|
Initiation of Antiplatelet Therapy Based on ASCVD Risk |
4 |
14.8 |
|
ASCVD = Atherosclerotic Cardiovascular Disease |
||
Patient Satisfaction with Care
Eleven patients finished the study and successfully completed both pre-study and post-study provider satisfaction surveys. Two of the 11 patients (18.2%) reported an excellent experience with the PCP whereas 10 of the 11 patients (90.9%) reported an excellent experience with the pharmacist (P = 0.001). A comprehensive listing of all evaluated satisfaction criteria is listed in (Table 5).
Table 5. Patient Experience with Medical Provider Survey
|
Satisfaction Criterion |
Provider n (%) |
Pharmacist n (%) |
P-value |
|
The provider always explains things in a way that is easy to understand |
4 (36.3) |
11 (100) |
0.001* |
|
The provider always listens carefully to the patient |
11 (100) |
11 (100) |
– |
|
The provider always asks the patient to describe how the patient follows the provider’s instructions |
7 (63.6) |
11 (100) |
0.027* |
|
The provider has talked with the patient about, or helped the patient to make, specific goals for the patient’s health |
9 (81.8) |
11 (100) |
0.138 |
|
The provider has asked the patient if there was a period of time when the patient felt sad, empty, or depressed |
6 (54.5) |
11 (100) |
0.011* |
|
The provider has talked with the patient about, or offered to talk to the patient about, a personal or family problem, alcohol or drug use, or mental and emotional illness |
4 (36.3) |
10 (90.9) |
0.008* |
|
The patient’s experience with the provider was rated as excellent |
2 (18.2) |
10 (90.9) |
0.001* |
|
*Statistically significant P-values |
|||
Discussion
It is estimated that approximately 30.3 million people of all ages have diabetes in the United States, with higher prevalence noted among Asians, non-Hispanic blacks, and Hispanics as compared to their non-Hispanic white counterparts. Prevalence of diabetes also varies significantly by education level, a marker for socioeconomic status, with higher rates among those of lower academic achievement. Uncontrolled diabetes is associated with a number of significant complications, including cardiovascular disease, extremity amputation, and diabetic ketoacidosis. As such, diabetes is a leading cause of death in the United States, ranking seventh in 2015, and results in significant healthcare costs. Total healthcare costs associated with diabetes in 2012 was 245 billion US dollars, and after adjusting for age group and sex, average medical expenditures among patients with diabetes were about 2.3 times higher than expenditures for those without diabetes [5].
Given the significant morbidity and mortality associated with diabetes, it is of paramount importance to explore novel methods of delivering healthcare services to this vulnerable population. One of the challenges facing the nation’s ability to adequately manage diabetes is the projected physician shortage over the next decade. It is estimated that due to population growth, an increase in the number of aging Americans, and retirement of practicing physicians, the United States could experience a shortage of up to 120,000 physicians by the year 2030. More specifically, the United States may experience a deficit of between 14,800 and 49,800 primary care physicians by the same year [6].
When considering this looming barrier, it is necessary to reflect upon how other members of the healthcare team may complement the physician and increase access to care. One of the methods of addressing this need is via disease state management by clinical pharmacists. This study adds to the growing body of literature to support the role of pharmacist-provided disease state management in the primary care setting, particularly as it relates to the management and control of T2DM.
Because patients included in the analysis were referred from PCPs, baseline A1C results are representative of level of disease state control when managed by the PCP alone, with the exception of four patients who were newly diagnosed with diabetes at the time of referral. Final study results are representative of the care provided by the clinical pharmacist via direct collaboration with the PCP. Mean reductions in A1C of 2.7% and 3% in the ITT and PP analyses, respectively, show that clinical outcomes can be improved when patients receive additional care from the clinical pharmacist in an FQHC. It is possible that the impact on A1C was even larger than reported as the baseline A1C values for two of the patients was not precise. For these two patients, the POC result was > 15% and the baseline result with labeled as 15% per protocol. By listing this number as 15%, the baseline A1C value is underestimated. Additionally, provider satisfaction survey results show that patients report receiving a high level of care from clinical pharmacists. With the exception of goal-setting and listening carefully to the patient, results of which were high for both PCPs and pharmacists, results for the pharmacists were statistically significantly higher than for the PCP regarding all other criteria. Though the focus of this interim analysis is management of diabetes mellitus, results from the MTM analysis indicate that pharmacists are able to manage a number of interrelated disease states. This demonstrates the comprehensive nature of disease state management.
Limitations
While results are compelling, one key limitation of this study is the lack of an active control arm. Without such, it may be argued that the improvement in outcomes is not solely due to the study intervention. This is particularly true for those patients who were newly diagnosed. While the baseline A1C may serve as a historic control for those patients with preexisting diabetes, this is not the case for patients who are new to treatment. To confirm that the results are truly due to pharmacist-delivered disease state management, a more robust study including an active control arm is advised.
Fortunately, similar studies have been conducted in patients with T2DM in which a control arm was included. For example, Brummel AR, et al [6]. published a study in which patients were invited to receive MTM services from pharmacists across a large healthcare organization. In this evaluation, patients who had diabetes and received MTM services were compared to a random sample of patients with diabetes who did not receive the service but were eligible to do so. While the magnitude of A1C reduction was not as large as what was seen in our study, when considering difference-in-differences, the results remained statistically significant. Results from this study indicate that even when a control arm is included, disease state management impacts clinical outcome measures.
Another limitation of our study was the lack of an economical evaluation. A key challenge when implementing pharmacy within the primary care medical home is the questionable cost-effectiveness of such an intervention. Considering that pharmacists are not recognized as medical providers in all states, reimbursement from third party payers for clinical pharmacy services is limited. However, a number of studies have been conducted that indicate pharmacist-led pharmacotherapy management of T2DM can improve clinical outcomes and result in a reduction in overall costs associated with the disease [7–10].
Finally, the number of patients included in our study was relatively small. As nearly 50% of patients were lost to follow up, this could have self-selected for the more adherent patients to be included in the analysis. Nonetheless, our results indicate statistically significant improvement in A1C. A larger sample size would be advised in order to determine if there is impact on healthcare utilization, which may offer additional insight into potential cost-savings. As this is an interim analysis, it is anticipated that the sample size will continue to grow, allowing for a more robust evaluation regarding cost-effectiveness. In addition, as the study progresses, a comparison arm may be included to control for potential confounders.
Conclusion
In summary, our analyses demonstrate that clinical pharmacists can improve clinical outcomes in patients with diabetes in an FQHC and that patients report high levels of satisfaction in the care that they receive. Therefore, primary care settings should consider methods of incorporating clinical pharmacist services into the healthcare model to increase patient access to MTM.
Acknowledgments
The authors would like to thank the following individuals for providing valuable assistance with data collection:
Dana Chippi, PharmD Candidate, 2019
Jinsu Im, PharmD Candidate, 2019
Young Kim, PharmD Candidate, 2019
Affan Aamir, PharmD Candidate, 2021
Nandini Patel, PharmD Candidate, 2020
Author Disclosure Statement
Drs. McCarthy and Bateman are employees of the Ernest Mario School of Pharmacy at Rutgers, the State University of New Jersey and practice clinical pharmacy at HJAHC. Drs. McCarthy and Bateman disclose no conflicts of interest in the research, authorship, and/or publication of this article.
References
- Medication Therapy Management (MTM) (2018) American Pharmacists Association Foundation website. https://www.aphafoundation.org/medication-therapy-management. Accessed September 30, 2018.
- American Pharmacists Association; National Association of Chain Drug Stores Foundation (2008) Medication therapy management in pharmacy practice: core elements of an MTM service model (version 2.0). J Am Pharm Assoc (2003) 48: 341–353.
- Kucukarslan SN, Hagan AM, Shimp LA, Gaither CA, Lewis NJ (2011) Integrating medication therapy management in the primary care medical home: A review of randomized controlled trials. Am J Health Syst Pharm 68: 335–345.
- McCarthy C, Gunkel K, Willard S, Findley PA, Wagner M (2014) Impact of neuropsychiatric pharmacists on an urban interdisciplinary primary care collaborative practice [abstract]. Journal of Pharmacy Practice 27: 318.
- Centers for Disease Control and Prevention (2017) National Diabetes Statistics Report, 2017. Atlanta, GA: Centers for Disease Control and Prevention, U.S. Dept of Health and Human Services; 2017.
- Association of American Medical Colleges (2018) New Research Shows Increasing Physician Shortages in Both Primary and Specialty Care. Published April 11, 2018. Accessed September 30, 2018.
- Monte SV, Slazak EM, Albanese NP, Adelman M, Rao G, et al. (2009) Clinical and economic impact of a diabetes clinical pharmacy service program in a university and primary care-based collaboration model. J Am Pharm Assoc (2003) 49: 200–208.
- Fera T, Bluml BM, Ellis WM (2009) Diabetes Ten City Challenge: final economic and clinical results. J Am Pharm Assoc (2003) 49: 383–391. [crossref]
- Brummel A, Lustig A, Westrich K, Evans MA, Plank GS, et al. (2014) Best practices: improving patient outcomes and costs in an ACO through comprehensive medication therapy management. J Manag Care Spec Pharm. 20: 1152–1158.
- Jameson JP, Baty PJ (2010) Pharmacist collaborative management of poorly controlled diabetes mellitus: a randomized controlled trial. Am J Manag Care 16: 250–255.