Abstract
We present an exploratory study to understand the mind of people with respect to what they want from caregivers. Using experimental design of ideas, we present typical respondents with mixtures of ideas about caregivers, obtain a response, and deconstruct the response to the contribution of the component ideas. The decomposition revealed three mind-set segments: Devotion to the job and to the well-being of the patient; Treat them like family; Focus on empathy, respect, and competence. The mind-sets can be found in the population at large through the use of a PVI (personal viewpoint identifier). The study using Mind Genomics opens up the possibility of better understanding the mind and inner world of professional caregiving, and suggest the different psychological needs and wants of the professional caregiver, a long-neglected group.
Introduction
As chronic illness is expanding and life expectancy is growing the focus on ideals for professional caregivers for the aging ill is introduced. Ideals are translated into daily conduct and living circumstances that are vitally linked to well-being and life quality. Ideals held by nursing homes often do not represent ideals held by professional caregivers [1].
Since agitated patients create a heavy burden on professional caregivers, qualified professional caregivers perceived subjective values such as alleviating anxiety and striving for a peaceful and calm environment as very important [2]. Objective values that are linked to contributions of professional caregivers to a high quality of life were: empowering patients to choose for themselves; going outside; offering pleasant experiences, recognizing their mental world as being authentic; encouraging being active and; facilitating the freedom of movement [2]. There may be conflicting ideals in some cases between safety and being active or empowerment and provoking anxiety.
Daily caregivers, however, were mostly concerned with promoting pleasant experiences for patients [1]. Qualified professional caregivers were characterized by being attentive, empathetic, understanding; listening and assuring Safety. There is a paucity of research on the public expectations from caregivers. This study stimulates a discussion as to attributes of professional caregivers in the framework of a good life quality.
Since care and assistance for the ill are no longer limited to compensating for the functional consequences of the chronic illness, caregiving today aims at preserving quality in life of people with chronic illness, particularly in psychogeriatric. Thus, professional caregivers aspire to create the best possible quality of life to clients they care for.
In the literature dimensions of quality of life are: safety, privacy, self-determination and freedom, being useful/giving meaning to life and spirituality [3]. But the strongest effects on quality of life as shared by chronically ill people with professional caregivers are health and illness, mobility, deafness, being able to do less and less, not knowing the way anymore and forgetfulness [4].
Interviewed people with caregivers who fully understood questions outlined various aspects of caregivers that contribute to their life quality: cheerfulness, happiness, being happy with life, humor, tranquility, being allowed to express positive feelings and/or being approached by others in a positive manner. Chronically ill people at home mentioned nature, good and bad weather, and listening to classical music as contributing to life quality [5]
Nursing home resident with caregivers added self-esteem, self-image, being involved in the things around you, living in the midst of your family, feeling attached, being understood and being accepted as positively influenced their quality of life [6]. People who live in nursing homes for long derive much support from relationships and for them seeing the grandchildren, the partner, knowing that they are doing well and that the contact with them is good greatly affects their life quality [7]. Residents of nursing home perceived attention they are get, making friends, feeling loved, communication, one-on-one contact, and contacts with professional caregivers as mostly influencing their quality of life [8,9].
In addition, they also mention hobbies such as reading, watching television, watching movies, taking walks and going on vacation. The absence of favorite activities decreases life quality.
This study examines perceptions of people as to what makes a good professional caregiver. This study aims at developing the mind-genomics of caregiving attributes that affect quality of life. The science of Mind-Genomics will provide preconditions for making professional caregiving more effective, customer-driven, customer-oriented to enhance quality of life.
Issues with Knowing what is Important
Discovering what is important to people has become increasingly important in our service-oriented economy. As individuals live longer, have more disposable income, and more choices, a knowledge about what people ‘want’ becomes a strategic advantage both for driving choice, and for driving satisfaction.
There is no shortage today of studies on what is important. In virtually every sphere of human endeavor, researchers, business people, and even those who provide the specific service want to need, and in fact need to know ‘how am I doing?’ and ‘what is important to you?’ The enthronement of such information is such that there is a whole field of science and application called ‘customer satisfaction,’ featuring questionnaires, scoring methods, and so forth. On the simplest side, consultant Fred Reicheld, for example, has stated that there is only one question that one needs to answer about satisfaction, and that is ‘would you recommend this to your friends?’ [10] On the other, more complex side, are various handbooks of marketing and services scales [11].
Simply having a plethora of questions and scales does not tell us what is important. We know that the scales cover different aspects of service, but there is also the ongoing realization that people differ from each other. Marketers have long since recognized that these person-to-person differences are not random, but may come from fundamentally different groups in the populations, psychographic segments [12].
The Contribution of Mind Genomics
Mind Genomics is a recently emerging science which deals with the way people make decisions. The fundamental notion is that individuals have frames of reference for the products and experiences of everyday life. These frames of references are unknown but can be uncovered experimentally by presenting respondents with different combinations of statements about a situation of experience, obtain ratings, and deconstruct the response to the contribution of each statement. When the statements with specifics of an experience, one sees quickly which elements are ‘important’ and which are either only modestly relevant or even complete irrelevant.
Through experiments, Mind Genomics continues to the reveal that for almost all situations encountered in normal life, there are a variety of different frames of reference, or mind-sets. These mind-sets can be uncovered through experimentation, and specifically by clustering the pattern of respondents for different individuals. Mind Genomics reveals that for most situations, there are a limited number of mind-sets or basic frames of references, usually two or three, occasionally one or two more.
For this study, the Mind Genomics experiment involves a set of steps, beginning with a topic (what makes a good caregiver), proceeding to four questions, and then providing four answers to each question, or a total of 16 answers. The four questions ‘tell a story,’ and are used to elicit the four answers. It is the answers which provide specific information.
Table 1 presents the four questions and the four sets of four answers. By the nature of caregiving, there are many more facets to explore. The objective of Mind Genomics is to provide cartography of the situation, and not an exhaustive, complete answer. Mind Genomics has been designed to understand limited parts of an experience in a way that is easy, quick, inexpensive, and instructive. Thus, in the world of Mind Genomics, it is not one long, expensive, comprehensive study which provides the answer, but rather a series of short, simple, focused studies, whose data provide, in combination, much of the information needed to understand the topic.
Table 1. The four questions, and four answers for each question regarding what makes a good caregiver
|
Question 1 – what does it take to be a good care manager? |
|
|
A1 |
having the ability to ensure all residents are been treated equally. |
|
A2 |
be devoted and dedicated to your job |
|
A3 |
treat all residents with respect, love and dignity |
|
A4 |
be understanding, self-sufficient and very patient. |
|
Question 2 – How do you know a resident needs help? |
|
|
B1 |
sometimes they tend to pace back and forth which can be very unusual |
|
B2 |
they make uncomfortable noise which can be a sign for medical treatment or simply need to be taken to the bathroom |
|
B3 |
most residents are unable to speak so it’s also good to pay attention |
|
B4 |
be alert |
|
Question 3 – How should you communicate with your resident? |
|
|
C1 |
ensure you speak softly, kind and very clear and understanding manner |
|
C2 |
speak so they are able to hear you |
|
C3 |
speak to them with respect |
|
C4 |
listen to their complaints and try to figure out a way to assist them |
|
Question 4 – how should you treat your resident at all times? |
|
|
D1 |
protect them |
|
D2 |
show them love, gratitude let them feel at home like family |
|
D3 |
show acknowledgment instead of letting them feel invisible |
|
D4 |
try spending as much time with them |
The Test Stimuli – Vignettes
In most survey research the respondent is presented with one question at a time, and instructed to answer that question. This type of research relies on the memory of the respondent, as well as on the attitude of the respondent towards the specific topic. There is always the problem that the respondent will answer the question in the way that the respondent feels the question ‘should be answered.’ This ‘interviewer’ bias occurs because the respondent wants to please the interviewer, as well as be considered to be appropriate and ‘politically correct.’
Mind Genomics gets around the problem of interviewer bias and political correctness, giving the appropriate response, by present the stimuli in the form of combination statements (so-called vignettes), getting the respondent to rate the entire vignette as a single entity, and then deconstructing the response to a set of vignettes into the part-worth contribution of the component statements using OLS, ordinary least squares regression.
The intellectual origins of the Mind Genomics approach, working with combinations and then deconstructing the response, come from the field of mathematical psychology known as conjoint measurement [13] The underlying notion is that people respond to combinations of messages in everyday life, knowing almost intuitively what they like, and what they do not like. In daily life the norm is to be exposed to these combinations, and for decisions to emerge rapidly, without conscious deconstruction into the components. Of course, the respondent can always justify the response to these combinations, but the judgment is automatic. And thus, Mind Genomics mirrors the behavior of ordinary life.
The test vignettes are created by experimental design. For this particular version of Mind Genomics, comprising four questions or silos, and four answers or elements, the experimental design dictates 24 combinations, with each of the combinations of vignettes comprising 2–4 answers or elements. Each vignette comprises at most one element or answer. The design ensures that most of the combinations are incomplete.
Table 2 shows the basic experimental design for one respondent. Each respondent, in turn, evaluates a unique set of 24 vignettes, created by different versions of the experimental design. The structure of the underlying experimental design is maintained. The only difference is the specific combinations, which differ from respondent to respondent. This strategy ensures that Mind Genomics covers a wide number of alternative combinations in the study, a strategy similar to the MRI for studying the brain, which takes many ‘pictures’, combining them to form a picture of the brain.
The Respondent Experience
Table 2. Experimental design underlying the vignettes
|
A |
B |
C |
D |
Number of elements |
|
4 |
4 |
3 |
2 |
4 |
|
0 |
2 |
1 |
4 |
3 |
|
3 |
4 |
0 |
4 |
3 |
|
2 |
1 |
0 |
2 |
3 |
|
2 |
4 |
4 |
0 |
3 |
|
2 |
4 |
2 |
3 |
4 |
|
1 |
1 |
2 |
4 |
4 |
|
4 |
2 |
0 |
2 |
3 |
|
3 |
1 |
1 |
2 |
4 |
|
0 |
1 |
2 |
1 |
3 |
|
1 |
0 |
3 |
1 |
3 |
|
4 |
1 |
3 |
3 |
4 |
|
0 |
3 |
3 |
4 |
3 |
|
2 |
2 |
4 |
0 |
3 |
|
4 |
3 |
2 |
1 |
4 |
|
3 |
0 |
1 |
1 |
3 |
|
0 |
4 |
4 |
2 |
3 |
|
1 |
2 |
3 |
1 |
4 |
|
1 |
0 |
4 |
0 |
2 |
|
4 |
3 |
0 |
0 |
2 |
|
1 |
3 |
1 |
3 |
4 |
|
3 |
2 |
2 |
3 |
4 |
|
2 |
0 |
1 |
4 |
3 |
|
3 |
3 |
4 |
3 |
4 |
Mind Genomics studies are executed on the web. The respondent is invited through a panel provider, here Luc.id, Inc. The panel provider specializes in the recruitment of respondents for these types of short studies. For this study we simply requested an approximately even break in terms of the proportion of male versus female respondents, and an approximately even distribution across ages.
The actual experience, taking a total of 4–5 minutes, began with the invitation. The respondents, motivated to participate by their membership in the Luc.id panels, responded to the email invitation by clicking an embedded link. The respondents were led to an orientation page, explaining the study in general terms. The respondents then completed a classification page, requesting information about age, gender, and a third classification about whether the respondent was a caregiver. About half the respondents participate as caregivers in one way or another (26 of 56 respondents.)
Figure 1 shows an example of the vignette. The vignette presents the introduction, the 2–4 elements or answers centered and stacked on atop the other, and then the rating question at the bottom. The format makes it easy for the respondent to examine the vignette and assign a rating. The information presented is most important. Of far less importance is the way the vignette ‘looks.’ As long as the respondent can locate the relevant information, the format does its job.
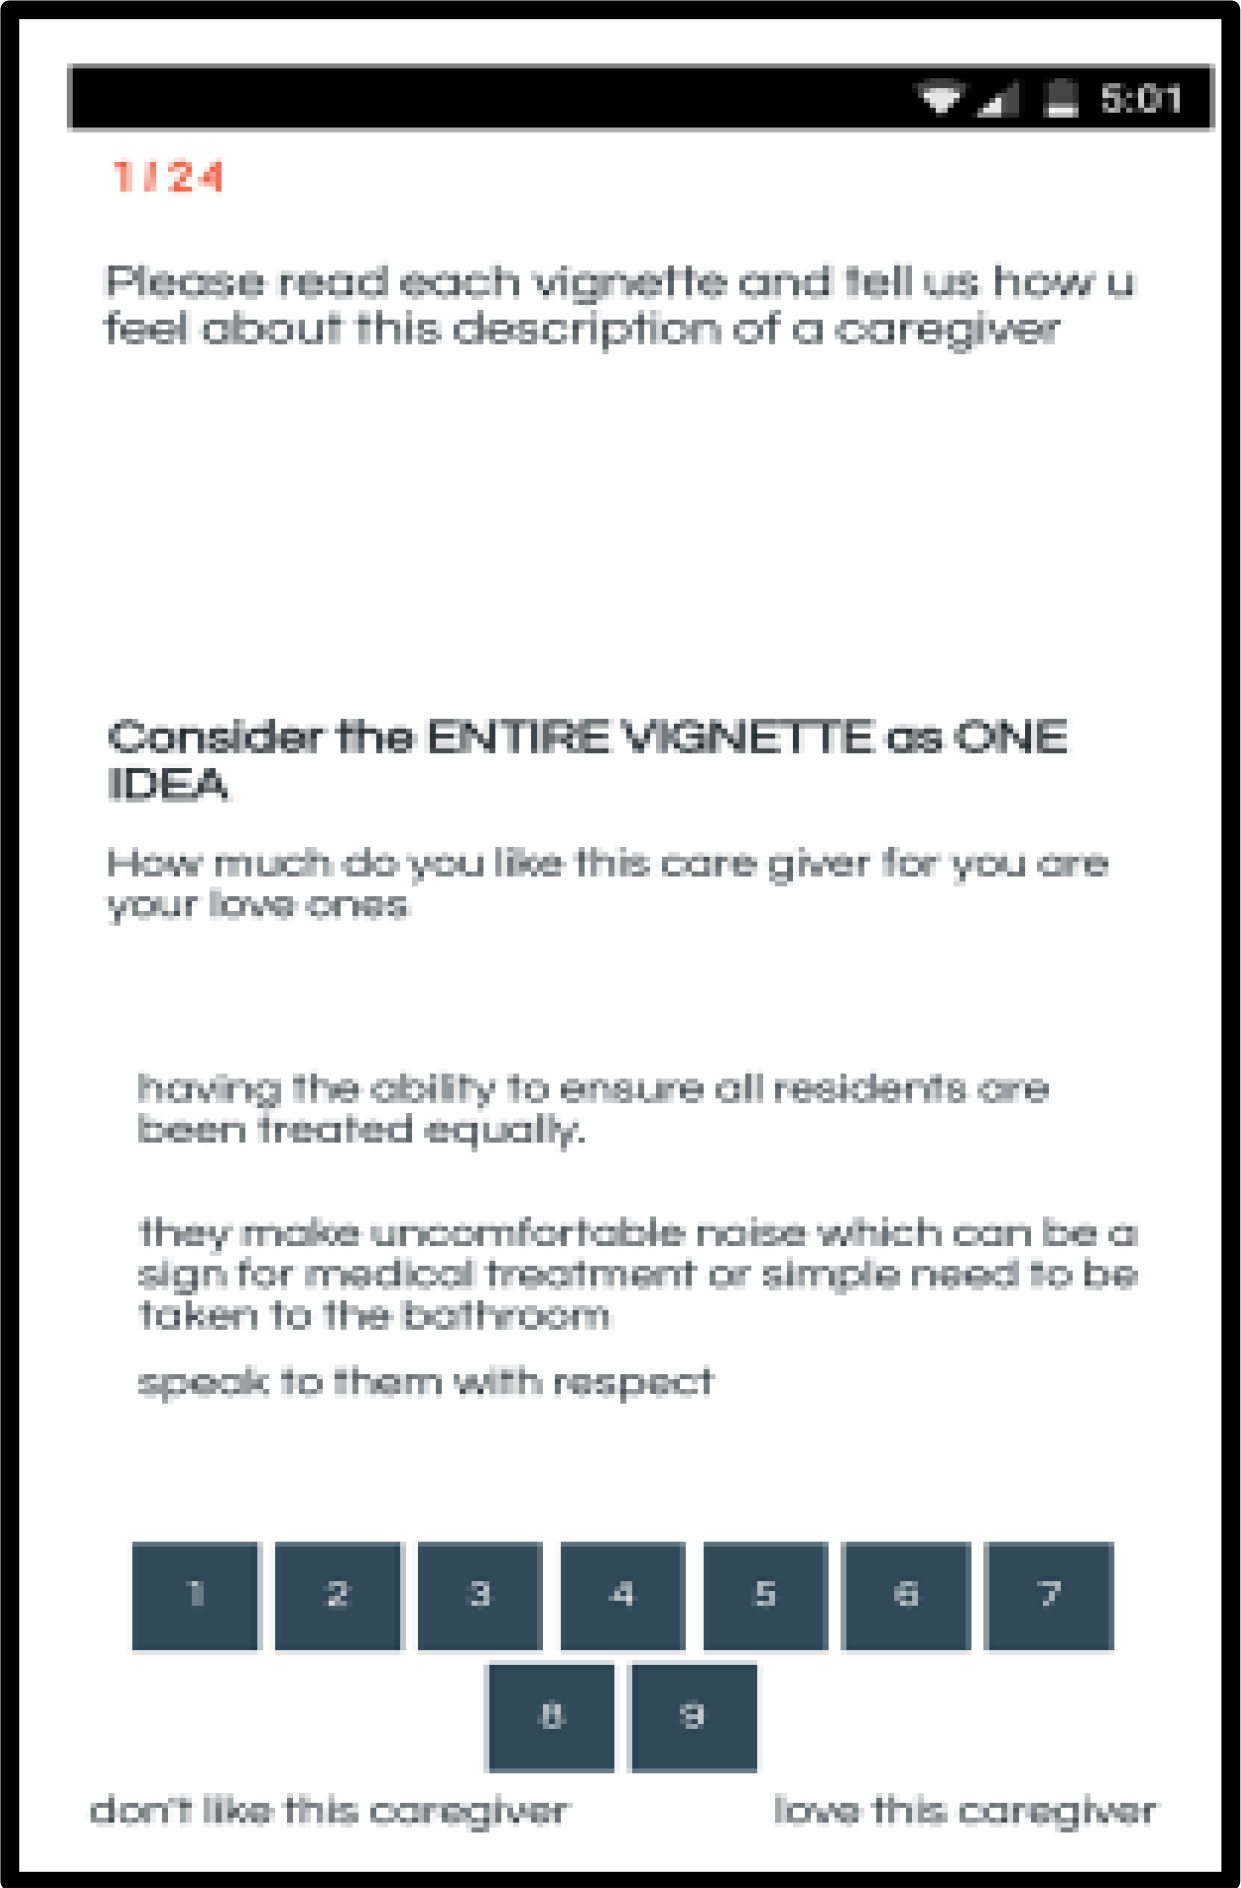
Figure 1. A typical vignette as it appears on a respondent’s smartphone.
When the respondent selects a rating, there is no need to press ‘next.’ The study automatically progresses to the next vignette, a feature which makes the study less onerous to the respondent, who needs to do far less work. The vignette is written in the language that most people find is comfortable with smartphones, namely with abbreviations (u for the word ‘you.’) As society progresses increasingly towards smartphones, such changes in usage, and even hitherto ‘incorrect spellings and diction’ are becoming the norm for regular conversation and texting. We felt it important to adopt the language of the everyday, rather than to make the interview more formal in its language.
Preparing Mind Genomics Data for Analysis through the Binary Transform of the Rating Scale
Although the use of category (Likert) scales is widespread, all-too-often it is unclear to the user of the scale what the scale means. A great deal of effort may be expended on assigning names to the scale points in order to make the scale meaningful to those who must make practical decisions with the results. A good example of this effort is the work on assigning the proper names to the nine scale points of the so-called Hedonic Scale [14].
An alternative to the nine-point scale used here is to convert the scale to binary, with a convention established by author Moskowitz for 35 years, since 1984. The convention is to transform the ratings of 1–6 to 0, and the ratings of 7–9 to 100, and then add a very small random number to each transformed value, the small random number being in the vicinity of (10–5.) This transformation makes the results ‘binary,’ no or yes, with the subsequent property that anyone can now understand the meaning of the response. The transformation may be stricter (1–7 transformed to 0) or less strict (1–5 transformed to 0), but the effect is the same. The results are easier to understand by scientists, managers, and the general readership, who are accustomed to issues with a binary choice, no versus yes, respectively. The transformation reduces some of the metric information, but the interpretability of the results more than makes up for that loss of metric information and ‘discriminatory fineness.’
What Resonates in The Mind of the Respondent Regarding a Professional Caregiver?
The first analysis uses OLS (ordinary least-squares) regression. The data from all 56 respondents are included in the analysis, with the total number of cases or observations totaling 1,344 (56×24.) The regression modeling does not pay any attention to which the respondent IS, nor the order of testing. All the observations are treated equally. The regression model tried to fit a linear equation of the form:
Binary Rating = k0 + k1(A1) + k2(A2)…k16(D4) The parameters of the model for the total panel is shown in Table 3.
Table 3. The performance of the elements on Question 1: How much do you like the caregiver
|
|
The coefficients are the binary transformed values. |
Coefficient |
t-stat |
p-Value |
|
Additive Constant – Total |
74.14 |
12.19 |
0.00 |
|
|
D2 |
show them love, gratitude let them feel at home like family |
7.73 |
2.10 |
0.04 |
|
A4 |
be understanding, self-sufficient and very patient. |
6.07 |
1.64 |
0.10 |
|
A2 |
be devoted and dedicated to you job |
5.05 |
1.36 |
0.17 |
|
A1 |
having the ability to ensure all residents are been treated equally. |
4.08 |
1.10 |
0.27 |
|
C3 |
speak to them with respect |
3.81 |
1.02 |
0.31 |
|
C2 |
speak so they are able to hear you |
3.16 |
0.85 |
0.40 |
|
C1 |
ensure you speak softly, kind and very clear and understanding manner |
2.66 |
0.71 |
0.48 |
|
D4 |
try spending as much time with them |
2.41 |
0.65 |
0.52 |
|
A3 |
treat all residents with respect, love and dignity |
1.82 |
0.49 |
0.62 |
|
C4 |
listen to their complaints and try to figure out a way to assist them |
1.21 |
0.33 |
0.75 |
|
B4 |
be alert |
0.59 |
0.16 |
0.88 |
|
D1 |
protect them |
-0.19 |
-0.05 |
0.96 |
|
D3 |
show acknowledgment instead of letting them feel invisible |
-0.33 |
-0.09 |
0.93 |
|
B3 |
most residents are unable to speak so it’s also good to pay attention |
-3.03 |
-0.81 |
0.42 |
|
B1 |
sometimes they tend to pace back-and-forth which can be very unusual |
-4.06 |
-1.08 |
0.28 |
|
B2 |
they make uncomfortable noise which can be a sign for medical treatment or simply need to be taken to the bathroom |
-5.23 |
-1.41 |
0.16 |
The foregoing equation states that the binary rating (our transformed variable from the original scale) is equal to the additive constant (k0), and 16 individual weights or coefficients, one for each of the 16 elements.
The additive constant tells us the conditional probability or percent of responses expected to be 7–9 in the absence of elements. Of course, all vignettes comprised a minimum of two and a maximum of four elements, respectively, meaning that the additive is simply an estimated parameter. Nonetheless, it is a useful indicator of the degree of predisposition to like a professional caregiver. For our data the additive constant in Table 3 is 74.14, meaning that even without elements, the odds of a person liking a professional caregiver is 74%. It will be the elements which do the work.
Looking down the column labelled ‘Coefficient,’ we have sorted the 16 elements from high to low, Despite the very high constant, there is one strong performing element, D2, ‘show them love .. Gratitude, let them feel at home like family.’ This element has a coefficient of 7.73. There is one other strong element, A4, ‘be understanding, self-sufficient, and very patient.’
Not every element drives liking. Some elements, those having to do with the problems or issues encountered with residents, those who are being taken care of, generated negative coefficients. These are elements that are not liked. They are from Question or Silo B, ‘How do you know that a resident needs help?’
B3 most residents are unable to speak so it’s also good to pay attention
B1 sometimes they tend to pace back and forth which can be very unusual
B2 they make uncomfortable noise which can be a sign for medical treatment or simply need to be taken to the bathroom
The coefficients do not describe the data perfectly. The model shown in Table 3 is known as a cross-sectional model, which uses the raw data. We are interested, of course, in the coefficients, but also in the degree to which we can believe that the coefficients represent a ‘real contribution’ to the rating. The degree to which the coefficients represent a departure from 0, the 0 signifying no contribution, comes from the t-statistic and the p-value, shown in the right-most two columns.
Every one of the coefficients comes from what is known as a sampling distribution. What we observe in Table 3 in terms of the value of the coefficient is only one value from many values that the coefficient could take on. Were we to repeat the experiment or study 100 times, would we get a coefficient that is not closer to 0, or even 0 itself? That question is answered by the t-statistic, which is the ratio of the coefficient that we observe to the standard error of the coefficient, i.e., to the standard deviation of the coefficient were we to do the study 100 times, or so. We look for high t-statistics, preferably 2.00 or more, but at least 1.6 or more. That ratio tells us that the ratio of the signal to the noise, i.e., the ratio of the coefficient to the standard error of the coefficient, is reasonably high. In turn, when we work with a t-statistic around 1.64 or so, we have a 10% probability that the ‘real’ coefficient is 0. We accept the coefficient as significant, as important.
As a matter of experience, the coefficients are typically not particularly significant for the total, but tend to become more significant with subgroups, especially mind-set segments. As a rule of thumb, we look at coefficients of 7.51 or higher (8 in rounded format) as being important, signaling that the element plays an important role to people. Previous observations in many studies by author Moskowitz suggest that coefficients around 8 correspond to elements which are relevant to people who make decisions based on these elements.
Gender Differences
Men and women are identical in their basic liking of a professional caregiver. Their coefficients are 76 for males, and 73 for females, respectively. It is in the specific elements which drive liking that we see the differences (Table 4). Men want the interaction to be efficient, speaking with respect so that the person cared for is heard. It is on the activity itself. In contrast, women want to see that there is an emotional connection, patience, and love. It is not so much on being efficient as in bonding. The same difference between efficient/effective activity and emotional understanding/bonding occurs for those elements which are not strong for either gender, but elements showing large differences in the coefficient. A good example of this is D3: show acknowledgment instead of letting them feel invisible.
Table 4. Gender differences for the performance of the elements on Question 1: How much do you like the caregiver
|
|
|
Male |
Fem |
|
Additive constant |
76 |
73 |
|
|
Elements important to men |
|||
|
C3 |
speak to them with respect |
9 |
-1 |
|
C2 |
speak so they are able to hear you |
9 |
-2 |
|
Elements important to women |
|||
|
D2 |
show them love, gratitude let them feel at home like family |
6 |
10 |
|
A4 |
be understanding, self-sufficient and very patient. |
3 |
9 |
|
D4 |
try spending as much time with them |
-4 |
8 |
|
Elements which show 7-point or bigger differences between the genders |
|||
|
B2 |
they make uncomfortable noise which can be a sign for medical treatment or simply need to be taken to the bathroom |
-14 |
3 |
|
D3 |
show acknowledgment instead of letting them feel invisible |
-4 |
3 |
|
B3 |
most residents are unable to speak so it’s also good to pay attention |
-7 |
0 |
Age Differences
We see strong effects due to age. Table 5 shows that the additive constant is high across the four age groups, ranging from 17 to 80. Table 5 is arranged in descending order to highlight the remarkable differences. All additive constants are high, 70 and above, but the additive constants of the youngest respondents, ages 17–25 is remarkably high, 90. This very high additive constant suggests that the younger respondents are prepared to like virtually any description of a professional caregiver.
Table 5. Age differences for the performance of the elements on Question 1: How much do you like the caregiver
|
|
80–61 |
60–41 |
40–26 |
25–17 |
|
|
Additive constant |
70 |
70 |
76 |
90 |
|
|
Age 61–80 (Oldest respondents) – respect and warmth |
|||||
|
D2 |
show them love, gratitude let them feel at home like family |
11 |
10 |
2 |
9 |
|
C1 |
ensure you speak softly, kind and very clear and understanding manner |
10 |
2 |
-3 |
5 |
|
C2 |
speak so they are able to hear you |
10 |
-2 |
3 |
-1 |
|
C3 |
speak to them with respect |
10 |
6 |
-2 |
5 |
|
C4 |
listen to their complaints and try to figure out a way to assist them |
9 |
-2 |
-3 |
1 |
|
A4 |
be understanding, self-sufficient and very patient. |
-2 |
11 |
10 |
-3 |
|
D4 |
try spending as much time with them |
-1 |
9 |
3 |
-12 |
|
Age 41–60 – Exhibit patience |
|||||
|
Age 26–40 – Be dedicated to the job |
|||||
|
A1 |
having the ability to ensure all residents are been treated equally. |
-5 |
6 |
13 |
-9 |
|
A2 |
be devoted and dedicated to you job |
-2 |
6 |
8 |
5 |
|
A3 |
treat all residents with respect, love and dignity |
0 |
1 |
8 |
-4 |
|
Age 17–25 – Nothing important, but don’t seem to want to hear about practical issues with which caregivers must deal |
|||||
|
D1 |
protect them |
2 |
1 |
0 |
-13 |
|
D3 |
show acknowledgment instead of letting them feel invisible |
-1 |
4 |
0 |
-11 |
|
B2 |
they make uncomfortable noise which can be a sign for medical treatment or simply need to be taken to the bathroom |
-6 |
7 |
-2 |
-41 |
|
B4 |
be alert |
6 |
4 |
-3 |
-10 |
|
B3 |
most residents are unable to speak so it’s also good to pay attention |
-4 |
7 |
-6 |
-12 |
|
B1 |
sometimes they tend to pace back-and-forth which can be very unusual |
-3 |
3 |
-7 |
-12 |
The age differences emerge quite strongly when we look at the different ages:
Age 61–80 respond to statements about respect and warmth
Age 41–60 respond to statements about patience
Age 26–40 respond to statements about being dedicated to the job
Age 17–25 find nothing important in a positive sense, but don’t seem to want to hear about practical issues with which caregivers must deal
Emergent Mind-Sets
One of the hallmarks of Mind Genomics is its focus on underlying mind-sets or ways of looking at the world, as a key way to understand a topic, and differences in judgments. What may seem to some to be ‘irrational behavior’ exhibited by some individuals may, in fact, simply be the fact that the individual has a different frame of reference, and different weights in the criteria.
Tables 4 and 5 show differences in the importance between the genders (Table 4) and across ages (Table 5.) It may well be that the differences among people are deeper, comparable to differences among people in terms of genes. The name ‘Mind Genomics,’ in fact, is taken from the metaphor of genetic differences, not applied to the physical chromosomes of people, but to the way different people focus on the same situation, but different in what is important.
In order to uncover the mind-genomes, or ‘mind-sets,’ we simply cluster the 16 coefficients generated for each respondent. Mind Genomics allows us to create an individual-level model for each respondent relating the presence/absence of the 16 elements to the binary rating of ‘Like the caregiver.’ Each individual is one object among a set of 56 objects. Clustering, a well-accepted statistical method, divides the 56 objects, our respondents, into a small set of non-overlapping groups. The criteria for division is the minimization of ‘distance’ between pairs of our 56 respondents, with the property that the emergent clusters or mind-sets be both parsimonious (the fewer the better), and interpretable (the clusters tell meaningful stories)
Our data suggest three separate clusters or mind-sets, shown in Table 6. The division into the clusters or mind-sets
Table 6. Emergent mind-sets for the performance of the elements on Question 1: How much do you like the caregiver
|
MS1 |
MS2 |
MS3 |
||
|
Additive constant |
63 |
75 |
82 |
|
|
Mind-Set 1 – Devotion to the job and to the well being of the patient |
||||
|
A2 |
be devoted and dedicated to you job |
25 |
-1 |
-6 |
|
A1 |
having the ability to ensure all residents are been treated equally. |
24 |
-1 |
-7 |
|
A4 |
be understanding, self-sufficient and very patient. |
20 |
3 |
-3 |
|
A3 |
treat all residents with respect, love and dignity |
18 |
-6 |
-3 |
|
C2 |
speak so they are able to hear you |
9 |
-6 |
8 |
|
Mind-Set 2 – Treat them like family |
||||
|
D2 |
show them love, gratitude let them feel at home like family |
5 |
16 |
2 |
|
D4 |
try spending as much time with them |
0 |
8 |
0 |
|
Mind-Set 3 – Focus on empathy, respect, and competence |
||||
|
C1 |
ensure you speak softly, kind and very clear and understanding manner |
-2 |
-2 |
11 |
|
C3 |
speak to them with respect |
5 |
-1 |
8 |
|
C4 |
listen to their complaints and try to figure out a way to assist them |
-2 |
-2 |
8 |
|
Elements which do not drive strong responses from any mind-set |
||||
|
B4 |
be alert |
-3 |
-2 |
6 |
|
B1 |
sometimes they tend to pace back and forth which can be very unusual |
0 |
-13 |
1 |
|
B3 |
most residents are unable to speak so it’s also good to pay attention |
-2 |
-4 |
-3 |
|
D1 |
protect them |
-2 |
4 |
-4 |
|
D3 |
show acknowledgment instead of letting them feel invisible |
3 |
2 |
-6 |
|
B2 |
they make uncomfortable noise which can be a sign for medical treatment or simply need to be taken to the bathroom |
-8 |
0 |
-8 |
Mind-Set 1 – Be devoted to the job, and to the well-being of the patient. This mind-set shows the lowest additive constant (63), but strongly to a few of the elements, and not to the others. These respondents react strongly to devotion and professionally competent behavior.
Mind-Set 2 – Respond to caregivers who treat their patients as family. They show a higher additive constant (75).
Mind-Set 3 – Respond to a focus on empathy, respect and competence. This mind-set shows the highest additive constant (82.)
There are six of the 16 elements which do not drive a strong response by any of the three mind-sets.
Beyond Liking to Decision Making
One needs to observe everyday life for just a moment to realize that most of the decision is either unconscious, or virtually automatic. One can always inquire ‘why’ a specific decision or action was done, but the reality of life is that without the automatic behaviors that we exhibit we simply could not function the environment around us is simply too complicated, with too many conflicting cues
The previous tables showed us that there is meaningful order in a person’s reaction to what is considered a good professional caregiver. That is, there is a story which seems to emerge. The differences between the genders, among the ages, and among the mind-set segments make sense.
What we don’t know is the speed with which the decision is made, and whether or not there is a relation between how much someone ‘likes’ a message and how ‘fast’ the person processes that message. Liking something may be entirely different from processing. Valences, emotions, may have something or perhaps nothing with how quickly we react, although when it comes to food quite often we will observe a disgust reaction quite quickly.
The data that were collected from this study, ratings, were accompanied by another, parallel type of information, response times. Each vignette appeared on the screen and was rated. We have already dealt with the relation between the elements in the vignette and the rating, or more correctly, the binary transform of the rating. We now turn to the response time.
How Fast People Respond to these Vignettes – a ‘Morphological Analysis’ of the Data Patterns
As in everyday life, people do not focus on what they read, but simply pay attention, and make a judgment. Our previous data looking at the ‘liking’ rating suggest that the data makes ‘sense.’ Some of the 56 respondents take a long time to respond, others take a short time to respond.’ Figure 2 shows that there is a distribution of average response times across respondents (ordinate) as well as a distribution of average rating times across the same respondents. There is no simple relation between the two. People who take longer to rate the vignettes are neither more accepting nor more rejecting of what they read. The pattern appears random.

Figure 2. Scatterplot plot showing the average rating of liking on the 9-point scale (abscissa) versus the average response time (ordinate.) Each filled circle corresponds to one of the 56 respondents.
A clearer picture of group to group differences emerges when we compute the averages, specifically of the rating question (liking), the binary transformed rating, and the response time. Table 7 shows that the groups do not differ very much in terms of the 9-point rating (range of 7.1 to 7.7), somewhat more for the binary transformed rating (69 to 85), and most dramatically in terms of response times. For response times, males respond more quickly than do females, younger participants respond more quickly than do older respondents, and the mind-set segments respond at different speeds, with Mind-Set 1 (devotion to the job and to the well-being of the patient) responding most quickly and Mind-Set 3 (focus on empathy, respect and competence) responding most slowly
Table 7. Average ratings, binary transformed ratings, and response times, for total and subgroups.
|
Group |
9-Point Liking Rating |
Binary transformed rating |
Response time with first position |
Response time without first position |
|
|
1 |
Total |
7.5 |
79.5 |
4.6 |
4.3 |
|
2 |
Male |
7.4 |
77.5 |
4.0 |
3.8 |
|
3 |
Female |
7.5 |
81.4 |
5.1 |
4.8 |
|
4 |
A17t25x |
7.1 |
69.2 |
3.0 |
2.7 |
|
5 |
A26t40x |
7.5 |
80.7 |
3.5 |
3.3 |
|
6 |
A41t60x |
7.7 |
84.9 |
4.8 |
4.5 |
|
7 |
A61t80x |
7.4 |
76.5 |
6.7 |
6.3 |
|
8 |
Mind-Set 1 – Devotion to the job and to the well- being of the patient |
7.4 |
81.9 |
3.1 |
2.8 |
|
9 |
Mind-Set 2 – Treat them like family |
7.2 |
73.7 |
4.3 |
4.1 |
|
10 |
Mind-Set 3 – Focus on empathy, respect, and competence |
7.8 |
83.0 |
6.2 |
5.9 |
Response times tell about how long a respondent requires to ‘process’ the information. We do not know the neurophysiological correlates, but we can surmise that those respondents requiring a longer processing time as somehow considering the message in a different way, especially when we have response times of over a second or two.
In previous studies (unpublished observations) it appears that the first position may be very ‘noisy’ with respect to response time. We can eliminate the ‘noise’ by considering the response without the measures in position #1, the first position in the set of 24. Table 7 shows that there about a change of 0.3 seconds, three tenths of a second in the average response.
Deconstructing Response Time
The experimental design allows us to deconstruct the measured response time into the contribution of the individual response times. Since we were not able to monitor the respondents, we could not determine whether the respondent was multi-tasking, a behavior which would lead to very long response times. In order to remove the biases due to multitasking, which could make the response time go from a few seconds to a few hundred seconds, we arbitrarily set a cut-off of 15 seconds. Any response time of 15 seconds or higher was brought down to 15 seconds. A few respondents generated response times in the hundreds of seconds, but the majority of response times were far shorter, as Figure 3 shows.
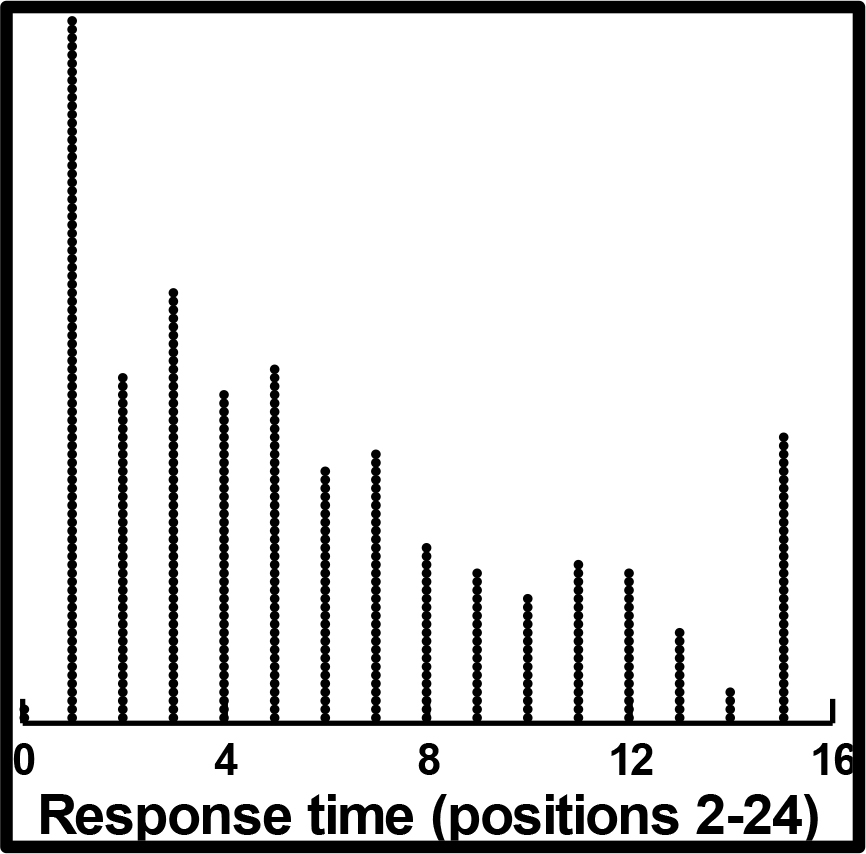
Figure 3. Distribution of response time for the 56 respondents, and the vignettes in position 2–24.
A key emerging aspect of Mind Genomics is the focus on possible neurophysiological correlates of ratings. One of the most popular of these neurophysiological measures is ‘response-time,’ which is presumed to reflect underlying processes. Table 8 shows the results from OLS regression, for the total panel. All of the vignettes were included in the regression modeling, which related the presence/absence of the 16 elements to the response times. The model is expressed as a simple linear function, without an additive constant.
Rating Time (Seconds) = k1(A1) + k2(A2) … k16(D4)
The pattern in Table 8 suggests a ratio of about 2.5/0.8, or 3/1 in terms of the number of seconds required to process the different messages. By inspection, it appears that the shorter elements take less time to process. The very longest is a sentence which requires additional cognitive processing, first because it is long, and second because it has a second and third clause, respectively. Each clause must be processed to understand the full meaning of the sentence.
Table 8. Response time deconstructed into the contribution of the individual elements (coefficient), as well as the statistical significance of the coefficient (t-statistic)
|
|
Response-Time, Total Panel |
Coefficient |
t-stat |
p-Value |
|
D1 |
protect them |
0.80 |
2.20 |
0.03 |
|
C1 |
ensure you speak softly, kind and very clear and understanding manner |
0.94 |
2.62 |
0.01 |
|
A2 |
be devoted and dedicated to you job |
0.95 |
2.66 |
0.01 |
|
C3 |
speak to them with respect |
1.18 |
3.31 |
0.00 |
|
D2 |
show them love, gratitude, let them feel at home like family |
1.21 |
3.32 |
0.00 |
|
C4 |
listen to their complaints and try to figure out a way to assist them |
1.21 |
3.38 |
0.00 |
|
C2 |
speak so they are able to hear you |
1.24 |
3.47 |
0.00 |
|
A3 |
treat all residents with respect, love and dignity |
1.24 |
3.43 |
0.00 |
|
A1 |
having the ability to ensure all residents are been treated equally. |
1.42 |
3.95 |
0.00 |
|
B4 |
be alert |
1.48 |
4.21 |
0.00 |
|
A4 |
be understanding, self-sufficient and very patient. |
1.48 |
4.13 |
0.00 |
|
B3 |
most residents are unable to speak so it’s also good to pay attention |
1.50 |
4.25 |
0.00 |
|
D4 |
try spending as much time with them |
1.51 |
4.20 |
0.00 |
|
D3 |
show acknowledgment instead of letting them feel invisible |
1.59 |
4.33 |
0.00 |
|
B1 |
sometimes they tend to pace back-and-forth which can be very unusual |
1.76 |
5.07 |
0.00 |
|
B2 |
they make uncomfortable noise which can be a sign for medical treatment or simply need to be taken to the bathroom |
2.04 |
5.76 |
0.00 |
First clause: they make uncomfortable noise
Second clause: which can be a sign for medical treatment
Third clause: or simply need to be taken to the bathroom
It may be that each clause takes roughly about 0.8 seconds or so to process if it has a major idea. A minor idea might add another 0.4 seconds, rather than another 0.8 seconds.
Does response time co-vary with liking?
Do people respond more quickly to what they like? If they do in the aggregate, does this co-variation remain when we look at different subgroups, such as gender, age, and mind-set, respectively? The answer to this question requires that we deconstruct the binary-transformed ratings into the contribution of the 16 elements, and the response times into the contributions of the 16 elements, do the two analyses separately. Each analysis generates a coefficient for each of the 16 elements. We plot the coefficient for response time against the corresponding coefficient for binary-transform rating.
The results appear in Figure 4A for total panel, Figure 4B for gender, Figure 4C for age, and Figure 4D for mind-set. The results tell a story, but one whose character changes with the r group being analyzed. There is no suggestion of total randomness, however, although there are plots showing a great deal of noise.
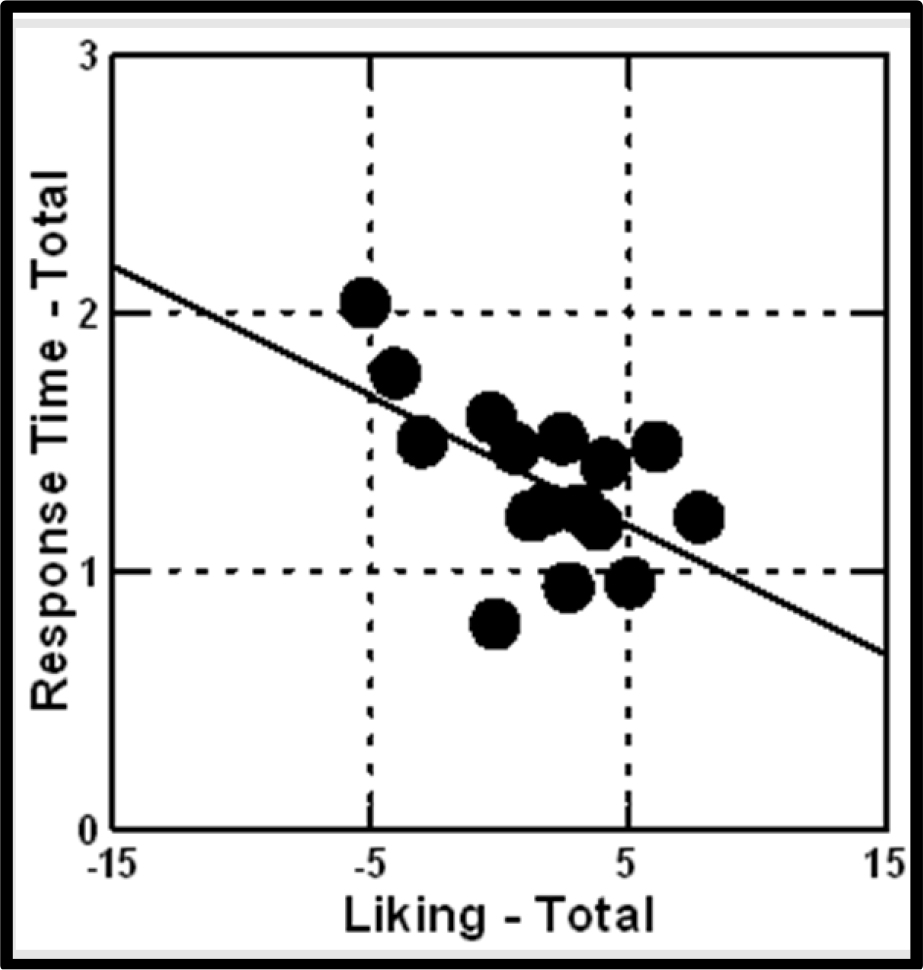
Figure 4A. How response time covaries with liking. The darkened circles correspond to the coefficients of the 16 elements.
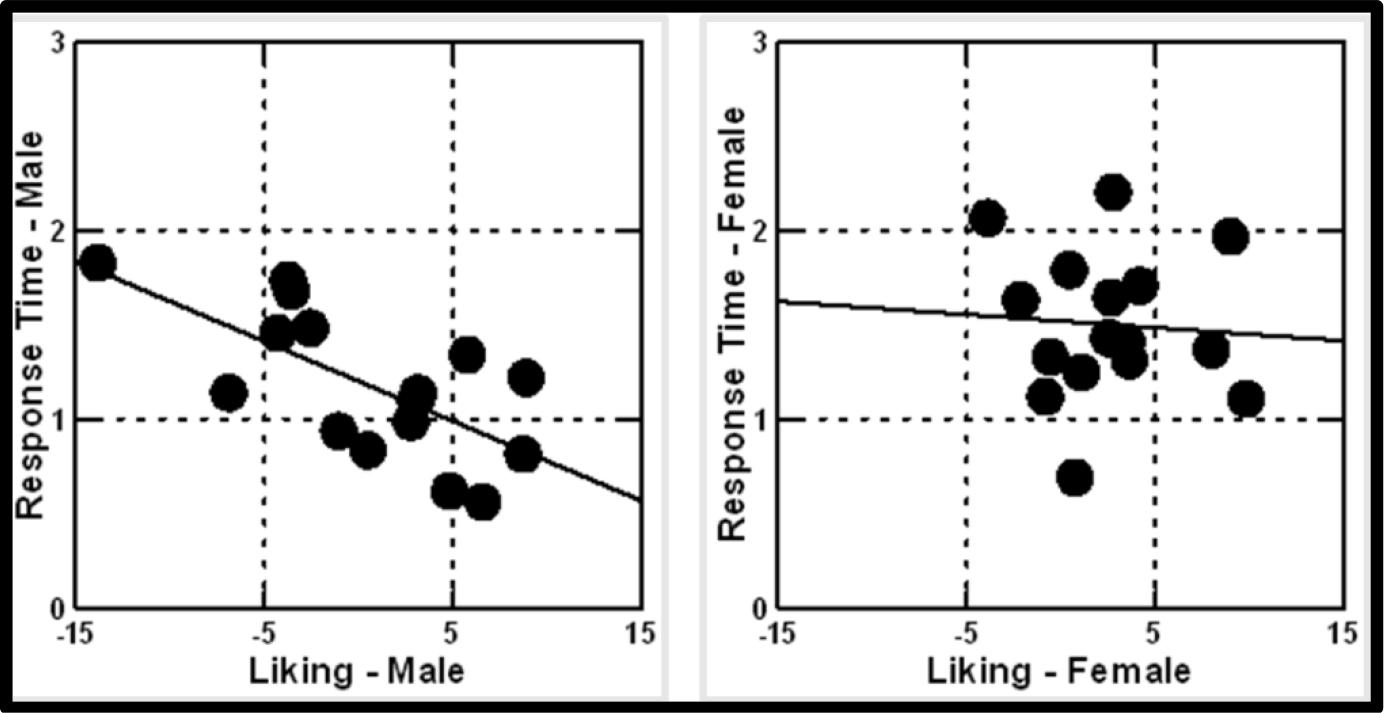
Figure 4B. How response time covaries with liking. The darkened circles correspond to the coefficients of the 16 elements. The plot is by gender
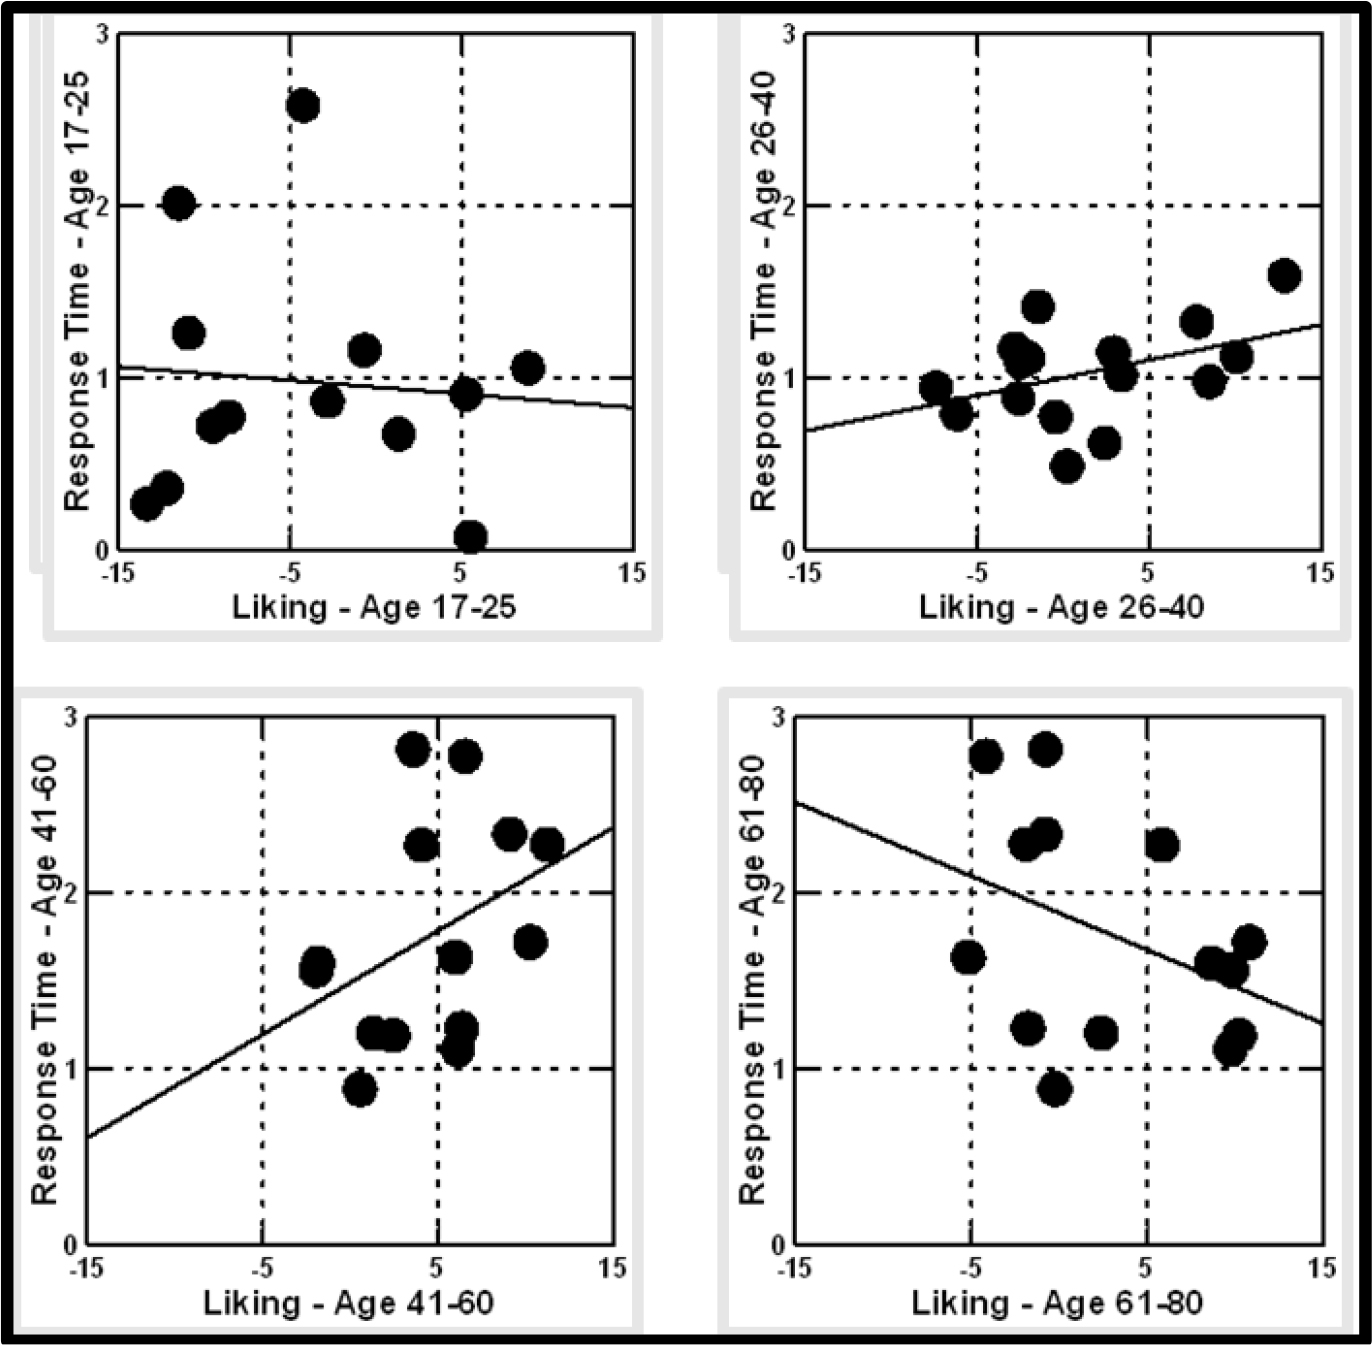
Figure 4C. How response time covaries with liking. The darkened circles correspond to the coefficients of the 16 elements. The plot is by gender
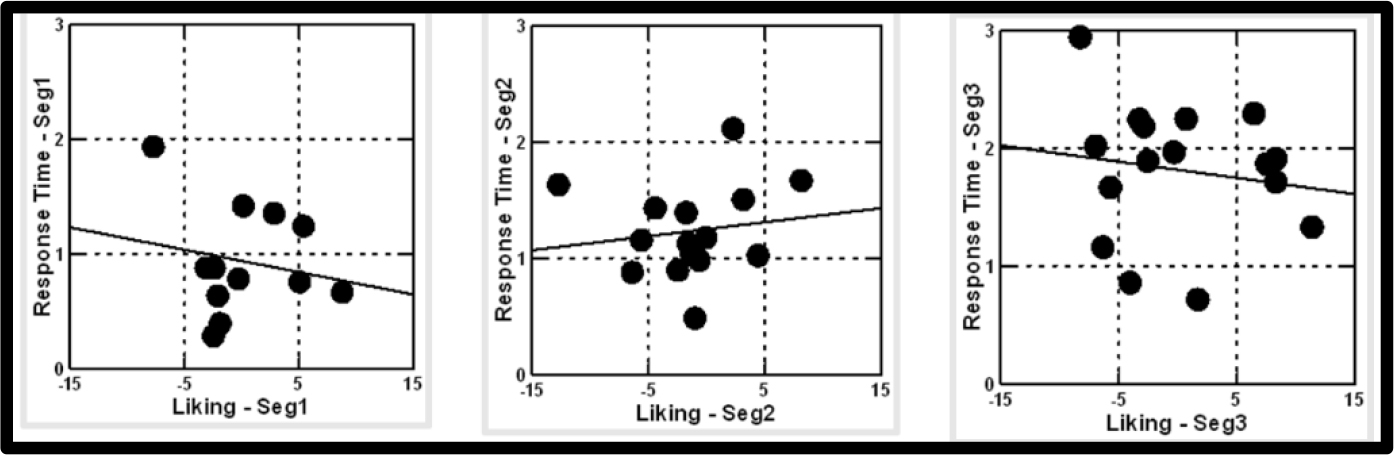
Figure 4D. How response time covaries with liking. The darkened circles correspond to the coefficients of the 16 elements. The plot is by segment or mind-set
Total Panel (Figure 4A) – As an element is liked more, it is responded to faster.
Males (Figure 4B) – As an element is liked more, it is responded to faster.
Females (Figure 4B) – Response time and liking covary randomly;
Age 17–25 (Figure 4C) – Response time and likin covary randomly.
Age 26–40 (Figure 4C) – As an element is liked more, it is responded to more slowly, suggesting the item is being considered, perhaps for a relative.
Age 41–60 (Figure 4C) – As an element is liked more, it is responded to more slowly, suggesting the item is being considered, perhaps for a relative.
Age 61–80 (Figure 4C) – As an element is liked more, it appears to be responded to more quickly, but the relation is quite ‘noisy.’
Seg1 (Figure 4D) – Devotion to the job and to the well-being of the patient. The relation appears to be almost random, certainly very noisy.
Seg2 (Figure 4D) – Treat them like family. The relation appears to be almost random, as well.
Seg3 (Figure 4D) – Focus on empathy, respect, and competence. The relation appears to be almost random as well.
It appears that the difference in processing speed is not a function of the respondent’s mind-set, but rather a function of WHO THE RESPONDENT IS.
Finding Mind-Sets from Mind-Genomics in the Population
This first paper in the Mind Genomics effort to understand and improve professional caregiving has easily revealed at least three mind-sets in the population of individuals who may some day be responsible for hiring caregivers for themselves or for an ill relative. Mind Genomics suggests that although almost all of the idea or messages about caregivers are either modestly or strongly positive, that surface positivity is not the case when we dig into the details, and uncover mind-sets. The mind-sets, pervasive in the population, respond to different aspects of the caregiver’s attitude and job. What pleases one mind set may not please another mind-set. We do not see radical opposite points of view, as we might for foods of various types (e.g., spicy versus bland foods), but we see the opportunity to optimize the fit of a caregiver with the person who hires that caregiver.
How can a person find out who she or he IS if a caregiver, and whom she or he WANTS when hiring a caregiver? One way is to assign a new person, either client or caregiver, to the mind-set, through a short questionnaire, the PVI, the personal viewpoint identifier. The identifier, created by author Gere, uses the 16 coefficients for the three mind-sets respectively (Table 6), and creates a set of questions to be answered NO or YES. The pattern of responses to the questions assigns a person, either client or caregiver, to one of the three mind-sets. Figure 5 shows the PVI, with the top part showing the test itself, and the bottom showing the three outputs, which can be either given to the caregiver and/or to the person hiring the caregiver. The objective in future Mind-Genomics studies on caregiving is to expand the scope of the different aspects of caregiving, and for each probe far more deeply. The present study is thus the ‘first salvo’ in that effort.
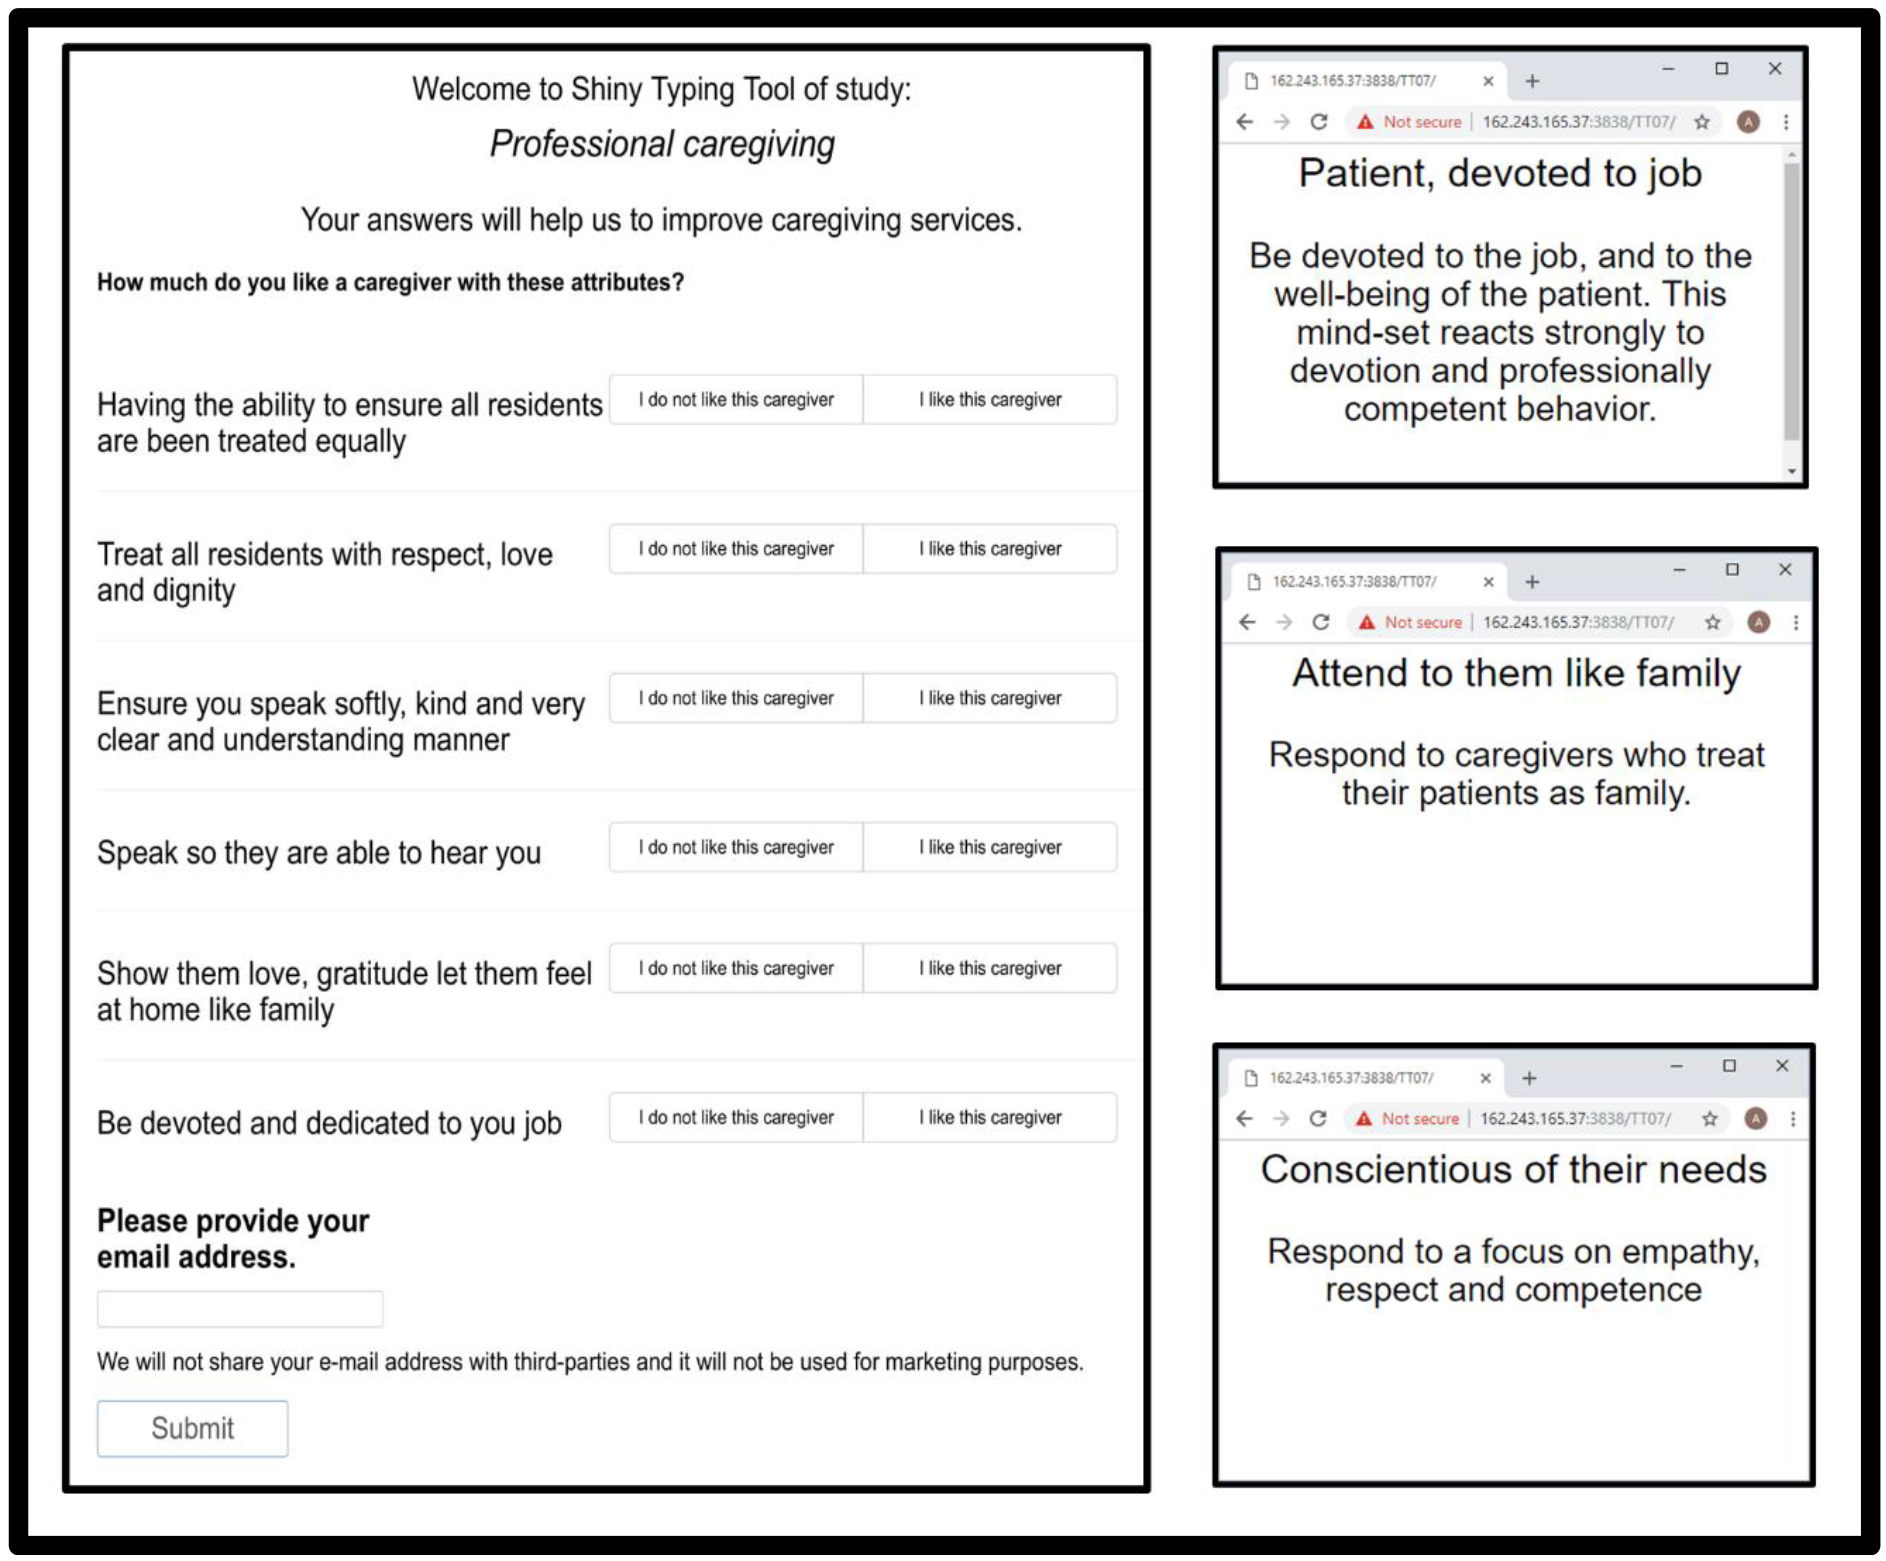
Figure 5. The PVI (Personal Viewpoint Identifier) for Professional Caregiving
Discussion and Conclusion
In this exploratory study of responses to professional caregivers, we have opened a new area in the emerging science of Mind Genomics. The topic is the response of potential clients of professional caregivers to what the caregiver should do, and what constitutes preferred behavior and conduct versus behavior and conduct that are disliked. The elements chosen for this initial study were all positive, developed by the senior author, Ellis, a professional caregiver, is author Frazier.
With the rapid aging of the population, the increase in dementia and other debilitating illnesses, studies of this type are called for in the world of caregiving. With caregivers currently at a financial disadvantage, it is hoped that this first paper on Mind Genomics and what is desired by the population of a good caregiver can become a stimulus for recognition of the very valuable service, and a tool for continual improvement and increased professional and public recognition of their efforts.
Acknowledgement: Attila Gere thanks the support of the Premium Postdoctoral Research Program of the Hungarian Academy of Sciences.
References
- Kalis A, Schermer MH, van Delden JJ (2005). Ideals regarding a good life for nursing home residents with dementia: views of professional caregivers. Nursing ethics 12: 30–42.
- Zingmark K, Sandman PO, Norberg A (2002) Promoting a good life among people with Alzheimer’s disease. J Adv Nurs 38: 50–58. [crossref]
- Ettema TP, Dröes RM, Lange J de, Ooms ME, Mellenbergh GJ, et al (2005). The concept of quality of life in dementia in the different stages of the disease. International Psychogeriatrics 17: 353–370.
- Thorgrimsen L, Selwood A, Spector A, Royan L, De Madariaga Lopez M,Woods RT, Orrell M (2003) Whose quality of life is it anyway? The validity and reliability of the Quality of Life-Alzheimer’s Disease (QOL-AD) scale. Alzheimer Disease and Associated Disorders 17: 199–200
- Dröes, R. M., Boelens-Van Der Knoop, E. C., Bos, J., Meihuizen, L., Ettema, T. P., Gerritsen, D. L., & SchöLzel-Dorenbos, C. J. (2006). Quality of life in dementia in perspective: An explorative study of variations in opinions among people with dementia and their professional caregivers, and in literature. Dementia, 5, 533–558.
- Dröes RM, Meiland FJM, Schmitz M, & Tilburg W van (2004). Effect of combined support for people with dementia and carers versus regular day care on behaviour and mood of persons with dementia: Results from a multi-centre implementation study. International Journal of Geriatric Psychiatry 19: 1–12
- Lyketsos CG, Gonzales-Salvador T, Chin JJ, Baker A, Black B, & Rabins P (2003) A follow-up study of change in quality of life among persons with dementia residing in a long-term care facility. International Journal of Geriatric Psychiatry 18: 275–281.
- Ready RE, Ott BR (2003) Quality of Life measures for dementia. Health Qual Life Outcomes 1: 11. [crossref]
- Ready RE, Ott BR & Grace J (2004). Patient versus informant perspectives of quality of life in mild cognitive impairment and Alzheimer’s disease. International Journal of Geriatric Psychiatry 19: 256–265.
- Reichheld FF (2003) The one number you need to grow. Harv Bus Rev 81: 46–54. [crossref]
- Gilmore A and McMullan R (2009) Scales in services marketing research: a critique and way forward. European Journal of Marketing 43: 640–651.
- Wells WD ed.,( 2011). Life style and psychographics. Marketing Classics Press.
- Green PE, Krieger AM and Wind Y, (2001) Thirty years of conjoint analysis: Reflections and prospects. Interfaces, 31(3_supplement), S56-S73.
- Peryam DR and Pilgrim FJ (1957) January The hedonic scale method of measuring food preference. In Food technology 11, 32–32).