Abstract
Objective
Obesity rates are increasing in women of child bearing age but it is unclear if the recognised risk of stillbirth from obesity is increasing over time. This study aimed to describe the association between stillbirth and maternal obesity and explore temporal trends.
Study design
Singleton stillbirth cases (1995–2012) in Fife, Scotland were used in a case control study matching for maternal age, parity and prematurity. Maternal height, weight at booking and relevant maternal and infant confounders were obtained for 271 stillbirths and 976 controls. Analysis included conditional logistic regression analyses using WHO categories on body mass index (BMI). Data were subdivided into 3 epochs to investigate temporal trends. The main outcome measures were multivariate odds ratio (OR) and confidence interval (CI) for stillbirth associated with BMI categories and change between epochs in OR for a stillbirth associated with maternal obesity.
Results
Risk of stillbirth was positively related to BMI category even after adjusting for known confounders. The relationship was particularly marked in nulliparous women where the adjusted OR of stillbirth was 4.1 (95% CI 1.9 – 9.0) when BMI was 35-<40 and 8.0 (95% CI 2.9 – 21.9) if BMI was > = 40. The proportion of stillbirth cases with a maternal BMI > = 35 increased from 5.6% in 1995 – 2000 to 18.9% in 2001–2006 and to 23.1% in 2007 – 2012 (P = 0.001, test for trend). There were no equivalent trends in the controls. The difference in mean BMI between cases and controls increased from 1 kg/m2 (SE 0.6) in 1995–2000 to 3 kg/m2 (SE 0.8) in 2007–2012. The OR of a stillbirth associated with a BMI above the 90th percentile of the population distribution increased between epochs from 1.21 (P = 0.60) in 1995–2000 to 3.30 (P<0.001) in 2007–2012.
Conclusions
Maternal obesity is associated with an increased risk of stillbirth, particularly marked in nulliparous women with a BMI >35. The relative importance of maternal obesity as a risk factor for stillbirth may be increasing with time which has implications for future clinical practice and when interpreting the impact of the various interventions being developed to reduce stillbirth rates.
Keywords
Stillbirth, Maternal Obesity, Body Mass Index, Pregnancy, Temporal Trend.
Introduction
The prevalence of obesity amongst women of child-bearing age in the UK has shown a rising trend over the past 3 decades, in keeping with trends in other developed countries [1]. Studies of pregnant women at booking in England [2] and Scotland [3,4] have reported a doubling in the prevalence of obesity (defined as a body mass index, BMI of > = 30 kg/m2) between 1990 and the mid-2000s. Maternal obesity is associated with adverse pregnancy outcomes of which one is stillbirth [5–10]. Previous studies have suggested a strong link between pre-pregnancy obesity and the risk of stillbirth [11–13]. Furthermore, one study has suggested that stillbirths in obese women (compared with those in women of ideal body mass) more often occur at term or post-term, and are more likely to be classified as ‘unexplained’ [13]. It has been suggested that maternal obesity may be one of the most important modifiable risk factors associated with stillbirth [12] having a large population attributable risk relative to other features [8–10]. In Scotland the rate of stillbirths has remained stubbornly high [14] despite efforts to reduce it and the increasing prevalence of obesity in Scotland [15] and, in particular amongst pregnant women in the UK [2–4], may be a contributory factor. The purpose of the present study was to determine the magnitude of the association between maternal obesity and stillbirth in Scotland and to assess if its relative importance as a feature in stillbirths is increasing with time.
Materials and Methods
We used data from Fife (a county in east central Scotland with a stable population of about 360,000 and about 3,800 births per year) because BMI has been routinely measured at booking since the early 1990s. Stillbirths between 1995 and 2008 inclusive were identified from the Fife Birth Register. A stillbirth was defined as a baby delivered with no signs of life after 24 completed weeks of gestation [5]. An initial analysis of these data proved insufficient to meet the study’s required statistical power so we identified further cases from 2009 to March 31st 2012 from a list of all Fife births from the Information Services Division (ISD) of the NHS National Services Scotland maternity inpatient and day case records (SMR02) [16]. The obstetric records of stillbirths were reviewed (TM, AL) to exclude multiple pregnancies, women from ethnic minorities (<1% of total births) and cases with a listed cause of the stillbirth (for example, fetal anomaly, maternal medical disorders, maternal infection). For the remaining cases we used the respective registers to identify two control pregnancies on either side of the date of birth (+/- 7 days) of the stillborn infant. Women with multiple pregnancies and those from ethnic minorities were excluded from the control group. Pregnancies were matched for:
- Maternal age (+/- 5 years), [but for teenage mothers we sought controls aged as close as possible]
- Prematurity (term or preterm) where term was defined as 37+ weeks gestation. For preterm infants matching was done +/- 28 days of the date of birth.
- Parity (nulliparous or parous, where nulliparous was defined as a woman who had never given birth to an infant capable of survival).
Power calculations suggested we needed 260 cases, each matched to 4 controls to have an 80% chance of detecting an odds ratio of 1.5 (at 5% two-tailed significance) for a stillbirth associated with a BMI of > 30 kg/m2, assuming the prevalence of a BMI >30 in the control sample was 30% [17]. The number of stillbirths recorded on the two registers (1995–2012) was 335 cases, of which at least 300 (about 90%) were expected to be singletons. Data for the cases between 1995 and 2008 were collected from obstetric notes at booking and at delivery. Data for cases between 2009 and 2012 were taken from the SMR02 records that had been recorded from data submitted by the Fife Health Board from information held in the women’s obstetric notes.
We recorded the following maternal factors: age, height, weight (at booking), smoking history, details of past obstetric history (including history of previous stillbirth) and postcode, from which we derived the Scottish Multiple Index of Deprivation quintile [18]. Height and weight were used to calculate Body Mass Index (BMI = weight / (height2), kg / m2) which was categorised according to the World Health Organisation’s definitions (<18.5 underweight, 18.5–24.9 ideal range, 25–29.9 overweight or pre-obese, 30–34.9 obese class 1, 35–39.9 obese class 2, 40 or more obese class 3) [19].
The infant factors recorded were gestational age, mode of delivery, gender, birth weight and its percentile for gestational age based on population birth records from Scotland adjusted for infant gender and maternal parity [20]. Small for Gestational Age (SGA) was defined as a birth weight below the 10th percentile (<-1.282 Z-score) of the normal distribution and Large for Gestational Age (LGA) was defined as a birth weight above the 90th percentile (>1.282 Z-score).
Data were analysed with SPSS (version 20) using t-tests, comparison of proportions (Chi-square), analysis of variance and conditional logistic regression analyses. The 5% level was accepted as indicating statistical significance. The association between maternal BMI at booking and stillbirth was assessed in a univariate analysis and in multivariate analyses stratified by parity after adjusting for known confounders. Odds Ratios (OR) and their 95% Confidence Intervals (CI) were calculated for categorical variables, including BMI categorised into subgroups.
Results
Three hundred and thirty five stillbirths were identified, of which 33 were excluded (23 multiple pregnancies or births to women of ethnic minority, 6 with missing case notes and 4 with case notes but a missing BMI). Of the 302 remaining cases a further 31 were excluded (30 where there was a fetal abnormality or maternal infection listed as the cause and 1 for which the stillbirth was a consequence of a road traffic accident). Hence there were 271 stillbirths. For each of these cases we obtained 4 controls for 199 cases, 3 controls for 37 cases, 2 controls for 34 cases and 1 control for 1 case (976 controls in total).
Characteristics of cases and controls are given in Table 1. Matching of cases and controls for maternal age, parity and prematurity was satisfactory. In univariate analyses significant terms associated with an increased risk of stillbirth were maternal weight, BMI, birth weight and Small for Gestational Age (SGA). For SGA the unadjusted Odds Ratio (OR) for a stillbirth was 3.8 (95% CI 2.7 to 5.3). For BMI categories the linear test for trend was significant at P < 0.001, (ANOVA, F = 15.57).
Table 1. Characteristics of stillbirth cases and controls. Values are numbers (percentages) unless otherwise specified. Matching variables are in bold.
|
Characteristic |
Cases (n=271) |
Controls (n=976) |
P-value * |
|
|
|||
|
Age (y): mean (SD) |
28.4 (6.4) |
28.3 (5.8) |
0.70 |
|
Height (cm) |
162.5 (6.7) |
162.9 (6.3) |
0.34 |
|
Body mass (kg) |
73.9 (20.7) |
68.3 (15.7) |
<0.001 |
|
Body Mass Index (kg/m2) |
27.9 (7.2) |
25.7 (5.4) |
<0.001 |
|
Body Mass Index: |
|
|
<0.001 |
|
BMI < 18.5: n (%) |
6 (2.2) |
30 (3.1) |
|
|
BMI 18.5-<25: n (%) |
107 (39.5) |
510 (52.3) |
|
|
BMI 25-<30: n (%) |
77 (28.4) |
259 (26.5) |
|
|
BMI 30-<35: n (%) |
37 (13.7) |
103 (10.6) |
|
|
BMI 35-<40: n (%) |
25 (9.2) |
51 (5.2) |
|
|
BMI >=40: n (%) |
19 (7.0) |
23 (2.4) |
|
|
Smoking status: |
|
|
0.57 |
|
Non- or former smoker: n (%) |
173 (63.8) |
639 (65.7) |
|
|
Current smoker: n (%) |
98 (36.2) |
334 (34.3) |
|
|
Gestational age, booking (wks): mean (SD) |
12.0 (3.8) ** |
12.3 (4.1) ** |
0.34 |
|
Late Booking (> 20 weeks) (%) |
4.4 ** |
5.6 ** |
0.49 |
|
|
|||
|
Nulliparous: n (%) |
143 (52.8) |
510 (52.3) |
0.88 |
|
Primigravida |
108 (39.9) |
374 (38.3) |
0.64 |
|
History of previous stillbirth: n (%) |
7 (2.6) |
17 (1.7) |
0.37 |
|
History of previous miscarriage(s) |
55 (20.3) |
225 (23.1) |
0.34 |
|
History of previous termination(s) |
37 (13.7) |
139 (14.2) |
0.80 |
|
Deprivation quintiles: |
|
|
0.22 |
|
1 (most deprived) |
68 (25.2) |
281 (28.8) |
|
|
2 |
82 (30.4) |
230 (23.6) |
|
|
3 |
54 (20.0) |
196 (20.1) |
|
|
4 |
32 (11.9) |
137 (14.0) |
|
|
5 (least deprived) |
34 (12.6) |
132 (13.5) |
|
|
Male Gender: n (%) |
140 (51.7) |
521 (53.4) |
0.62 |
|
Preterm birth n (%) |
171 (63.1) |
582 (59.6) |
0.30 |
|
Birth weight (g): mean (SD) |
1988 (1109) |
2758 (856) |
<0.001 |
|
Z-score birth weight: mean (SD) |
-0.66 (1.33) |
-0.003 (1.02) |
<0.001 |
|
Small for gestational age †: n (%) |
82 (30.3) |
100 (10.3) |
<0.001 |
|
Large for gestational age: ‡ n (%) |
21 (7.7) |
99 (10.2) |
0.24 |
* Chi-square test (proportions) or unmatched t-test (continuous data).
** n=206 cases, 717 controls
† SGA below 10th percentile (< -1.282 Z-score birth weight)
‡ LGA above 90th percentile (> 1.282 Z-score birth weight)
A conditional logistic regression analysis including the maternal and fetal terms identified increased maternal BMI categories and an SGA infant as associated with stillbirth. The risk of stillbirth from a raised BMI was apparently greater in nulliparous than in parous women (Table 2, Figure 1) though the difference between them in odds ratios per BMI category was not statistically significant.
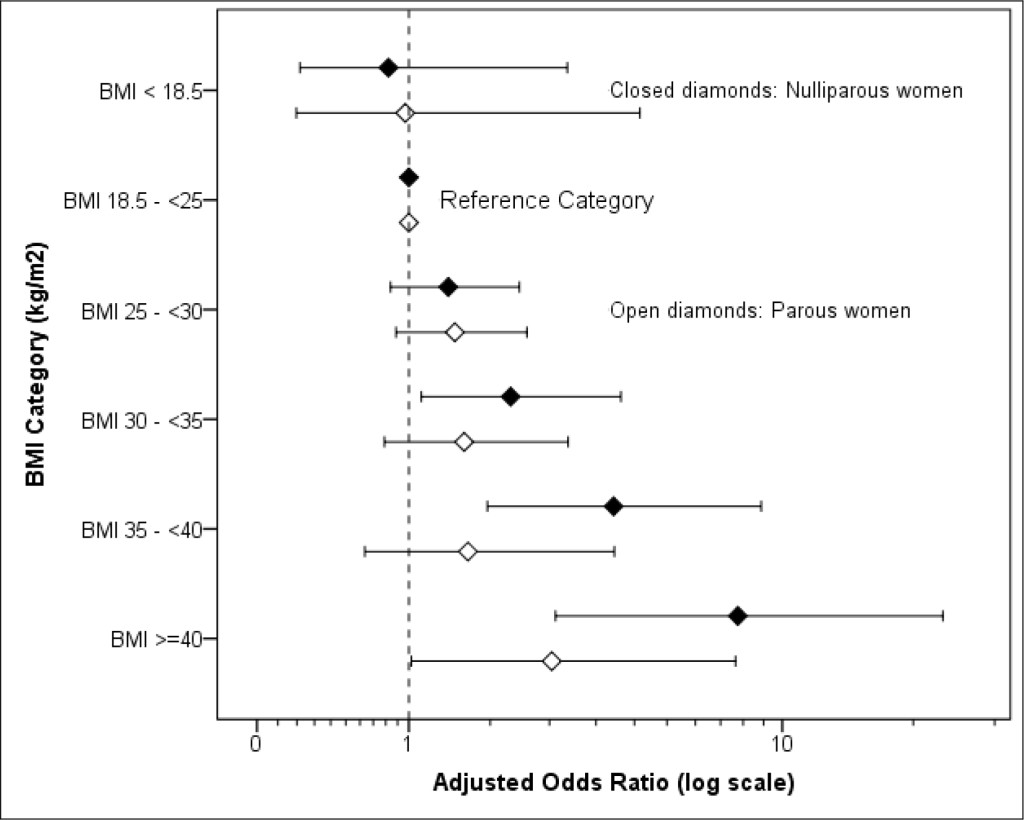
Figure 1. Adjusted odds ratio for stillbirth and BMI in Parous and Nulliparous women (adjusted, where relevant, for smoking status, primigravida, deprivation, fetal sex, SGA, LGA and history of previous stillbirth, previous spontaneous miscarriages and previous therapeutic terminations. For details see Table 2)
Table 2. Conditional logistic regression analysis of maternal and fetal factors and their association with stillbirth.
|
Characteristic |
Reference category |
Nulliparous Women (n=646, 143 cases) |
Parous Women (n=584, 127 cases) |
||||
|
|
|
aOR |
95% CI |
P-value |
aOR |
95% CI |
P-value |
|
Body Mass Index (kg/m2): |
– |
– |
– |
< 0.001 |
– |
– |
0.33 |
|
BMI <18.5 |
18.5–<25 |
0.82 |
0.22–3.12 |
0.77 |
0.97 |
0.20–4.74 |
0.97 |
|
BMI 18.5–<25 |
– |
– |
– |
– |
– |
– |
– |
|
BMI 25–<30 |
18.5–<25 |
1.39 |
0.84–2.31 |
0.20 |
1.47 |
0.89–2.43 |
0.14 |
|
BMI 30–<35 |
18.5–<25 |
2.18 |
1.12–4.27 |
0.022 |
1.57 |
0.79–3.14 |
0.20 |
|
BMI 35–<40 |
18.5–<25 |
4.09 |
1.86–8.99 |
< 0.001 |
1.62 |
0.64–4.11 |
0.31 |
|
BMI >=40 |
18.5–<25 |
7.98 |
2.91–21.89 |
< 0.001 |
2.84 |
1.02–7.88 |
0.045 |
|
Smoking status: |
|
|
|
|
|
|
|
|
Current smoker |
Non– or former smoker |
1.54 |
0.96–2.48 |
0.07 |
0.73 |
0.44–1.18 |
0.20 |
|
Primigravida |
Not first pregnancy |
0.94 |
0.14–6.27 |
0.95 |
– |
– |
– |
|
History of previous stillbirth |
No previous SB |
– |
– |
– |
1.84 |
0.64–5.28 |
0.25 |
|
History of previous miscarriage(s) |
No previous miscarriages |
0.89 |
0.14–5.26 |
0.89 |
0.81 |
0.50–1.31 |
0.40 |
|
History of previous termination(s) |
No previous terminations |
0.74 |
0.12–4.42 |
0.74 |
0.97 |
0.52–1.80 |
0.93 |
|
Deprivation quintiles: |
– |
– |
– |
0.41 |
– |
– |
0.50 |
|
1 (most deprived) |
Least deprived |
0.72 |
0.32–1.64 |
0.44 |
0.87 |
0.41–1.82 |
0.71 |
|
2 |
Least deprived |
1.20 |
0.56–2.59 |
0.64 |
1.27 |
0.60–2.67 |
0.53 |
|
3 |
Least deprived |
1.23 |
0.57–2.66 |
0.59 |
0.74 |
0.34–1.61 |
0.46 |
|
4 |
Least deprived |
0.93 |
0.40–2.18 |
0.87 |
0.83 |
0.37–1.89 |
0.66 |
|
5 (least deprived) |
– |
– |
– |
– |
– |
– |
– |
|
Sex of baby: Male |
Female |
0.82 |
0.54–1.24 |
0.34 |
0.96 |
0.62–1.48 |
0.84 |
|
SGA † |
>=10th percentile |
3.78 |
2.32–6.16 |
<0.001 |
3.76 |
2.17–6.52 |
<0.001 |
|
LGA †† |
<=10th percentile |
0.62 |
0.28–1.37 |
0.23 |
1.14 |
0.55–2.34 |
0.73 |
aOR adjusted odds ratio
† SGA below 10th percentile (< –1.282 Z–score birth weight)
†† LGA above 10th percentile (> +1.282 Z-score birth weight)
Data were split into three epochs (1995–2000, 2001–2006 and 2007–2012). The percentage of stillbirths with a maternal BMI of 30 or more did not differ significantly between periods but that where BMI was 35 or more, and where BMI was 40 or more did show a significant trend over time (P = 0.001 and P = 0.007, respectively). These patterns were not apparent in the controls (Table 3). The difference in mean BMI between stillbirth and controls also increased with time (Table 4). The Standard Deviation (SD) in BMI increased over time, particularly amongst the stillbirth cases (Table 4). To adjust for this change we pooled the cases and controls in each epoch and expressed each woman’s BMI as a Z-score. We then used logistic regression to calculate the odds ratio per unit Z-score (i.e. per SD) in BMI for each epoch and calculated the OR of a stillbirth for a woman with a BMI above the 90th percentile of the distribution (+ 1.282 SD). The OR of a stillbirth for a woman in this category increased over time from 1.21 in 1995–2000 (P = 0.60) to 3.30 in 2007–2012 (P < 0.001, Table 5). These ORs were little affected by also allowing for parity and SGA in a logistic regression.
Table 3. Percentage of stillbirth and controls with an increased maternal BMI (kg/m2) by time periods (1995 – 2012)
|
Time period |
N of cases |
BMI >=30 (%) |
BMI >=35 (%) |
BMI >=40 (%) |
|
Stillbirths |
||||
|
1995–2000 |
89 |
28.1 |
5.6 |
1.1 |
|
2001–2006 |
74 |
28.4 |
18.9 |
8.1 |
|
2007–2012 |
108 |
32.4 |
23.1 |
11.1 |
|
P-value x2 |
– |
0.76 |
0.003 |
0.022 |
|
Test for trend (F), P-value |
– |
(0.45) 0.50 |
(11.1) 0.001 |
(7.4) 0.007 |
|
|
||||
|
Controls |
||||
|
1995–2000 |
298 |
16.8 |
7.0 |
3.4 |
|
2001–2006 |
271 |
15.9 |
7.0 |
1.8 |
|
2007–2012 |
407 |
20.6 |
8.4 |
2.0 |
|
P-value x2 |
– |
0.22 |
0.74 |
0.39 |
|
Test for trend (F), P-value |
– |
(1.97) 0.16 |
(0.46) 0.49 |
(1.31) 0.25 |
Table 4. Difference in mean BMI (kg/m2) between stillbirth and controls by time period
|
Time period |
Cases Mean BMI (SD) (n) |
Controls Mean BMI (SD) (n) |
Difference Mean (SE) |
P-value |
|
1995–2000 |
26.24 (5.31) (89) |
25.25 (5.42) (298) |
0.99 (0.65) |
0.132 |
|
2001–2006 |
27.87 (7.20) (74) |
25.23 (5.28) (271) |
2.64 (0.90) |
0.004 |
|
2007–2012 |
29.24 (8.26) (108) |
26.26 (5.63) (407) |
2.98 (0.84) |
0.001 |
SD: standard deviation, SE: standard error
Table 5. Difference in odds ratio per standard deviation in BMI (kg/m2) by time period.
|
Time period |
Mean BMI (SD) (n) |
OR / SD |
95% CI |
OR of a stillbirth if BMI above 90th percentile* |
|||
|
Chi-square |
OR |
95% CI |
P-value |
||||
|
1995–2000 |
25.48 (5.41) (387) |
1.19 |
0.94–1.50 |
0.28 |
1.21 |
0.60–2.45 |
0.60 |
|
2001–2006 |
25.80 (5.83) (345) |
1.50 |
1.18–1.91 |
6.33 |
2.40 |
1.19–4.81 |
0.012 |
|
2007–2012 |
26.89 (6.38) (515) |
1.52 |
1.25–1.86 |
18.42 |
3.30 |
1.87–5.83 |
<0.001 |
* Chi-square test
Discussion
We posed two questions. The first was to determine the magnitude of the association between maternal obesity and stillbirths. Our study confirmed the work of many others that maternal obesity is an important, independent risk factor associated with stillbirth [8–13]. The trend in increased risk of stillbirth was positively related to BMI category with an apparent stronger association in nulliparous than parous women, which also confirms the work of others [12]. The second question concerned the change in maternal BMI and apparent risk of stillbirth with time. The proportion of stillbirth cases with a maternal BMI > = 35 increased from 5.6% in 1995 – 2000 to 18.9% in 2001–2006 and to 23.1% in 2007 – 2012 (P = 0.001, test for trend). A similar, significant trend was noted for BMI > = 40 (P = 0.007). In comparison, there were no apparent equivalent trends in the controls. The mean and variance of maternal BMI of stillbirth cases also increased over time with the mean difference in BMI between stillbirth cases and their matched controls also increasing. An analysis adjusting for the increase in population variance revealed an apparent increase over time in the risk of a stillbirth from a raised BMI. The relative increase in maternal BMI may partly explain the apparent stubborn stability in the rate of stillbirths in Scotland over the past 2 decades which has remained at about 4–5 / 1000 total births [21].
This study used the WHO classification of obesity and benefited from a population-based source of BMI data that had been routinely collected from measured height and weight at booking since the early 1990s. This enabled us to look at trends over time using data of sufficient statistical power to detect change. Practice in recording BMI has varied in other health boards in Scotland and maternal BMI was not routinely available from the SMR02 records (ISD) before about 2003. We had sought 4 controls per case but were only able to achieve this with 73% (199/271) of stillbirths, though, despite this, our cases were appropriately matched. In addition, we excluded stillbirths with congenital abnormalities as these have been related to maternal obesity in a meta-analysis of 18 studies [22]. We did have history of diabetes and gestational diabetes for the 1995–2008 dataset but not for the SMR02 source (ISD data). However, a preliminary analysis of the 1995–2008 data did not reveal a trend in risk of stillbirth associated with diabetes though the overall prevalence was low (results not shown). Women with a raised BMI are at greater risk of gestational diabetes and hypertensive disorders of pregnancy [23] though, in a large, case-control study the association of maternal obesity and risk of stillbirth was not explained by diabetes or hypertension [9].
In estimating birth weight for gestational age we used population-based data from Scotland (1998–2003) that provided estimates adjusted for fetal sex and parity [20]. The mean Z-score and standard deviation of the 976 control pregnancies was -0.003 and 1.02, respectively, which were appropriate for a reference population where the expected mean and standard deviation would be 0 and 1, respectively. Our findings with respect to stillbirth risk, SGA and raised BMI may have differed had we used fully customised percentile charts for fetal size [24], particularly as 60% of pregnancies were preterm (<37 weeks) when the apparent differences between population based and customised percentiles in determining stillbirth risk in a fetus classified as SGA are larger [25].
Two studies in Scotland have reported an increase in mean maternal BMI of about 1–2 kg/m2 per decade [3,4]. The percentage of pregnant women in Glasgow with a BMI > = 30 at booking increased from 9.4% in 1990 to 18.9% in 2002/04 [3]. This reflects trends in other parts of the UK where the percentage of pregnant women with a BMI > = 30 was 7.6% in 1989 and 15.6% in 2007 [2]. A recent UK study of adverse pregnancy outcomes associated with obesity in nulliparous women reported an increased risk of stillbirth with raised maternal BMI whereby the occurrence of stillbirth in 3102 women with a BMI 20-<25 equated to 1 stillbirth in 443 pregnancies and in 105 women with a BMI >40 to 1 stillbirth in 26 pregnancies [26]. These findings, and our data, raise concerns over future stillbirth rates in the face of a growing epidemic in population obesity in Scotland [15] particularly amongst teenage girls.
Recommendations on the management of obese pregnant women have been made for the UK [27] and, more recently, by the European Board and College of Obstetrics and Gynaecology (EBCOG) which has published standards of care for obstetric and neonatal services to be adopted across Europe [28]. It is recommended that women of child-bearing age with a BMI >30 should have access to services offering advice on weight management pre-conception and be warned of the obstetric risks associated with a raised BMI. Such advice should also be given during antenatal care. However, evidence suggests compliance with providing advice in both circumstances is poor [29]. The EBCOG report recommends all units use multidisciplinary input to develop clear policies and protocols for the care of women with a BMI>30 who should be risk assessed at each antenatal visit. The UK guidelines recommend additional scans in the third trimester for evidence of, amongst other conditions, growth restriction that is associated with about half of all stillbirths [30, 31]. However, sonographic visualisation can be compromised as a result of obesity [32], which in itself could reduce the potential for detection of growth restriction and congenital abnormalities [33]. Finally, it has been suggested that obese women may be less perceptive of reduced fetal movement than women of a healthy weight [12].
In Fife, pregnant women are offered advice and guidance on healthy lifestyle choices. Those overweight or obese are invited to join classes on weight management and offered one-to-one advice from a dietician though anecdotal evidence suggests uptake is inconsistent. Information is given regarding the maximum recommended weight gain throughout pregnancy depending on their BMI. However, the increased risk of stillbirth is apparently related to BMI during early pregnancy rather than to weight gain during it [11, 34] which reinforces the need for greater pre-conception weight management.
What of studies seeking the views of women? In a recent survey of 428 overweight and obese pregnant women in Fife 81% were concerned about their current weight but 39% were unconcerned about potential weight gain during their pregnancy [35]. Of 252 women who were in their second or subsequent pregnancy 47% had failed to return to the pre-pregnancy weight associated with their previous pregnancy. Inter-pregnancy weight gain can increase the risk of stillbirth in a subsequent pregnancy [36, 37]. In a recent qualitative study in the UK 40 women (32 currently pregnant) were asked about public health messages on the risks of stillbirth [38]. In general, they were resistant to the increased weight message, which they considered was not modifiable as ‘all pregnant women are overweight’.
In conclusion, this study has confirmed the association between maternal obesity and an increased risk of stillbirth with a particularly high risk in nulliparous women with a BMI > = 35. The relationship follows a ‘dose-response’ that adds to the body of evidence suggesting a causal link between stillbirth and excess weight in pregnancy per se [39]. The relative importance of maternal obesity as a risk factor, and putative cause of stillbirth (and other adverse pregnancy outcomes) may be increasing with time. This needs to be acknowledged when designing interventions to reduce the incidence of stillbirths. Our findings may be relevant for other populations given the recently published global estimates of obesity in women of child-bearing age [1]. Concerted efforts raising public awareness of the pregnancy-related consequences of obesity are urgently needed though presenting the message represents a challenge.
Contribution to authorship
TM and lC conceived the study with advice from HC. IC obtained the funding. TM, AL reviewed the obstetric notes and contributed to the literature review. AL collected and prepared the data for analysis. DJC advised on the study design, analysed and interpreted the data, contributed to the literature review and wrote the initial draft of the manuscript. All authors contributed to the manuscript and approved the final draft.
Ethics Approval
This was a secondary analysis of data currently available to NHS Fife (SMR02 and obstetric case records). Caldicott approval was obtained to access the obstetric records.
Funding
The study was funded from an NHS Fife research fund.
Acknowledgements
We are grateful to Mr Bryan Archibald of the Public Health Department, NHS Fife for extracting the data for 2009–2012 from the SMR02 data provided routinely from the Information Services Division, NHS Scotland.
References
- Ng M, Fleming T, Robinson M, Thomson B, Graetz N, et al. (2014) Global, regional, and national prevalence of overweight and obesity in children and adults during 1980–2013: a systematic analysis for the Global Burden of Disease Study 2013. Lancet 384: 766–781
- Heslehurst N, Rankin J, Wilkinson JR, Summerbell CD (2010) A nationally representative study of maternal obesity in England, UK: trends in incidence and demographic inequalities in 619 323 births, 1989–2007. Int J Obes 34: 420–428.
- Kanagalingam MG, Forouhi NG, Greer JA, Sattar N (2005) Changes in booking body mass index over a decade: retrospective analysis from a Glasgow Maternity Hospital. BJOG: Int J Obstet Gynaecol 112: 1431–1433.
- Bhattacharya S, Campbell DM, Liston WA, Bhattacharya S (2007) Effect of body mass index on pregnancy outcomes in nulliparous women delivering singleton babies. BMC Public Health 7: 168.
- Confidential Enquiry into Maternal and Child Health (CEMACH) (2008) Perinatal Mortality 2006: England, Wales and Northern Ireland. CEMACH.
- Fretts RC (2005) Etiology and prevention of stillbirth. Am J Obstet Gynecol 193: 1923–1935. [crossref]
- Smith GC, Fretts RC (2007) Stillbirth. Lancet 370: 1715–1725. [crossref]
- Flenady V, Koopmans L, Middleton P, Frøen JF, Smith GC, et al. (2011) Major risk factors for stillbirth in high-income countries: a systematic review and meta-analysis. Lancet 377: 1331–1340. [crossref]
- Stillbirth Collaborative Research Network Writing Group (2011) Association between stillbirth and risk factors known at pregnancy confirmation. JAMA 306: 2469–2479.
- Gardosi J, Madurasinghe V, Williams M, Malik A, Francis A (2013) Maternal and fetal risk factors for stillbirth: population based study. BMJ 346: 108. [crossref]
- Nohr EA, Bech BH, Davies MJ, Frydenberg M, Henriksen TB (2005) Prepregnancy obesity and fetal death: a study within the Danish National Birth Cohort. Obstet Gynecol 106: 250–259.
- Cnattingius S, Bergström R, Lipworth L, Kramer MS (1998) Prepregnancy weight and the risk of adverse pregnancy outcomes. N Engl J Med 338: 147–152. [crossref]
- Kristensen J, Vestergaard M, Wisborg K, Kesmodel U, Secher NJ (2005) Pre-pregnancy weight and the risk of stillbirth and neonatal death. BJOG 112: 403–408. [crossref]
- Information Services Division, NHS Scotland (2009) Trends in perinatal mortality in Scotland: a review over 30 years. Edinburgh, 2009.
- Obesity in Scotland. An epidemiological briefing. Public Health Observatory, Scotland. NHS National Health Services Scotland, 2007 (www.scotpho.org.uk)
- Information Services Division of the NHS National Services Scotland maternity inpatient and day case records (SMR02).
- Kirkwood BR (1988) Essentials of Medical Statistics. Blackwell Scientific Publications. London.
- Scottish Index of Multiple Deprivation (2012) www.scotland.gov.uk/Topics/Statistics/SIMD/.
- World Health Organisation (1997) Obesity: preventing and managing the global epidemic. Report of a WHO consultation on obesity, 1997. WHO, Geneva, 1998.
- Bonellie S, Chalmers J, Gray R, Greer I, Jarvis S, Williams C (2008) Centile charts for birthweight for gestational age for Scottish singleton births. BMC Pregnancy and Childbirth 8: 5.
- Healthcare Improvement Scotland. Scottish Perinatal and Infant Mortality and Morbidity Report 2012. Edinburgh, March 2014.
- Stothard KJ, Tennant PW, Bell R, Rankin J (2009) Maternal overweight and obesity and the risk of congenital anomalies: a systematic review and meta-analysis. JAMA 301: 636–650. [crossref]
- Scott-Pillai R, Spence D, Cardwell CR, Hunter A, Holmes VA (2013) The impact of body mass index on maternal and neonatal outcomes: a retrospective study in a UK obstetric population, Ȁ4–2011. BJOG 120: 932–939.
- Gardosi J, Clausson B, Francis A (2009) The value of customised centiles in assessing perinatal mortality risk associated with parity and maternal size. BJOG 116: 1356–1363. [crossref]
- Hutcheon JA, Zhang X, Cnattingius S, Kramer MS, Platt RW (2008) Customised birth weight percentiles: does adjusting for maternal characteristics matter? BJOG 115: 1397–1404.
- Mantakas A, Farrell T (2010) The influence of increasing BMI in nulliparous women on pregnancy outcome. Eur J Obstet Gynecol Reprod Biol 153: 43–46. [crossref]
- Centre for Maternal and Child Enquiries & Royal College of Obstetricians and Gynaecologists. CMACE & RCOG Joint Guideline. Management of women with obesity in pregnancy. London, 2010.
- European Board and College of Obstetrics and Gynaecology (2014) Standards of Care for Women’s Health in Europe: Obstetric and Neonatal Services 2014.
- Centre for Maternal and Child Enquiries (2010) Maternal obesity in the UK: findings from a national project. London, 2010
- Reddy UM1 (2007) Prediction and prevention of recurrent stillbirth. Obstet Gynecol 110: 1151–1164. [crossref]
- Vais A, Kean L (2012) Stillbirth-is it a preventable public health problem in the 21st century? Obstet Gynaecol Reprod Med 22: 129–134
- Hendler I, Blackwell SC, Bujold E, Treadwell MC, Wolfe HM, et al. (2004) The impact of maternal obesity on midtrimester sonographic visualisation of fetal cardia and craniospinal structures. Int J Obesity 28: 1607–1611
- Best KE, Tennant PW, Bell R, Rankin J (2012) Impact of maternal body mass index on the antenatal detection of congenital anomalies. BJOG 119: 1503–1511. [crossref]
- Stephansson O, Dickman PW, Johansson A, Cnattingius S (2001) Maternal weight, pregnancy weight gain, and risk of antepartum stillbirth. Am J Obstet Gynecol; 184: 463–469.
- Leslie WS, Gibson A, Hankey CR (2013) Prevention and management of excessive gestational weight gain: a survey of overweight and obese pregnant women. BMC Pregnancy Childbirth 13: 10. [crossref]
- Villamor E, Gnattingius S (2006) Interpregnancy weight change and risk of adverse pregnancy outcomes: a population-based study. Lancet 368: 1164–1170.
- Whiteman VE, Crisan L, McIntosh C, Alio AP, Duan J, et al. (2011) Interpregnancy body mass index changes and risk of stillbirth. Gynecol Obstet Invest 72: 192–195. [crossref]
- Stillbirth and Neonatal Death Charity (SANDS). Research Report: Stillbirth Public Health Messages, November 2013.
- Salihu HM (2011) Maternal obesity and stillbirth. Semin Perinatol 35: 340–344. [crossref]