Abstract
The topic of rider weight in relation to a horse´s body weight, the so called Body Weight Ratio (BWR), has been discussed widely with regard to both health and performance by the equestrian community. However, direct measurements of the effects of a riders weight on the back muscle of horses is lacking. This study uses non-invasive multi-frequency bioimpedance (mfBIA) and Acoustic Myography (AMG) to measure the health and performance of m.Longissimus dorsi in 10 horses and with three groups of riders; Light-weight (BWR 17%), Medium (BWR 19%) and Heavy-weight (BWR 27%). mfBIA values obtained from the horses prior to being ridden at the walk and trot, revealed information about muscle mass, swelling, resting tension and metabolic activity. AMG values revealed not only the real-time efficiency/coordination of the muscle, but also it’s spatial- and temporal-summation during periods of physical activity. The results revealed no significant effect of rider weight on the mfBIA parameters of the horses in this study, and AMG values were likewise not significantly different across the three rider groups. It is tentatively concluded, that rider weight, within the limits of this study, does not appear to affect back muscle health or performance.
Introduction
Despite a lack of scientific basis for the introduction of prescribed loading capacities for horses, the Japanese Riding for the Disabled Association describes a loading capacity of between 16–17% of the body weight of the horse, whilst Hadrill in their volume entitled “Horse Healthcare”, suggests a limit of 33 to 50% of the horse´s body weight [1,2].
Interestingly, Matsuura and colleagues published findings that short and wide horses are better suited to riding with disabled individuals, so called therapeutic riding, although their gait may be disrupted when riders are too heavy [3]. It has also been reported that horses carrying loads of 25–30% of their body weight have both elevated heart rates and respiration rates [4].
Then recently, a study of 8 Icelandic horses confirmed the findings of Powell and colleagues [4], by showing that body-weight ratios of 20–35% result in an increase in heart rate, an elevated frequency of breathing as well as a rise in rectal temperature, all physiological changes that one might expect with an elevated level of physical exertion [5]. More interestingly though, and in keeping with the results of Matsuura and colleagues [3], this same research group subsequently published findings that show that the stride length of horses becomes significantly shorter and more frequent with increasing rider weight [6]. This is not altogether surprising, as anyone who has walked whilst carrying something heavy will have noticed that they do not walk with long strides, but rather short and frequent movements of their feet.
Whilst these and other studies investigating the influence of the rider on the horse have evaluated weight and riding technique [7–9], there is still a lack of direct methodology, evaluating the effect of loading on the back muscles of ridden horses.
This study has therefore chosen to measure the changes in the back muscle Longissimus dorsi of horses ridden by riders of different body-to-weight ratios (Light-weight, Medium and Heavy-weight) using the non-invasive techniques of multi-frequency bioimpedance (mfBIA), and Acoustic Myography (AMG). mfBIA as a method, can be used to directly assess changes in muscle tension, metabolic status and cellular health, whilst AMG enables the real-time assessment of muscle contraction (coordination, spatial summation, temporal summation) [10–12]. The hypothesis being, that rider weight per se, does not affect muscle health or performance.
Materials and Methods
Subjects
Ten healthy horses were used for data collection. The population consisted of 2 mares and 8 geldings, of which there was 1 Danish Warmblood, 1 Oldenburg, 4 Icelandic horses, 1 OX Arabian, 1 Appaloosa and 2 Fjord horses. The mean age of the horses was 10.4 ± 2.5 years. The body weights of the horses in this study ranged from 334–732 kg.
In order to investigate muscle health and function of the ten subjects, mfBIA measurements and AMG recordings were conducted on m. Longissimus dorsi. The measurements were carried out at the respective home of the subjects, in order to avoid any stress or environmental interference. Furthermore, the riders were recommended not to exercise their horse for between 24–48 hours before the recordings were due to be made, in order to achieve the best possible mfBIA and AMG results. These measurements, which were non-invasive, were taken with the full informed consent of the owners and riders.
Equipment and Measurements
Acoustic Myography
A gel pad was placed under the saddle (Acavallo Gel; Lonato del Garda, IT), with the AMG recording unit (CURO-diagnostics ApS, Bagsværd, DK) attached to the pad behind the saddle. CURO sensors (CURO-diagnostics ApS) were placed on both the left and right sides of the horse at the region of m. Longissimus dorsi. The muscle sites measured were prepared with acoustic gel (CURO-diagnostics ApS), which was thoroughly rubbed into the overlying hair to ensure a good connection with the skin above the muscle. Similarly, the two sensors were prepared with acoustic gel and attached to the horse using flexible self-adhesive bandage (Animal Polster, Snögg Industry AS, Kristiansand, NO). Smaller pieces of self-adhesive bandage were used to secure sensor cables to avoid errors caused by irritation of the horse and contact between the cables and sensors. The sensors were then connected to the CURO unit. Recordings were made to both an iPad in real-time, as well as directly to the CURO unit itself, in the form of a WAV file. Data collection was made during walk and trot on both left- and right-hand circles. The subjects were ridden by their usual riders and with their usual saddle and riding equipment. For further details see [10,12].
Multi-frequency bioimpedance
For mfBIA measurements, the horse was restrained in a calm standing position. The region of m. Longissimus dorsi of interest was prepared by the application of conductive paste (Ten20; Weaver and Company, Aurora, Colorado USA), followed by placement of four pure platinum electrodes (1 x 3cm; made by AH) on to the prepared muscle. The mfBIA unit (ImpediVET BIS 1, Pinkenba, AU) providing a current of 1000 μA, was subsequently attached to the electrodes. Recordings were carried out at 256 frequencies ranging from 3 kHz to 850 kHz and repeated six times with a one second interval. By repeating the recordings, it was possible to avoid any slight movement artifacts or changes in the R or Xc values due to cable movement or change in body stance (Elbrønd et al., 2015). Throughout the recordings, the R-, Xc- and the full Cole-Cole plot was assessed for normality, in order to validate the strength and accuracy of the recordings. For further details see [11].
AMG data processing and analysis
Recorded data, stored on the CURO, was analyzed for its efficiency (E-score), amplitude (S-score; spatial summation) and frequency (T-score; temporal summation), using the CURO System Software (CURO-diagnostics ApS, Bagsværd, DK). The analysis was carried out with a maximum frequency (max T) of 160 Hz and a maximum amplitude of 0,99 (max S) equivalent to approx. 1V. Analysis was carried out for both sides of m. Longissimus Dorsi while riding on both circles.
The E-, S- and T-values from the two sides of the muscle were pooled and the means ± standard deviations calculated for walk and trot within the groups; Light-weight, Medium and Heavy-weight.
mfBIA data processing and analysis
The mfBIA data were analyzed using the ImpediVET software. At the time of recording, the Cole-Cole plots were assessed for a normal distribution and the R and Xc values and plots were examined to ensure precise recordings. Subsequently, a detailed analysis was performed at 50 kHz, where the parameters Z, R, Xc, fc, Re, Mc and Ri were obtained for each subject. The Phase Angle (PA) was calculated as (arctan Xc/R). The mean ± standard deviation for each group; Light-weight, Medium and Heavy-weight were calculated.
Statistical analysis
AMG and mfBIA data were initially assessed for normal distribution using a D’Agostino & Pearson normality test in GraphPad Prism 7 for Windows (La Jolla, CA, USA). Due to the small sample size (n=10), the normality test had very little power to discriminate between normal and non-normal distributions. Nevertheless, the majority of the tested data turned out to be normally distributed.
Results
AMG results
The AMG data for the measured horses during both walking and trotting revealed a non-significant difference for the E-, S- and T-scores for all three weight groups; Light-weight (BWR = 17%; n=2), Medium (BWR = 19%; n=6) and Heavy-weight (BWR = 27%; n=2) (see Figs 1 & 2).
At the walk, a very similar E-score and T-score were found for all three rider groups, indicating an identical degree of muscular efficiency/coordination and temporal summation (approx. 75Hz). Moreover, despite an apparently higher S-score for the Light-weight and Heavy-weight groups compared with the Medium group, there was no significant difference between the values in terms of spatial summation. This serves to indicate that muscle function for all three groups was not statistically different at this gait.
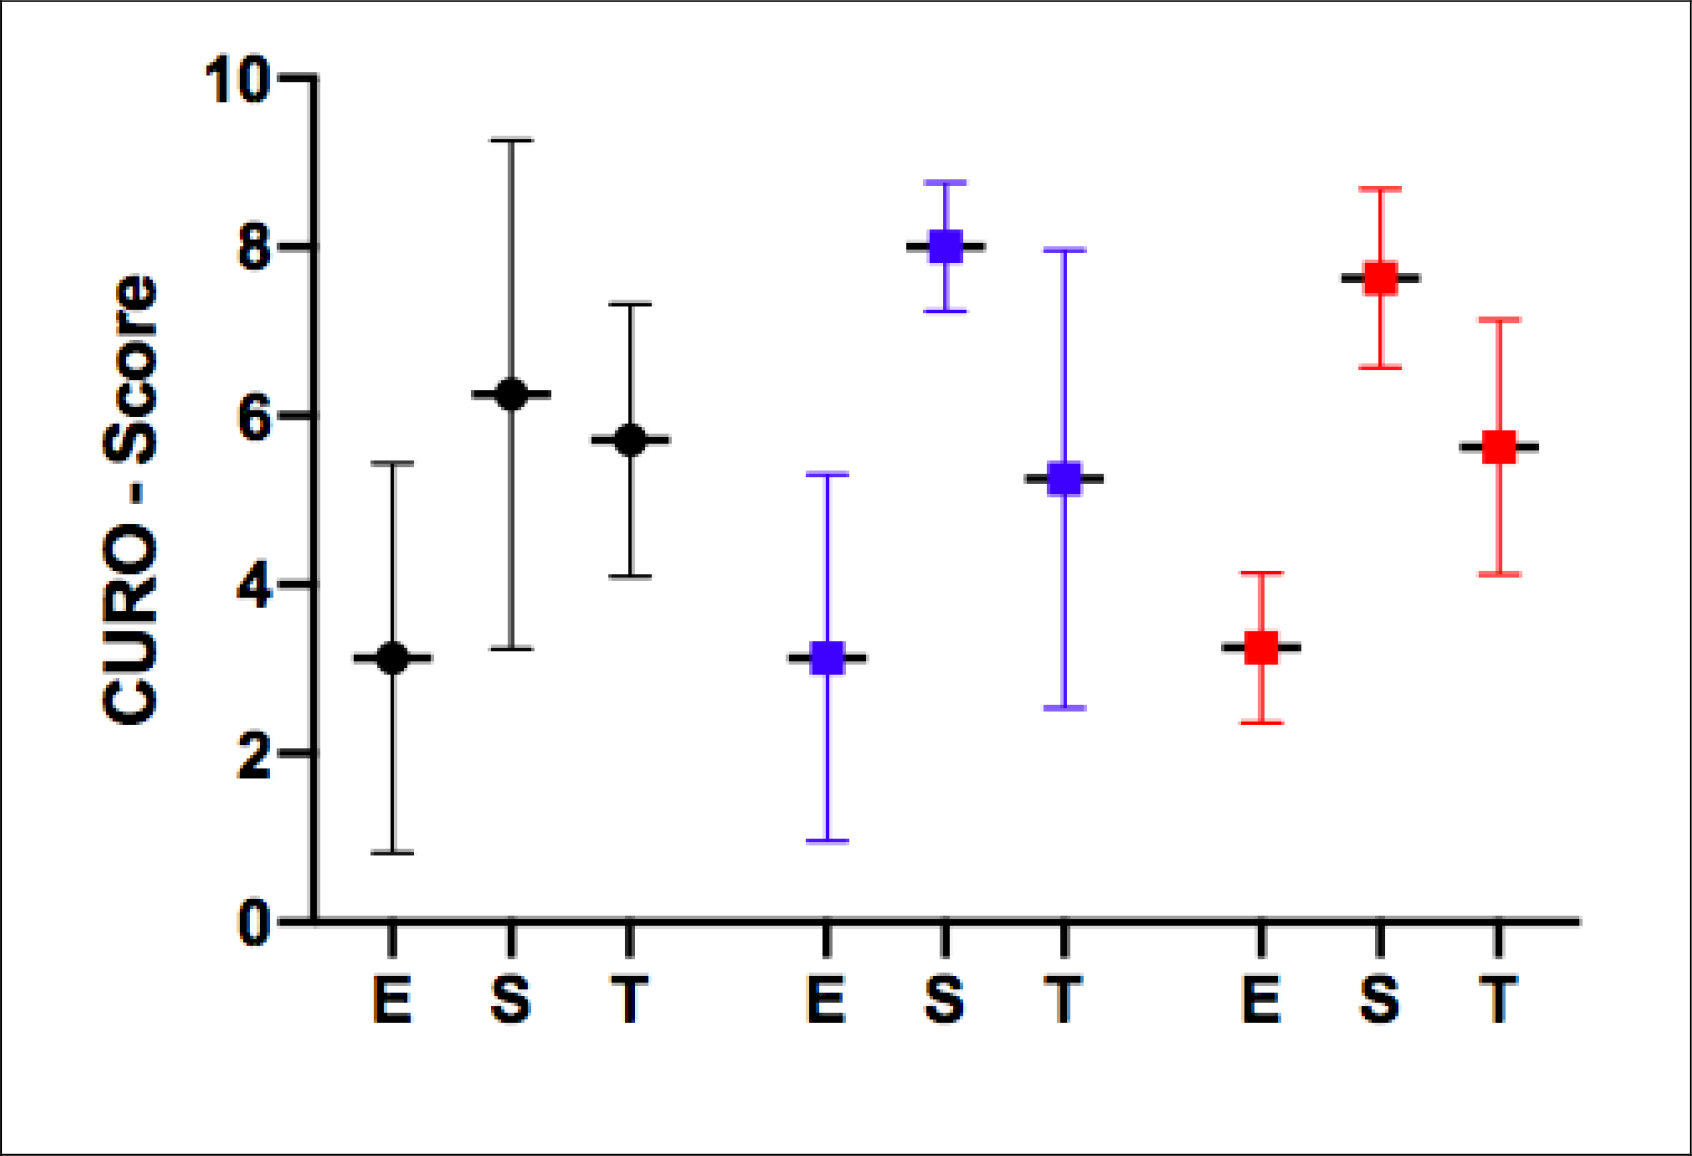
Figure 1. The mean ± SD of the E-, S- and T-scores recorded during walking for m. Longissimus Dorsi. Values obtained from both sides have been pooled within the three groups. Red = Heavy-weight (n=4; 2 horses x 2 muscles), Blue = Light-weight (n=4; 2 horses x 2 muscles), Black = Medium groups (n=12; 6 horses × 2 muscles).
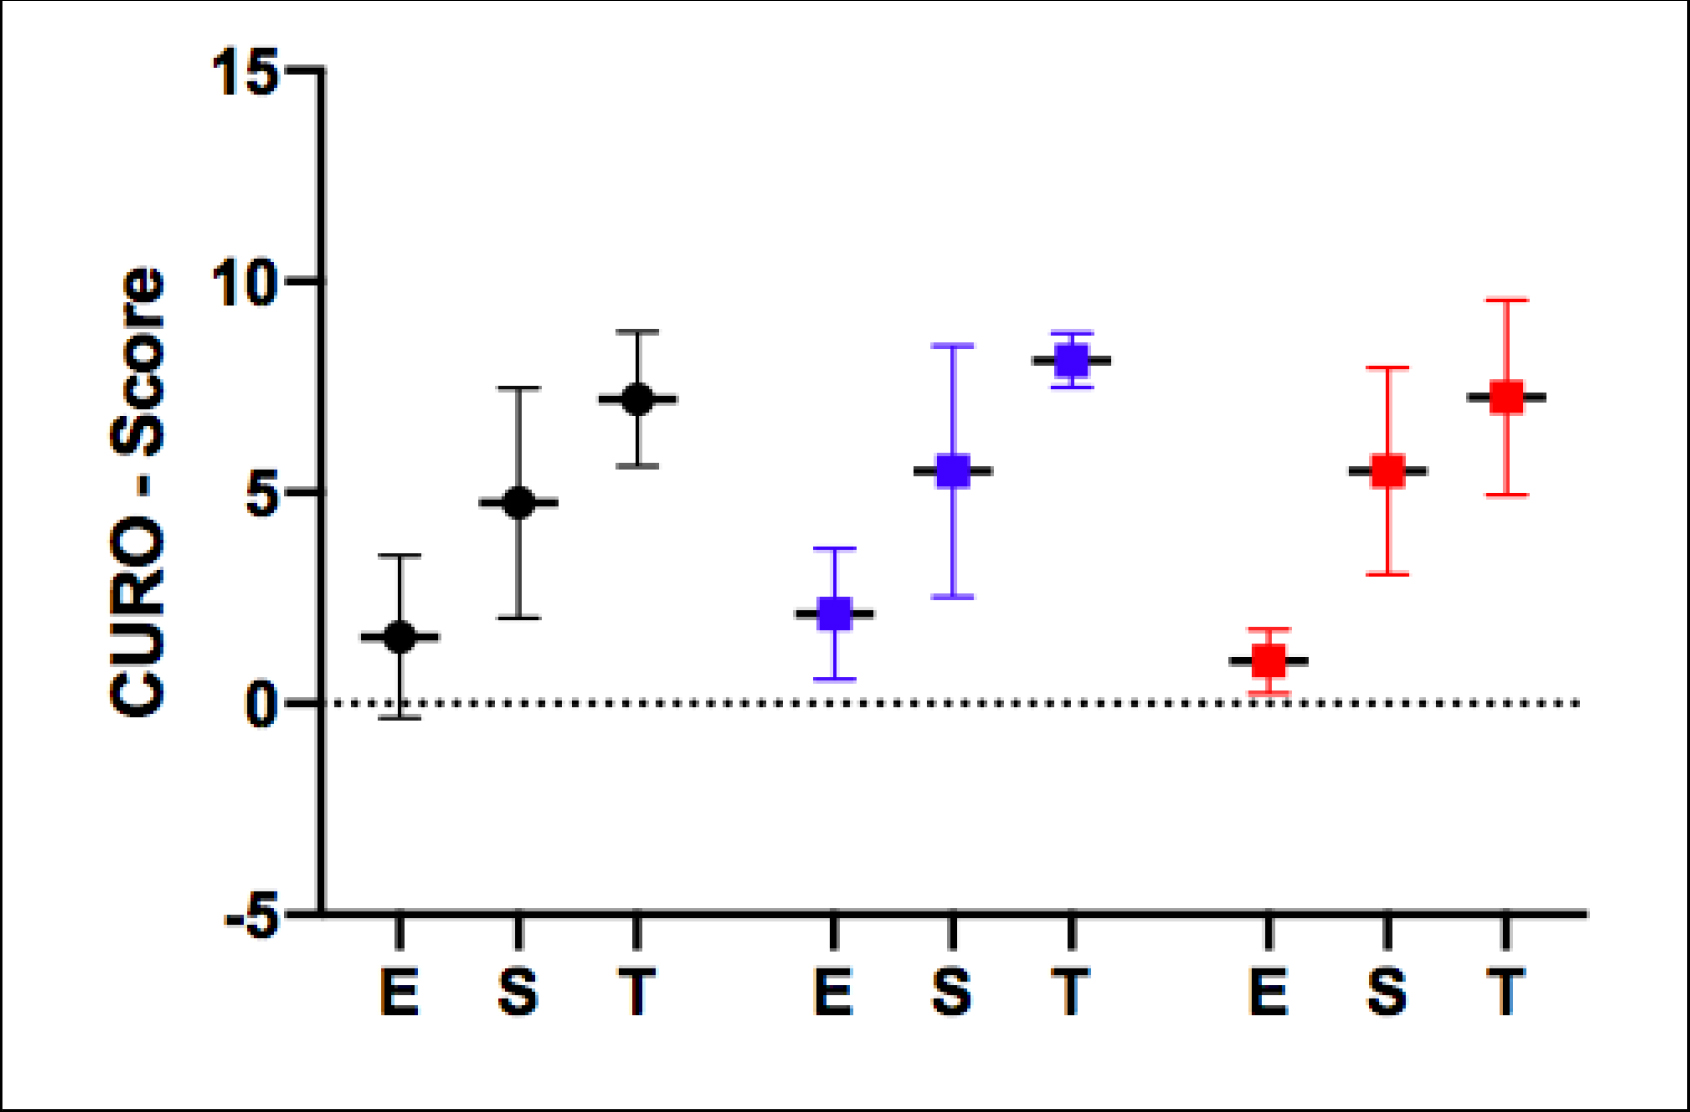
Figure 2. The mean ± SD of the E-, S- and T-scores recorded during trotting for m. Longissimus Dorsi. Values obtained from both sides have been pooled within the three groups. Red = Heavy-weight (n=4; 2 horses x 2 muscles), Blue = Light-weight (n=4; 2 horses × 2 muscles), Black = Medium groups (n=12; 6 horses × 2 muscles).
At the trot, a very similar E-score, S-score and T-score was found for all three rider groups, indicating an identical degree of efficiency/coordination, spatial summation and temporal summation (approx. 40Hz). This likewise serves to indicate that muscle function for all three groups was not statistically different at this gait.
However, when comparing the AMG data from the two gaits, the E- and S-scores were found to be consistently higher during the walk for all three groups, whereas the highest T-score values were found during trotting.
.mfBIA results
No consistent body-weight-ratio patterns were noted for either the Light-weight, Medium or Heavy-weight groups, nor were any significant differences noted. When the Light-weight mfBIA values were plotted against those obtained for the Heavy-weight group (see Fig 3), it was found that values for muscle mass (Z; PA) were comparable, as was the indicator of resting tension (fc). Likewise, there were no signs of dehydration or inflammation (R; Re) between the two extremes. There was an elevated value for (Ri), which has been shown to be correlated with VO2-max at rest in the Heavy-weight cf Light-weight group, but this was not found to be significant.
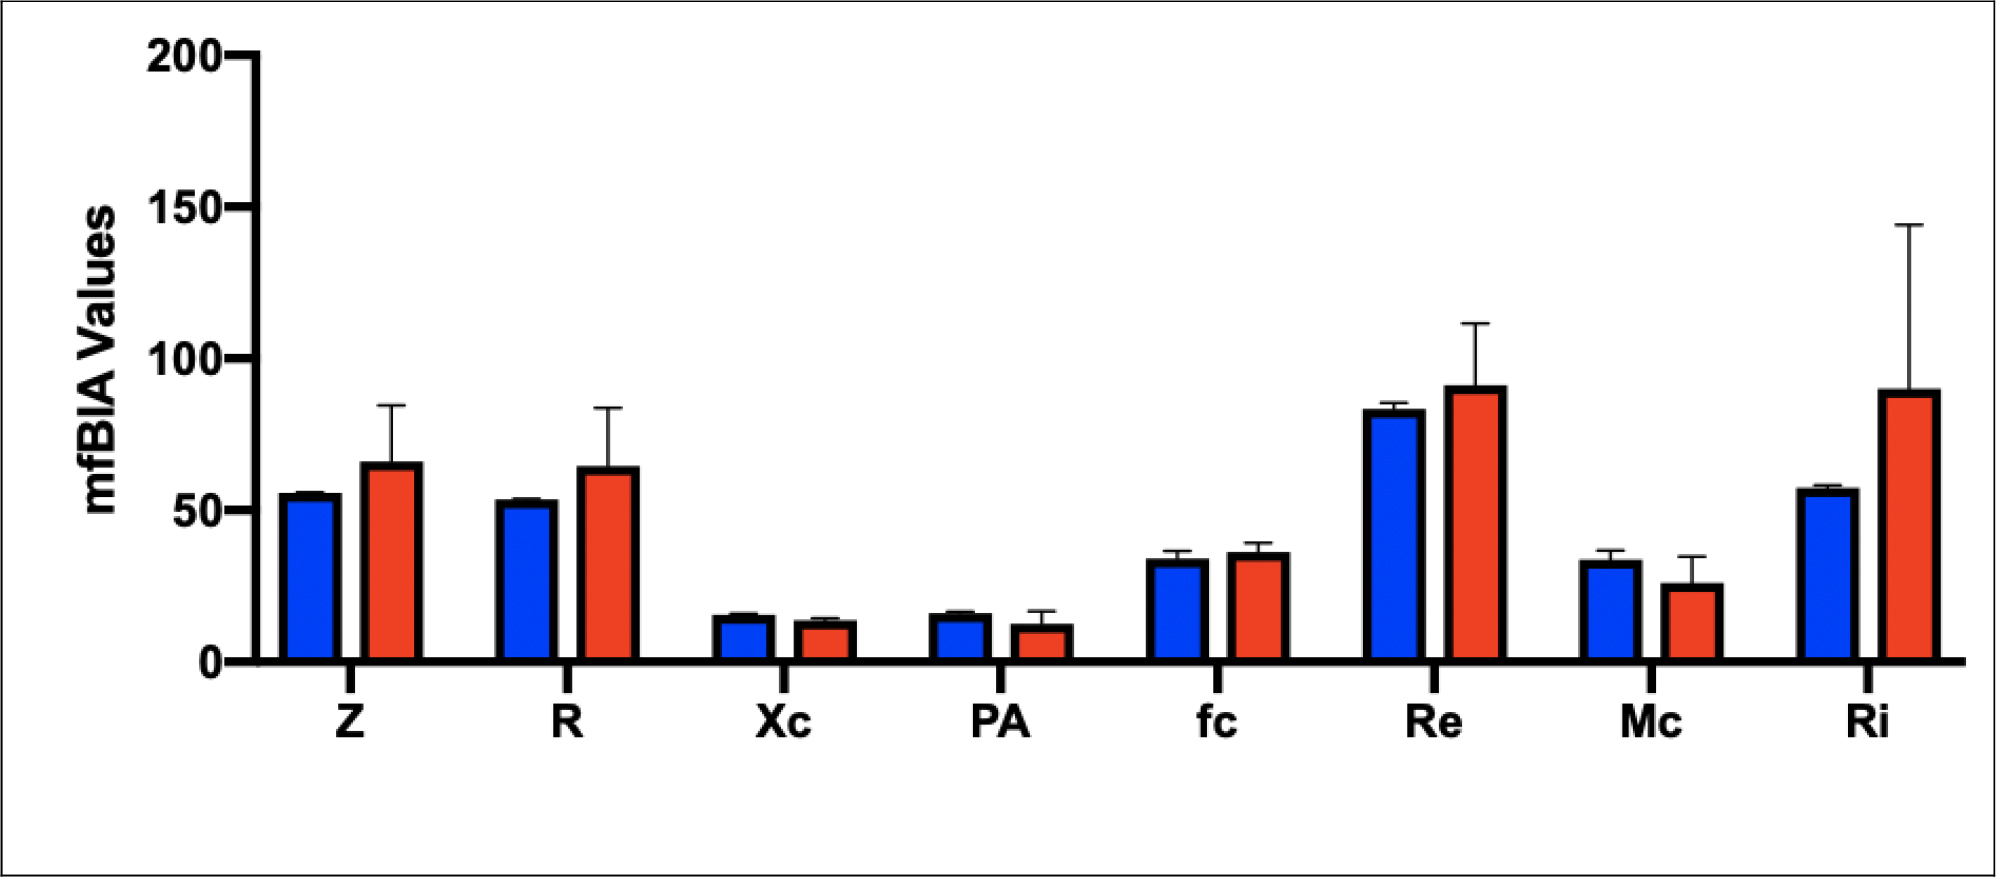
Figure 3. mfBIA values for the two extreme body weight groups, measured for m. Longissimus Dorsi. Red = Heavy-weight (n=2), and Blue = Light-weight groups (n=2). Values are mean ± SD.
Discussion
Whilst these findings represent a limited data set, they appear to suggest that the weight of the rider to the horse´s weight per se does not affect muscle function or muscle health, as documented by the AMG and mfBIA measurements.
In terms of possible confounding factors, it should be noted that whilst two horses from the Medium group had been competing in the days up to the study, a factor that might have influenced the accuracy of the measurements, this level of physical activity does not appear to have had any negative effect.
The mfBIA and AMG data reveal a very similar picture, that is one in which the back muscle Longissimus dorsi is quite relaxed (low fc value) and very comparable across the two extremes of Light-weight and Heavy-weight groups. The mfBIA data further reveals a very comparable muscle mass (Z, PA) for these two extreme groups, and there are no signs of swelling or inflammation (R, Re). Indeed, it can be concluded that this back muscle is fit and healthy for both extreme groups, as well as for the Medium group of riders, being comparable with previously published values [11].
The AMG data likewise, reveal fit and healthy scores for m. Longissimus dorsi. It is interesting to note a very similar E-score for the three groups, suggestive of a similar level of training and performance, as this value increases with highly trained horses, and falls with inactivity and convalescence. What is striking is that the T-score remains very consistent between the groups. One could have anticipated that some degree of muscle soreness was present in the Heavy-weight group of horses, and it is known that soreness/pain affects temporal summation, raising the firing frequency of afflicted muscles [13]. However, this was not observed either at the walk or the trot.
It is interesting though that the change in gait from walk to trot is reflected in the E,S,T-scores as has been reported previously in dogs [14]. It can be seen that there is a fall in the E-score as the muscle becomes more active with the change from walk to trot, contracting more of the time (E-score approx. 3 to 1–2). At the same time the S-score falls a little from 6–8 at the walk to approx. 5 at the trot, reflecting an increase in fibre recruitment (spatial summation). In contrast though, the T-score increases from approx. 5.5 at the walk (approx. 75Hz) to 7.5 at the trot (approx. 40Hz). This improvement in the T-score, which represents a drop in firing frequency, is very comparable with values for dogs and m.longissimus lumborum, as they change from walk to trot [14].
In conclusion, whilst these data do not reveal any suggestion that high rider-to-horse body weight ratios have an adverse effect on muscle health or function, as assessed by the non-invasive techniques of mfBIA and AMG, there is now a great need for a more detailed study in this field.
Acknowledgement
The authors are indebted to the horse owners for allowing us to measure them and their horses.
Conflicts of Interest
AH is in the process of forming a company with the aim of commercializing the AMG equipment.
Reference
- Matsuura A, Sakuma S, Irimajiri M, Hodate K (2013) Maximum permissible load weight of a Taishuh pony at a trot. Journal of Animal Science 91: 3989–3996.
- Hadrill D (2002) Horse Healthcare. 1st Edition. ITDG Publishing, London.
- Matsuura A, Ohta E, Ueda K, Nakatsuji H, Kondo, S (2008) Influence of equine conformation on rider oscillation and evaluation of horses for therapeutic riding. Journal of Equine Science 19: 9–18.
- Powell DM, Bennett-Wimbush K, Peeples A, Duthie M (2008) Evaluation of indicators of weight-carrying ability of light riding horses. Journal of Equine Veterinary Science 28: 28–33.
- Stefánsdóttir GJ, Gunnarsson V, Roepstorff L, Ragnarsson S, Jansson A (2017) The effect of rider weight and additional weight in Icelandic horses in tölt: part I. Physiological responses. Animal 11: 1558–1566.
- Gunnarsson V, Stefánsdóttir GJ, Jansson A, Roepstorff L (2017) The effect of rider weight and additional weight in Icelandic horses in tölt: part II. Stride parameters responses. Animal 11: 1567–1572.
- Clayton HM, Lanovaz JL, Schamhardt HC, Van Wessum R (1999) The effect of a rider´s mass on ground reaction forces and fetlock kinematics at the trot. Equine Veterinary Journal 30: 218–221.
- Roepstorff L, Egenvall A, Rhodin M, Byström A, Johnston C, et al (2009) Kinetics and kinematics of the horse comparing left and right rising trot. Equine Veterinary Journal 41: 292–296.
- De Cocq P, Duncker AM, Clayton HM, Bobbert MF, Muller M, et al (2010) Vertical forces on the horse´s back in sitting and rising trot. Journal of Biomechanics 43: 627–631.
- Riis KH, Harrison AP, Riis-Olesen K (2013) Non-invasive assessment of equine muscular function: A case study. Open Veterinary Journal 3: 80–84.
- Harrison AP, Elbrønd VS, Riis-Olesen K, Bartels EM (2015) Multi-frequency bioimpedance in equine muscle assessment. Physiological Measurements 36: 453–464.
- Jensen A-M, Ahmed W, Elbrønd VS, Harrison AP (2018) The efficacy of intermittent long-term bell boot application for the correction of muscle asymmetry in equine subjects. Journal of Equine Veterinary Science 68: 73–80.
- Graven-Nielsen T, Kendall SA, Henriksson KG, Bengtsson M, Sörensen J, et al (2000) Ketamine reduces muscle pain, temporal summation, and referred pain in fibromyalgia patients. Pain 85: 483–491.
- Fenger C, Harrison AP (2017) The application of acoustic myography in canine muscle function and performance testing. SOJ Veterinary Science 3: 1–6.