Abstract
We present the results of a case history experiment for the introduction of a traditional product, mango nectar, to Pakistan, which has several juice and beverage brands. The objective was to determine whether one could discover the convincing messages for this new product, the brand, and the correct product price, and in turn the product that the mango nectar would replace. The data revealed a clear hierarchy of messages, which were primarily brand and price as the strongest motivators of interest in the mango nectar, and only far below did product features emerge, and below those features emerged other brands and higher prices as the least motivating. A more coherent picture emerged from expected substitution of the nectar for other beverages, with three mind-sets emerging. In order of size these were substitution for juice, for carbonated soft drink, and for lassi, respectively. The segmentation by substitution also revealed that for each substitution mind-set different product features emerged driving interest in the mango nectar.
Introduction
Marketers entering a crowded category often attempt to sell their product by better messaging, once the product is developed. Often, the process of entering the category is a mix of reasoned economic analysis about the local and market and product, and a guess about just what to say to entice consumers to try the product. Even the most experienced marketers who are familiar with product marketing are ‘stumped’ when it comes to the question of ‘just exactly what do we say to sell THIS particular product?’
The problem of what to create in a product, and what in turn, to present to the public in advertising and promotion, remains one of the most vexing problems. An entire industry of consumer research has grown up with metrics measuring the response of consumers to features that the product has or delivers (promise testing, concept design), and well as the response of consumers to the specific messages designed to communicate (message testing, concept evaluation.)
During the past 35 years, author Moskowitz and collaborators have worked on the problem of ‘how to discover the mind of the consumer’ by methods which are rapid, inexpensive, scientifically validated, and knowledge-creating, respectively. Rather than achieving the former by evaluating a limited number of test stimuli with many consumers, hoping thus to be precise, the approach used by Moskowitz works in a different direction. The strategy is to test many different aspects of a product or service, these aspects incorporated into many different ‘vignettes,’ or ‘test concepts,’ these vignettes in turn created by experimental design. The analogy is the MRI, which takes many snapshots of tissue, and puts the snapshots together by computer to create a three-dimensional model of the tissue. With the strategy adapted for concepts, and labelled ‘Mind Genomics,’ the approach produces a model of the idea, looking at the response to many different aspects of the idea.
We apply this approach in Pakistan to a well-known product in search of greater distribution. The product is mango nectar. This study presents the results of the marketing study, looking for the appropriate words to use which interest prospective consumers in this beverage. There is a great deal published on mangoes, some on mango nectar, but most of the publications appear to focus on the technical aspects of mangoes and mango nectar, not on the marketing of, and communication about mangoes. The reason for the focus on the technical rather than on the marketing is simply one of evolution. Marketing studies focus on bigger problems than the study of how to promote one specific product, although there is some literature dealing with the marketing of mango pulp [1,2]. In contrast, technical studies focus on the product itself, because the technical issues can produce a ‘neat and tidy’ scientific experiment. Good examples of the sensory and consumer work about mangoes can be found in a variety of representative publications [3–5].
Rather than the conventional focus group which tests ‘complete’ concepts, or even a quantitative study to evaluate the response to a concept among hundreds of respondents, we used experimental design of ideas, conjoint measurement, applied to a well-known product, mango nectar, but in a new population, Pakistani consumers. The study was part of an effort to introduce the new science of Mind Genomics to the Pakistani business world, using as a proof point the results with a well-known type of product.
Method
We used the emerging science of Mind Genomics [6,7], based on conjoint measurement [8]. Briefly, Mind Genomics is founded on the key point of view that the most appropriate way to understand people’s responses to specific products and situations is from the ‘bottom-up,’ in a style that can be best described by the analogy to the artistic painting style known as pointillism.
Pointillism is a way of painting in which small separate dots of pure color are used to form images. The artist paints the picture with hundreds of tiny dots, mainly of red, yellow, blue and green, with white. The eye and mind of the viewer mix the colours to make different shades of these colours, as well as orange, purple, pink, and brown depending on the way the dots of colour are arranged. (https://simple.wikipedia.org/wiki/Pointillism)
Mind Genomics builds up an understanding of the world by doing many small studies on specific topics. When the topics are related, and the researcher stands back and looks at the main findings across these small studies with specific topics, an emergent picture of the world comes into view. Unlike pointillism in art, however, each dot, or each small experiment, provides valuable information, in and of itself.
The study here represents one of those dots, a study on the response to the idea of mango nectar, among Pakistani respondents, who are accustomed to the product.
Mind Genomics follows a series of well-choreographed steps, which, when combined, constitute a cartographic study of a particular topic. In other words, the Mind Genomics study ‘maps out’ the response to different aspects of the topic. For our study on mango nectar, these different aspects.
- Select the raw materials, namely questions and answers (silos and elements.) Mind Genomics begins by asking a series of questions (silos), which tell a story, and then requiring six different answers to each question (elements.) This first step is usually the hardest, requiring the researcher to think in a new, more disciplined fashion. Most researchers have trouble formulating the questions to tell a story. Once, however, the questions are formulated, it is quite easy to come up with six answers. The issue is usually one of reducing the number of answers. Table 1 shows the six questions, and the six answers per questions. The important thing to note is that each answer is presented as a short declarative statement, easy to read.
- Test vignettes comprising mixtures of these answers, constructed by an underlying experimental design. The typical approach by researchers asks the respondent to evaluate each answer (element), one answer at a time. This is the so-called questionnaire approach, which requires the respondent to introspect about the element. With such an approach, one can get a rating of each of the 36 elements. The problem with questionnaire data is that the stimulus is one-dimensional, allowing the respondent to answer in a way that is presumed to be most appropriate, and presumably reflects the way in which the respondent would like to be seen. This ‘mental editor’ leading to possibly biased answers can be eliminated by presenting the respondent with a combination of different elements, i.e., a vignette, and then by instructing the respondent to evaluate the entire vignette as one entity. This latter approach is an experiment, because we deduce the response to the single element by deconstructing the response to the vignette into the component contributions of the different elements.
- Select the Experimental Design: For each respondent, create a set of 48 vignettes, each vignette comprising either three elements (12 of the 48 vignettes), or four elements (36 of the 48.) Each of the 36 elements appears exactly five times across the 48 vignettes, and absent 43 times. Furthermore, the vignette comprises at most one element (answer) from each silo (question.) Thus, the vignettes are incomplete, which does not hinder the respondent from assigning an answer. Finally, each respondent evaluates a unique set of 48 vignettes, covering a large proportion of the possible vignettes [9].
- Dynamically Create Vignettes and Present them to Respondents: Each respondent rated the individualized set of 48 vignettes on two rating scales (shown in Table 2). Figure 1 shows an example of a single vignette with the two rating questions. The strategy to make the experiment less onerous is to present the 3–4 elements as simple phrases, one atop the other, in double spacing. The spacing and the structure of single phrases presented without any connectives make it easy for the respondent to ‘graze’ for the relevant information. The first rating question is an example of a category or Likert scale, showing different levels of interest. The second rating question is an example of a nominal scale, in which the scale points do not have numerical value, but rather are placeholders for different or alternative phrases. The respondent’s task when answering this second question is to select the ONE end use. At the top of both figures is a pair if numbers, 2/67 denoting the second ‘logical’ screen out of a total of 67 such screens. The sequence number (2/67) does not change when the vignette is the same but the rating question changes from purchase intent to selection of a product that the mango nectar will ‘replace.’ The experiment lasts approximately 15 minutes and moves along quickly. Every effort is made to keep the task simple, and to promote rapid evaluations, rather than considered, effortful evaluations. The former has become popularly called ‘System 1 thinking,’ an intuitive, so-called ‘gut reaction,’ typical of how people react to the stimuli of their daily lives [10].
- Run the Experiment: The study was run in Pakistan, using a local panel provider. The study was in English, and thus was limited to respondents who could read and write English. The respondents were member of the panel, accustomed to participating in studies run on the Internet. The respondent received an email invitation. To participate, the respondent was instructed to click on an embedded link. The respondent was led to the research site.
- Orient the Respondents: The experiment began with the orientation page shown at the bottom of Figure 1. Note that the orientation page presented the experiment as a survey, rather than as an experiment, primarily because the word ‘experiment’ may frighten the respondent. The word ‘survey’ is far less frightening. The orientation page does not tell the respondent much about the study at all, other than the study concerns a mango nectar. The remainder of the information about the mango nectar was left to the influence of the 36 elements shown in Table 1.
Table 1. The six questions, each with six answers for the mango nectar product.
|
|
Question A – What is the benefit to the person who drinks the mango nectar? |
|
A1 |
Enjoy a unique taste of mango juice…sweet with minimal sour taste |
|
A2 |
A delicious nectar that will pick you up when you are tired |
|
A3 |
Tingles your taste buds as you swallow… and for a moment you’ll think you’re out of this world! |
|
A4 |
A perfect balance…sweetness of honey and tanginess of an orange |
|
A5 |
Sweet & heavenly blend of mango pulp sensuously melting in your mouth |
|
A6 |
Smooth and thick…leaves a wonderfully lingering aftertaste |
|
|
Question B – What are the sensory perceptions of and emotional responses to the mango nectar? |
|
B1 |
Energizing, delightful aroma…as if you just entered the gardens of heaven |
|
B2 |
A delicious and fruity mango aroma…pleasant enough to remind you of a cool summer breeze…strong enough to have you asking for more |
|
B3 |
Sweet fruity aroma that is simply irresistible |
|
B4 |
An intense tropical aroma as if you’re holding a real mango |
|
B5 |
It smells like a fresh tropical fruit exciting your taste-buds |
|
B6 |
You can never mix-up this distinctive rich, sweet smell with anything else |
|
|
Question C – What does the mango nectar look like? |
|
C1 |
Bright, yellow color of this drink is so mouthwatering |
|
C2 |
Orangish-yellow color is very energizing |
|
C3 |
Light yellow soft & soothing color |
|
C4 |
Deep golden colors of the king of fruits |
|
C5 |
Dark golden color of sun-kissed mangoes |
|
C6 |
Made from ripe mangoes, which makes its color intensely tempting |
|
|
Question D – What are some product ingredients and health-promoting ingredients? |
|
D1 |
Contains natural mango pulp |
|
D2 |
Delicious mango nectar from concentrate, enriched with vitamins A, B, C |
|
D3 |
Mango Nectar: 30% juice, no saturated fat, trans fat or cholesterol |
|
D4 |
All natural, not from concentrate, no artificial sweetness |
|
D5 |
Vitamin C, mango pulp, no sugar added |
|
D6 |
Rich in Nutrients, Vitamin A, Vitamins B (B1, B2 and B3), Vitamin C, Calcium, Iron, Phosphorus and Potassium |
|
|
Question E – What is the price? |
|
E1 |
Rs. 145 Per Liter |
|
E2 |
Rs. 130 Per Liter |
|
E3 |
Rs. 115 Per Liter |
|
E4 |
Rs. 100 Per Liter |
|
E5 |
Rs. 85 Per Liter |
|
E6 |
Rs. 70 Per Liter |
|
|
Question F – What is the brand name? |
|
F1 |
Nestle |
|
F2 |
Olfrute |
|
F3 |
All Pure |
|
F4 |
Nurpur |
|
F5 |
Shezan |
|
F6 |
Benz |
Table 2. The two rating questions
|
1. How interested are you in buying this mango nectar based on this information? |
|
1 = Not at all interested…9 = Very interested |
|
2. Select which ONE drink will this mango nectar replace FOR YOU |
|
1 = Mineral water 2 = Carbonated soft drink 3 = Milk 4 = Lassi 5 = Other flavor of juice |
Table 2. Model and statistics for the relation between interest after binary transformation (dependent variable) and the presence/absence of each of the 36 elements (independent variable.)
|
|
|
Coeff |
t Stat |
p Value |
|
|
Additive constant |
40.29 |
5.11 |
0.00 |
|
E6 |
Rs. 70 Per Liter |
19.31 |
8.33 |
0.00 |
|
F1 |
Nestle |
17.36 |
7.29 |
0.00 |
|
E5 |
Rs. 85 Per Liter |
13.29 |
5.77 |
0.00 |
|
D6 |
Rich in Nutrients, Vitamin A, Vitamins B (B1, B2 and B3), Vitamin C, Calcium, Iron, Phosphorus and Potassium |
5.91 |
2.50 |
0.01 |
|
A2 |
A delicious nectar that will pick you up when you are tired |
5.35 |
2.25 |
0.03 |
|
A1 |
Enjoy a unique taste of mango juice…sweet with minimal sour taste |
4.07 |
1.69 |
0.09 |
|
B5 |
It smells like a fresh tropical fruit exciting your taste-buds |
3.97 |
1.66 |
0.10 |
|
D2 |
Delicious mango nectar from concentrate, enriched with vitamins A, B, C |
3.90 |
1.65 |
0.10 |
|
D4 |
All natural, not from concentrate, no artificial sweetness |
3.76 |
1.60 |
0.11 |
|
E4 |
Rs. 100 Per Liter |
3.68 |
1.57 |
0.12 |
|
C1 |
Bright, yellow color of this drink is so mouthwatering |
3.33 |
1.41 |
0.16 |
|
D1 |
Contains natural mango pulp |
2.84 |
1.21 |
0.23 |
|
C2 |
Orangish-yellow color is very energizing |
2.73 |
1.16 |
0.25 |
|
A6 |
Smooth and thick…leaves a wonderfully lingering aftertaste |
2.46 |
1.04 |
0.30 |
|
C6 |
Made from ripe mangoes, which makes its color intensely tempting |
2.10 |
0.89 |
0.37 |
|
B2 |
A delicious and fruity mango aroma…pleasant enough to remind you of a cool summer breeze…strong enough to have you asking for more |
1.81 |
0.76 |
0.45 |
|
A3 |
Tingles your taste buds as you swallow… and for a moment you’ll think you’re out of this world! |
1.74 |
0.72 |
0.47 |
|
F2 |
Olfrute |
1.49 |
0.62 |
0.54 |
|
A5 |
Sweet & heavenly blend of mango pulp sensuously melting in your mouth |
1.46 |
0.61 |
0.55 |
|
D3 |
Mango Nectar: 30% juice, no saturated fat, trans fat or cholesterol |
1.26 |
0.53 |
0.59 |
|
B3 |
Sweet fruity aroma that is simply irresistible |
1.21 |
0.51 |
0.61 |
|
B4 |
An intense tropical aroma as if you’re holding a real mango |
1.04 |
0.44 |
0.66 |
|
C3 |
Light yellow soft & soothing color |
0.62 |
0.26 |
0.80 |
|
D5 |
Vitamin C, mango pulp, no sugar added |
0.18 |
0.08 |
0.94 |
|
F3 |
All Pure |
0.13 |
0.06 |
0.96 |
|
B1 |
Energizing, delightful aroma…as if you just entered the gardens of heaven |
0.11 |
0.05 |
0.96 |
|
B6 |
You can never mix-up this distinctive rich, sweet smell with anything else |
-0.04 |
-0.02 |
0.99 |
|
A4 |
A perfect balance…sweetness of honey and tanginess of an orange |
-0.05 |
-0.02 |
0.98 |
|
C5 |
Dark golden color of sun-kissed mangoes |
-0.90 |
-0.38 |
0.70 |
|
C4 |
Deep golden colors of the king of fruits |
-2.80 |
-1.20 |
0.23 |
|
F5 |
Shezan |
-6.12 |
-2.56 |
0.01 |
|
E2 |
Rs. 130 Per Liter |
-6.97 |
-2.99 |
0.00 |
|
E3 |
Rs. 115 Per Liter |
-7.35 |
-3.19 |
0.00 |
|
F6 |
Benz |
-7.91 |
-3.33 |
0.00 |
|
F4 |
Nurpur |
-9.49 |
-3.94 |
0.00 |
|
E1 |
Rs. 145 Per Liter |
-12.05 |
-5.20 |
0.00 |
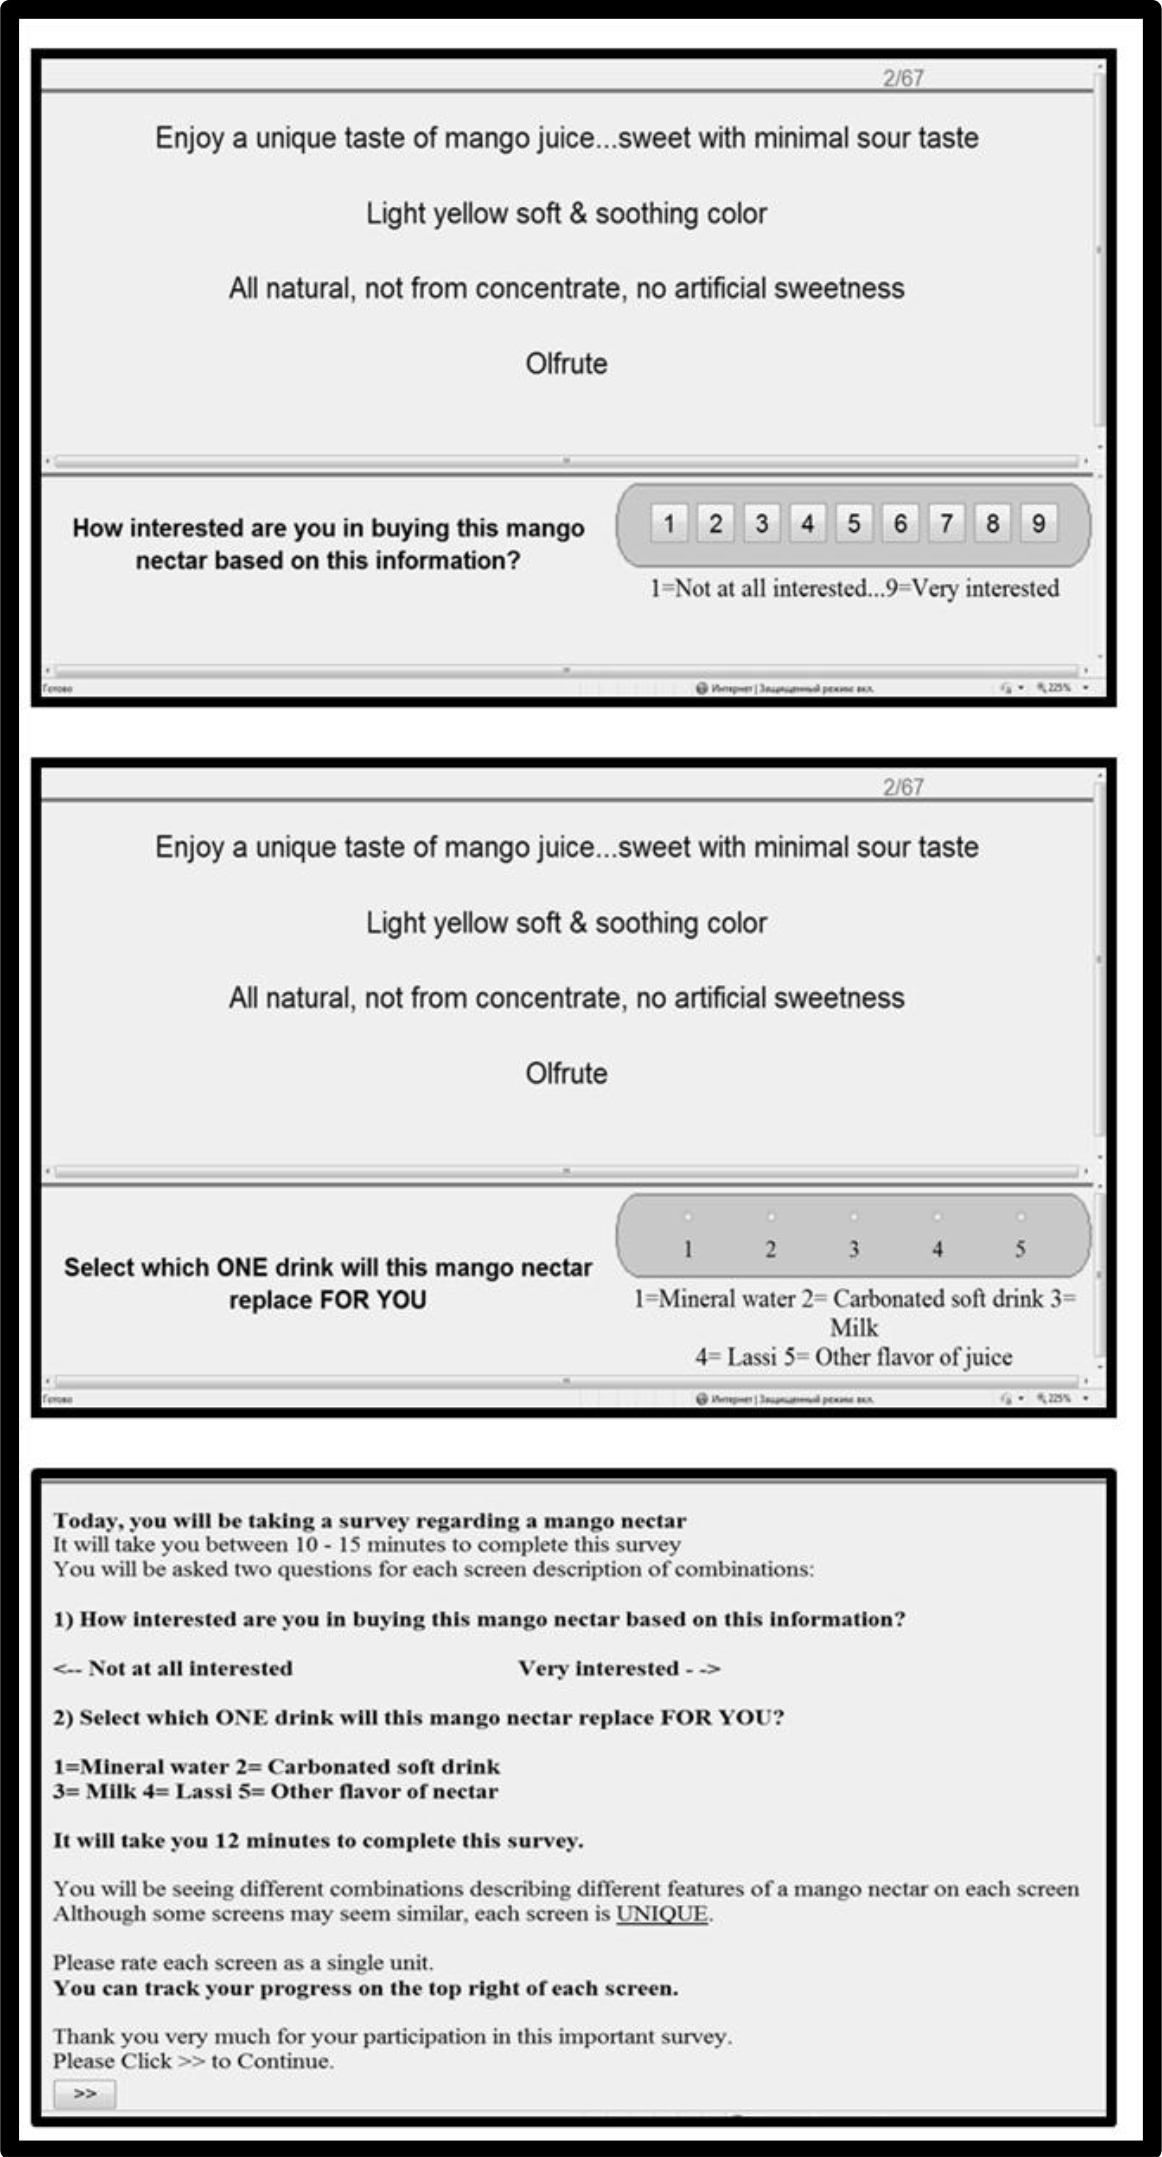
Figure 1. The orientation page.
The role of the orientation page is to tell the respondent about what they will see, and what they are to do. The orientation page also tells the respondent information about how long the survey will last (about 12 minutes), and that the vignettes (called combinations) are all unique, i.e., all different from each other. The reason for this seeming ‘additional information’ is that previous studies often received comments from respondents that they were evaluating the ‘same’ vignettes several times. To the respondent it might seem as though the vignettes are repeated because the elements repeat, but the underlying experimental design driving the combination of elements ensures that every vignette is different.
Analysis
The analysis of Mind Genomics data follows a specified sequence, comprising data transformation, modeling by OLS (ordinary least-squares) regression, creating individual-level and group models relating the independent variables to both the rated and substitution, and finally using cluster analysis to identify similar respondents, ‘similar’ defined by the pattern of responses, and not by WHO the respondents are.
Preparing the Responses for Modeling
The two ratings scales, for interest and for the selection of substitution, require different preparations of the data. We begin with the first rating scale, the nine-point scale for interest, our category or Likert scale. The data are already in a form that can be analyzed by OLS (ordinary least-squares) regression, either at the level of the individual respondent or at the group level, pooling together the data from all the respondents. Previous experience with Mind Genomics studies using rating scales continued to reveal that most users of the data did not understand how to interpret the rating scale. Most asked ‘what does a 4 or a 7 mean?’ A better approach divides the 9-point scale into two regions, the low region corresponding to ‘not interested’ (ratings 1–6), and the high region corresponding to ‘interested’ (ratings 7–9.) The division of the scale between ratings of 6 and 7 has been thus done for 30 years before analyzing the results. A rating of 1–6 is replaced by the value ‘0’ plus a small random number (<10–5), whereas a rating of 7–9 is replaced by the value ‘100’, again plus a small random number. This stratagem ensures that the data can be analyzed by OLS regression, whether at the individual respondent level or at the group level, respectively.
Modeling the interest rating to discover what drives interest (Question 1)
The first model relates the presence/absence of the 36 elements to the binary rating, 0 or 100. Recall from the previous section that the first rating question was a category or Likert scale, whose scale values could be transformed. The transformation loses some of the granular information but allows the researcher to interpret the results. The model emerging from the first rating scale is calculated at the level of the individual respondent, and can be represented by the simple linear equation:
Binary Rating = k0 + k1(A1) + k2(A2) … k36(F6)
The underlying experimental design allows us to estimate the 36 coefficients and the additive constant for each respondent, or to combine all the data from the full set of respondents into a single model, called the grand model. For this study, we focused on the parameters emerging from the grand model.
We begin with the additive constant k0, is the estimate value of the binary rating in the absence of elements. Each of the 48 vignettes comprised either three or four elements from the set of 36, so the additive constant is a purely calculated parameter. Nonetheless, it provides a good estimate of the likely interest in purchasing the mango nectar in the absence of other information. In other words, the additive constant plays the role of a baseline. The additive constant shown in the results (Table 2) comes from the grand model estimated from the pooled set of 48 ratings from each respondent.
To estimate the percent of respondents who would rate a vignette 7–9, we begin with the additive constant, our ‘baseline,’ and add to the values of the coefficients, whether positive or negative. Looking at the column labelled Q1 (question, interest, after binary transformation), we see that the additive constant is 40.29, or 40 for the purposes of discussion. We interpret that to mean that in the absence of any elements, the basic interest in mango nectar is 40, or that 40% the respondents would rate the beverage as 7–9. It is the elements which must do the work.
Each of the elements has associated with it a coefficient, again with the 36 coefficients shown in Table 2, again estimated from the grand model We interpret the coefficient to be the additive conditional probability of a person saying ‘I’m interested in the mango nectar’ when the element appears in the vignette. Thus, an additive constant of +8 means that when the element is insert into the vignette an additional 8% of the respondents are likely to rate the vignette 7–9. Respondents are not asked to estimate the coefficient. Rather, the coefficient emerges from the pattern of the response.
We present the elements in Table 2 in descending order, without the silos or questions from which the elements arose. The OLS regression does not know about the bookkeeping strategy, but rather treats all 36 elements as statistically independent predictors, which in fact they are.
The two highest scoring elements have nothing to do with the product at all. They are the lowest price (Rs 70 per liter, with a coefficient of 19.31 or 19, and brand Nestle (coefficient = 17). In fact, the two lowest prices, 70, and 95 Rs per liter are among the four highest scoring elements. Furthermore, the remaining elements score low, or even negative, with the lowest scoring elements being higher prices and other brands.
When we look at the results of the regression, we not only want to see the magnitude of the coefficient, but for scientific ‘due diligence,’ we want to ensure that the results we see do not represent an aberration that might readily occur when we deal with small numbers of cases. We compute the t statistic, which can be likened to a measure of signal to noise. High t statistics, and low p values (probabilities of observing this t statistic by chance when the coefficient is really 0) suggest that we are observing a real phenomenon with a coefficient whose value is certainly greater than 0.
Does everyone think about mango nectar in the same way?
One of the premises of the emerging science of Mind Genomics is that for every topic area, there exists a group of different ways of looking at the topic. Thus, for our specific study on mango nectar, we may discover that there are different minds of people, minds which focus on completely or partly different aspects of the same product as the product is communicated through the vignette. These mind-sets are not really different types of people as much as they are different ways of looking at a topic. Each person is likely to fall into one of these mind-sets.
The mind-sets can be discovered by running the study as we have done, with a reasonable number of people. We are interested in ideas which ‘move together,’ with the people in the study comprising the ‘protoplasm which contains the brain which does the thinking.’ The latter is another way of saying that we are not so much interested in people as in sets of ideas, which people hold.
To uncover mind-sets we do cluster analysis on the ratings, after the ratings have been transformed to the binary scale, so that ratings of 1–6 transform to 0, and ratings of 7–9 transform to 100. The cluster analysis, so-called k-means clustering, considers the pattern of 36 coefficients from each of the respondents. The analysis computes the following ‘distance’ between each pair of respondents, based upon their 36 coefficients: Distance = (1-Pearson R). The Pearson R, the correlation coefficient, shows how linearly related are two sets of numbers, which we translate to how similar is the pattern of coefficients from every pair of respondents. The distance starts from a low of 0 when the Pearson R or correlation is 1.0, which means that the two patterns are perfectly related. The distance starts from a high of 2 when the Pearson R is -1, which means that the two patterns are perfect inversely related.
Clustering programs are sets of mathematical routines which divide the people based upon the pattern of their coefficients (without the additive constant.) The clustering method does not ‘understand’ the meaning of the clusters, nor even whether the clustering seems natural or whether the cluster comprises elements seemingly thrown together randomly.
Clustering properly done requires the intervention of a human being for interpretation. The ideal for a cluster solution is that there should be as few clusters as possible. One cluster, of course, is best. The second criterion is that the cluster makes intuitive sense. Such intuitive sense is gauged by the degree to which the clusters tell a story. That is, when we look at the strongest performing elements in a cluster, do these elements seem to tell a story which ‘hangs together,’ or does the clustering produce clusters seemingly irrational and in correct.
For our mango nectar data, forcing the respondents into the two-cluster solution did not make intuitive sense. There were too many disparate, almost conflicting elements in the cluster, as if the solution, being fixed at two segments tried to do the best possible. The solution is, in fact, the ‘best’ in a mathematical sense, but it makes no intuitive sense. The three-cluster solution, shown in Table 3, makes intuitive sense.
Table 3. Strong performing elements for the three mind-set clusters.
|
|
|
Mind-Set |
||
|
|
|
3A |
3B |
3C |
|
|
Additive constant |
32 |
35 |
52 |
|
|
Elements which appeal to all mind-sets |
, |
|
|
|
F1 |
Nestle |
20 |
14 |
17 |
|
E6 |
Rs. 70 Per Liter |
15 |
34 |
11 |
|
E5 |
Rs. 85 Per Liter |
11 |
25 |
6 |
|
|
Mind-Set 3A – Likes the product in many ways |
|
|
|
|
A3 |
Tingles your taste buds as you swallow… and for a moment you’ll think you’re out of this world! |
10 |
-3 |
-2 |
|
D4 |
All natural, not from concentrate, no artificial sweetness |
10 |
-1 |
1 |
|
B3 |
Sweet fruity aroma that is simply irresistible |
10 |
-1 |
-4 |
|
A2 |
A delicious nectar that will pick you up when you are tired |
10 |
-1 |
6 |
|
B5 |
It smells like a fresh tropical fruit exciting your taste-buds |
10 |
5 |
-2 |
|
B2 |
A delicious and fruity mango aroma…pleasant enough to remind you of a cool summer breeze…strong enough to have you asking for more |
9 |
-3 |
-1 |
|
A1 |
Enjoy a unique taste of mango juice…sweet with minimal sour taste |
9 |
-1 |
6 |
|
B4 |
An intense tropical aroma as if you’re holding a real mango |
9 |
-4 |
-2 |
|
C1 |
Bright, yellow color of this drink is so mouthwatering |
8 |
-1 |
3 |
|
D2 |
Delicious mango nectar from concentrate, enriched with vitamins A, B, C |
8 |
1 |
3 |
|
D6 |
Rich in Nutrients, Vitamin A, Vitamins B (B1, B2 and B3), Vitamin C, Calcium, Iron, Phosphorus and Potassium |
8 |
10 |
1 |
|
B1 |
Energizing, delightful aroma…as if you just entered the gardens of heaven |
8 |
-3 |
-2 |
|
A5 |
Sweet & heavenly blend of mango pulp sensuously melting in your mouth |
8 |
-4 |
1 |
|
|
Mind-Set 3B – Strong emphasis on nutrition, and likes natural pulp |
|
|
|
|
D6 |
Rich in Nutrients, Vitamin A, Vitamins B (B1, B2 and B3), Vitamin C, Calcium, Iron, Phosphorus and Potassium |
8 |
10 |
1 |
|
D1 |
Contains natural mango pulp |
7 |
8 |
-6 |
|
|
Mind-Set 3C – Nothing |
|
|
|
Based upon the highest scoring elements in Table 3, we can label the mind-sets as follows:
All three mind-sets like the lowest price of Rs 70 per liter, and like the brand name Nestle. These two elements are not relevant for mind-set segmentation. We can also include the second lowest price, Rs 85 per liter. We begin the analysis of the mind-sets after excluding those three strong performing elements.
Mind-Set 3A and Mind-Set 3B begin with a low additive constant, in the low to mid 30’s. The low additive constant suggests that the acceptance must be driven by the description of the product. As we shall see, only Mind-Set 3A is our potential target.
Mind-Set 3A – Likes the product in many ways. This mind-set strongly responds to the different sensory aspects of mango nectar. Although Mind-Set 3A starts off with a low additive constant of 32, many elements appeal to them, with the potential of converting them to a customer interested in mango nectar.
Mind-Set 3B – Only likes strong nutrition and the mention of natural mango pulp. This group may be folded into Mind-Set 3A, although they are indifferent to the sensory properties
Mind-Set 3C – Although they like the product, they really don’t care very much
The mind-set segmentation suggests that we might fold together Mind-Sets 3A and 3B into one mind-set. The mind-sets might be labelled
3A – Interested in the sensory and health properties of the mango nectar,
3BC – Not the target.
Finding these mind sets in the population
Our first question is of a strategic nature. Which mind sets should be the target for any future efforts? Certainly, we want to find individuals in Mind-Set 3A. They strongly respond to the product features and descriptions. We don’t really care about individuals in Mind-Set 3C, because they are only interested in a low price. Finally, we probably don’t care about individuals in Mind-Set 3B, because the only thing which appeals to them is mango pulp. Interesting, author Moskowitz was involved with just such a mind-set segment in the 1990’s, but one responding to the pulp of oranges in orange juice [11]. That product effort eventuated in Tropicana brand Grovestand Orange Juice®.
An alternative way develops a PVI, a personal viewpoint identifier (Gere, reference.) The PVI identifies the elements which most simply differentiate among the mind sets, in our case Mind-Set 3A and the combination of Mind-Sets 3B and 3C, respectively. We end up with two mind sets, and the PVI shown in Figure 2.
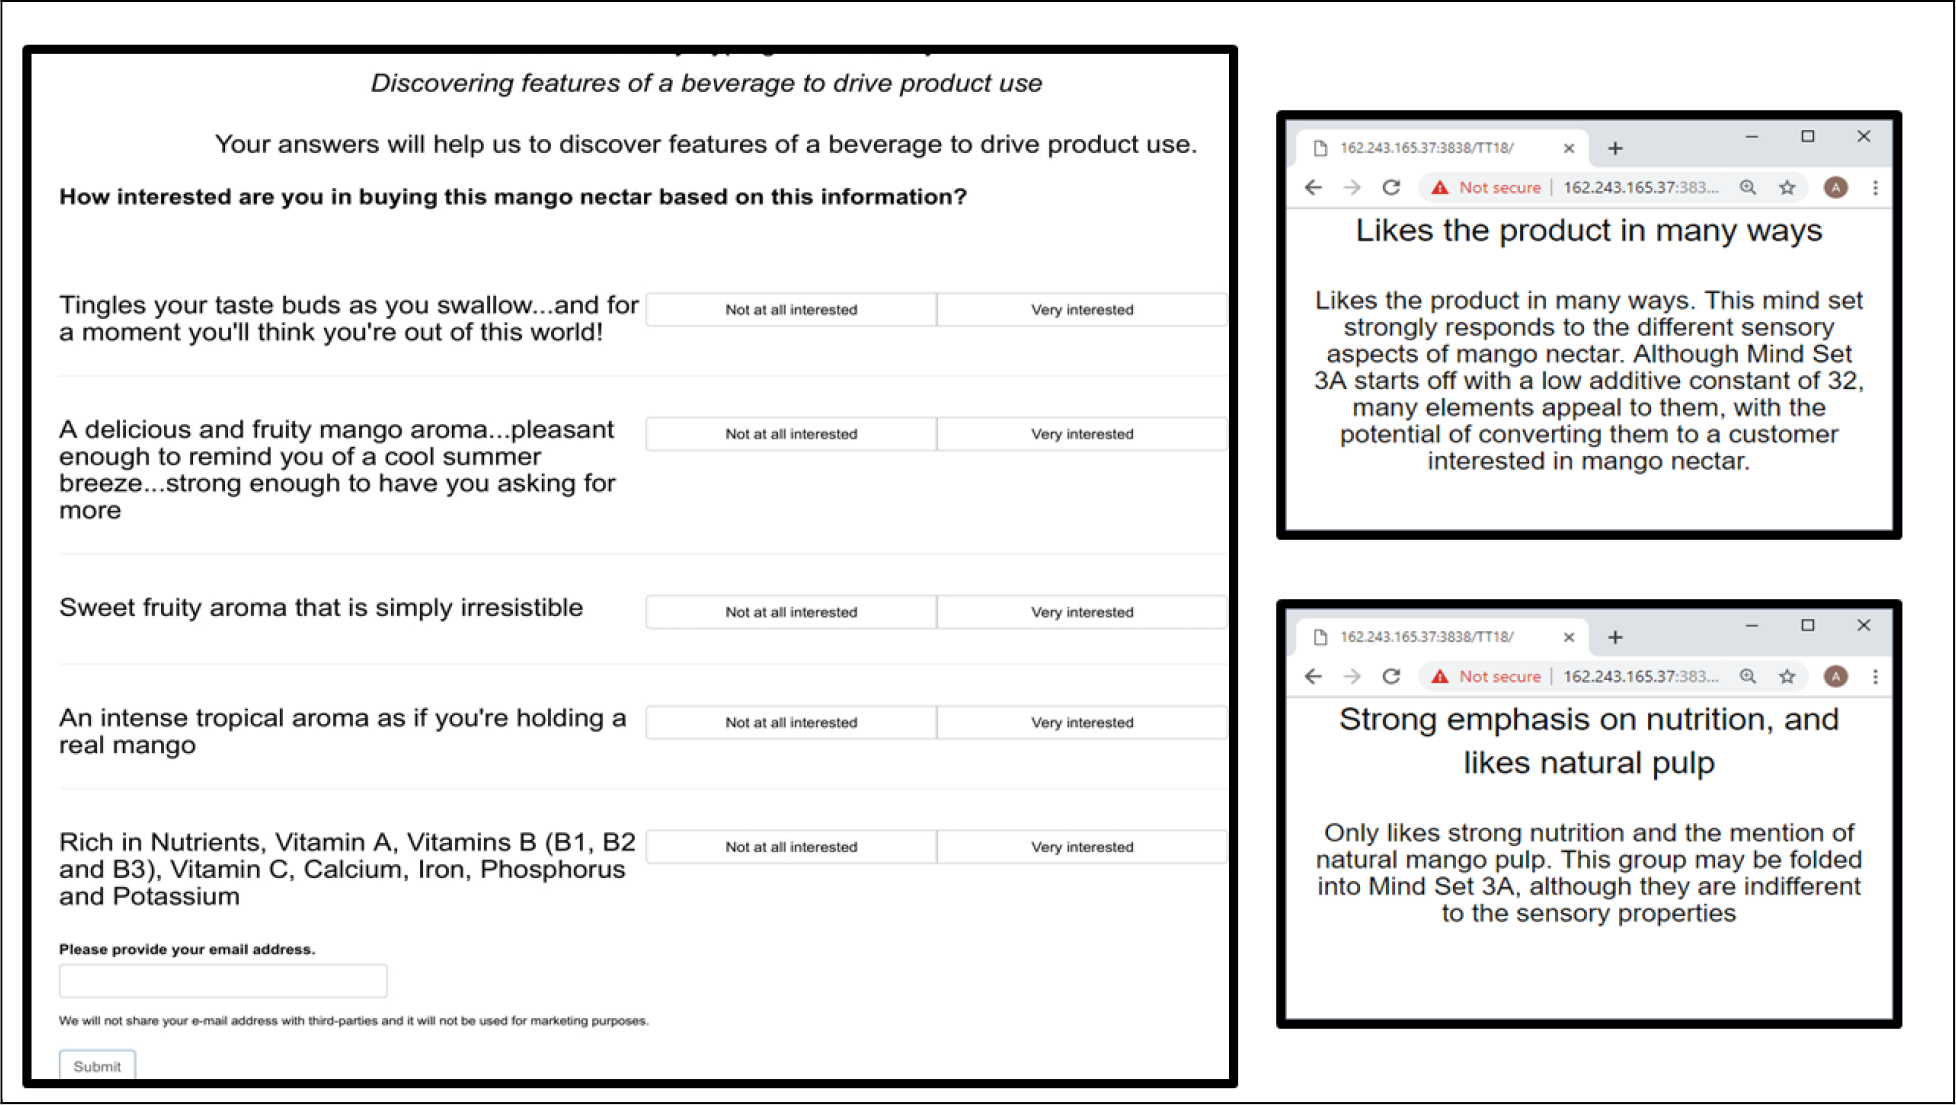
Figure 2. The PVI, personal viewpoint identifier and three feedback screens, one for each mind set to which a person might be assigned.
Modeling the linkage between the elements and the substitutions
The second rating question is not really what we would call a scale with numerical values, but a so-called nominal scale. The five numbers have nothing to do with intensity or order of magnitude but are simply placeholders. When answering the second answer, the respondent simply chose which of the five beverages would be replaced by the mango nectar described in the vignette. Marketers often use this question to see where the new product may possible ‘source its usage.’ That is, marketers often below that the new product will grow in part by ‘stealing away’ the users of other products. Mind Genomics provides the marketer with an opportunity determine the pattern of such ‘stealing’ (or product switching, in more nuanced marketing parlance.)
If we simply look at the frequency of times that a respondent feels that the vignette will replace one of five drinks, we get a sense from Table 4 that the new mango nectar is thought to substitute for both carbonated soft drinks and for other juices (besides mango.) On the other hand, we do not know the linkage between the specific elements of mango nectar that can be used to ‘attack’ the so-called franchise of a target, such as the users of carbonated soft drinks, versus the uses of lassi. We will use regression analysis to uncover that linkage.
Table 4. Frequency table showing the frequency of times the mango nectar will substitute for each of five beverages.
|
Substitute |
Frequency of selection across all respondents and vignettes |
Percent |
|
Carbonated soft drink |
2243 |
32% |
|
Juice – other than mango |
2667 |
38% |
|
Mineral water |
731 |
11% |
|
Lassi |
679 |
10% |
|
Milk |
640 |
9% |
|
Total |
6960 |
100% |
Linking the elements to the substitutions
In order to link the elements to the selection of a substitution, we must prepare the data to be analyzed by OLS regression, just as we did for the first rating question, interest. That, is, the five scale points by themselves do not mean anything for the substitution. Each scale point is simply a placeholder.
To prepare the data, we create five new dependent variables, one dependent variable for each substitution. That is, fruit juice becomes a variable; carbonated SD becomes a variable, and so forth. With five substitutions we create five new independent variables.
At the outset, each of the five newly-created dependent variables is assigned the value of 0 and a small random number, around 10–5. This is the same strategy that we did before. Then, for each vignette, we identify the substitution that is selected, and for the corresponding dependent variable we recode the 0 as 100, and the remaining four, unselected substitutions remain with the recoded ‘0.’
Our data are now ready for analysis by OLS regression. We run five regression analyses, one for each dependent variable. We do not estimate the additive constant, the rationale being that in the absence of elements one does not know the beverage to be replaced by the mango nectar.
The results of the five regressions appear in Table 5. The order of the five beverages to be replaced by mango nectar has changed, with the most popular beverage in line for replacement, fruit juice, first, and the least popular beverage in line for replacement, mineral water, last. We divide the table into two main sections. The first section shows those elements strongly linked with a replacement of fruit juice. The second section shows elements strongly linked with a replacement of carbonated SD. There is one element at the bottom linking with the replacement of milk.
Mind-sets based on the product for which mango nectar would substitute
Each respondent was given 48 opportunities to select a beverage that would be substituted by mango nectar. We can compute the percent of times a each of the five beverages would be substituted. That pattern suggests that mango nectar would substitute most frequently for fruit juice, and for carbonated SD (carbonated soft drink).
Individuals differ, however, and it may well be that the design of the mango nectar product, and its price (as well as brand) might be a function of that beverage that the individual respondent would most likely choose as the one being substituted. To identify these mind-sets, i.e., people choosing different patterns of substitution, we created a single vector of five numbers for each respondent, showing the number of times out of 48, that that respondent would substitute mango nectar for fruit juice, carbonated so, milk, lassi and mineral water, respectively. We then clustered our 145 respondents into three groups, showing clearly different substitution patterns.
Our results from the clustering appear in Table 6 for the three mind—sets, defined by the key beverage to be replaced by mango nectar. The only elements which appear in each table are those which show a linkage with the substituted beverage of +15 or higher (strong likelihood of replacing the beverage), and an interest value of +5 or higher (drives interest in mango nectar.)
Table 6 shows clearly the differences by mind-set among the candidate descriptive elements of mango nectar. Thus, for purposes of marketing, the opportunity is not only defined by the product, but also by the nature of the product for which mango nectar will substitute. This approach of looking at the product features, defined by the respondent mind-set, comprises the key scientific and business advantage of Mind Genomics to understand both the product and the person, at a deeper level. For example, we see that when we deal with those who feel that they would replace lassi, we deal with people who focus much more on the product features, whereas when we deal with those who would replace fruit juice or carbonated soft drinks, we have people who do not focus very much on the product features.
Table 5. Linkage between each attribute and the beverage that is likely to replace. Look for strong linkages of 10 or more, and slightly weaker linkages of 8–10. Linkages below 8 are irrelevant, at least based upon the results from the total panel
|
|
|
Fruit Juice |
Carb SD |
Lassi |
Milk |
Min Wat |
|
|
Elements driving replacement of fruit juice |
|
|
|
|
|
|
F1 |
Nestle |
17 |
4 |
1 |
2 |
2 |
|
B5 |
It smells like a fresh tropical fruit exciting your taste-buds |
13 |
8 |
2 |
2 |
3 |
|
E1 |
Rs. 145 Per Liter |
13 |
7 |
2 |
2 |
2 |
|
F5 |
Shezan |
13 |
7 |
2 |
3 |
3 |
|
A1 |
Enjoy a unique taste of mango juice…sweet with minimal sour taste |
12 |
7 |
4 |
2 |
4 |
|
A5 |
Sweet & heavenly blend of mango pulp sensuously melting in your mouth |
12 |
5 |
5 |
2 |
4 |
|
B3 |
Sweet fruity aroma that is simply irresistible |
12 |
7 |
3 |
3 |
2 |
|
B6 |
You can never mix-up this distinctive rich, sweet smell with anything else |
12 |
7 |
2 |
2 |
4 |
|
C6 |
Made from ripe mangoes, which makes its color intensely tempting |
12 |
6 |
4 |
1 |
3 |
|
F2 |
Olfrute |
12 |
8 |
2 |
4 |
2 |
|
F3 |
All Pure |
12 |
9 |
2 |
2 |
3 |
|
A3 |
Tingles your taste buds as you swallow… and for a moment you’ll think you’re out of this world! |
11 |
8 |
4 |
3 |
3 |
|
A4 |
A perfect balance…sweetness of honey and tanginess of an orange |
11 |
8 |
3 |
2 |
4 |
|
E2 |
Rs. 130 Per Liter |
11 |
11 |
1 |
2 |
0 |
|
F6 |
Benz |
11 |
8 |
3 |
2 |
3 |
|
A6 |
Smooth and thick…leaves a wonderfully lingering aftertaste |
10 |
8 |
1 |
4 |
3 |
|
D4 |
All natural, not from concentrate, no artificial sweetness |
10 |
9 |
4 |
1 |
2 |
|
E3 |
Rs. 115 Per Liter |
10 |
9 |
2 |
0 |
2 |
|
E4 |
Rs. 100 Per Liter |
10 |
10 |
1 |
3 |
1 |
|
|
Elements driving replacement of carbonated SD |
|
|
|
|
|
|
E6 |
Rs. 70 Per Liter |
8 |
13 |
2 |
0 |
2 |
|
D1 |
Contains natural mango pulp |
9 |
11 |
3 |
0 |
2 |
|
F4 |
Nurpur |
6 |
11 |
4 |
3 |
3 |
|
C3 |
Light yellow soft & soothing color |
9 |
10 |
3 |
2 |
3 |
|
C4 |
Deep golden colors of the king of fruits |
9 |
10 |
2 |
1 |
4 |
|
E5 |
Rs. 85 Per Liter |
9 |
10 |
1 |
2 |
2 |
|
C2 |
Orangish-yellow color is very energizing |
8 |
10 |
3 |
3 |
2 |
|
D3 |
Mango Nectar: 30% juice, no saturated fat, trans fat or cholesterol |
8 |
10 |
3 |
1 |
3 |
|
D5 |
Vitamin C, mango pulp, no sugar added |
6 |
10 |
5 |
3 |
3 |
|
A2 |
A delicious nectar that will pick you up when you are tired |
9 |
9 |
3 |
2 |
4 |
|
B2 |
A delicious and fruity mango aroma…pleasant enough to remind you of a cool summer breeze…strong enough to have you asking for more |
9 |
9 |
2 |
3 |
4 |
|
D2 |
Delicious mango nectar from concentrate, enriched with vitamins A, B, C |
7 |
9 |
2 |
5 |
2 |
|
B1 |
Energizing, delightful aroma…as if you just entered the gardens of heaven |
9 |
8 |
3 |
3 |
3 |
|
B4 |
An intense tropical aroma as if you’re holding a real mango |
9 |
8 |
4 |
2 |
3 |
|
C1 |
Bright, yellow color of this drink is so mouthwatering |
8 |
8 |
3 |
4 |
4 |
|
C5 |
Dark golden color of sun-kissed mangoes |
8 |
8 |
4 |
3 |
3 |
|
|
Elements driving replacement of milk |
|
|
|
|
|
|
D6 |
Rich in Nutrients, Vitamin A, Vitamins B (B1, B2 and B3), Vitamin C, Calcium, Iron, Phosphorus and Potassium |
8 |
5 |
1 |
8 |
3 |
Table 6. Candidate elements which drive replacement of a target beverage, and the interest in the elements. The table divides into three parts, based upon the three mind-set segments, defined by the pattern of the beverages they feel mango nectar would replace.
|
|
Mind-Set 1- Replaces fruit juice (n=73) |
Int |
Fruit Juice |
Carb SD |
Milk |
Lassi |
Min Wat |
|
|
Additive constant for interest |
49 |
NA |
NA |
NA |
NA |
NA |
|
E6 |
Rs. 70 Per Liter |
22 |
12 |
11 |
0 |
1 |
0 |
|
F1 |
Nestle |
20 |
26 |
1 |
1 |
1 |
-1 |
|
E5 |
Rs. 85 Per Liter |
14 |
15 |
6 |
2 |
1 |
0 |
|
E4 |
Rs. 100 Per Liter |
8 |
16 |
7 |
2 |
1 |
-1 |
|
A2 |
A delicious nectar that will pick you up when you are tired |
4 |
17 |
6 |
0 |
2 |
4 |
|
F2 |
Olfrute |
3 |
21 |
4 |
1 |
2 |
0 |
|
C1 |
Bright, yellow color of this drink is so mouthwatering |
3 |
13 |
5 |
4 |
2 |
3 |
|
B5 |
It smells like a fresh tropical fruit exciting your taste-buds |
2 |
20 |
3 |
3 |
0 |
1 |
|
A1 |
Enjoy a unique taste of mango juice…sweet with minimal sour taste |
2 |
19 |
5 |
1 |
2 |
2 |
|
|
Mind-Set 2: Replaces Carbonated SD (N = 57) |
|
Carb SD |
Min Wat |
Fruit Juice |
Milk |
Lassi |
|
|
Additive constant for interest |
30 |
|
|
|
|
|
|
E6 |
Rs. 70 Per Liter |
21 |
18 |
5 |
5 |
-3 |
-1 |
|
E5 |
Rs. 85 Per Liter |
16 |
17 |
5 |
3 |
-1 |
0 |
|
D4 |
All natural, not from concentrate, no artificial sweetness |
7 |
18 |
5 |
2 |
0 |
2 |
|
D1 |
Contains natural mango pulp |
7 |
17 |
4 |
1 |
0 |
2 |
|
A6 |
Smooth and thick…leaves a wonderfully lingering aftertaste |
5 |
16 |
5 |
3 |
3 |
-1 |
|
|
Mind-Set: 3 Replaces Lassi (N15) |
|
Lassi |
Milk |
Carb SD |
Fruit Juice |
Min Wat |
|
|
Additive constant for interest |
40 |
|
|
|
|
|
|
D2 |
Delicious mango nectar from concentrate, enriched with vitamins A, B, C |
16 |
18 |
5 |
1 |
1 |
3 |
|
D6 |
Rich in Nutrients, Vitamin A, Vitamins B (B1, B2 and B3), Vitamin C, Calcium, Iron, Phosphorus and Potassium |
14 |
17 |
8 |
4 |
1 |
-1 |
|
D1 |
Contains natural mango pulp |
11 |
21 |
-2 |
3 |
4 |
4 |
|
D5 |
Vitamin C, mango pulp, no sugar added |
10 |
27 |
-1 |
4 |
-4 |
1 |
|
D4 |
All natural, not from concentrate, no artificial sweetness |
6 |
21 |
4 |
-2 |
5 |
-1 |
|
A2 |
A delicious nectar that will pick you up when you are tired |
6 |
16 |
11 |
3 |
-4 |
1 |
|
C2 |
Orangish-yellow color is very energizing |
5 |
18 |
4 |
-5 |
2 |
4 |
Replace fruit juice:
A delicious nectar that will pick you up when you are tired (note – not really a product feature)
Bright, yellow color of this drink is so mouthwatering
Replace carbonated soft drink:
All natural, not from concentrate, no artificial sweetness
Contains natural mango pulp
Smooth and thick…leaves a wonderfully lingering aftertaste
Replace lassi:
Delicious mango nectar from concentrate, enriched with vitamins A, B, C
Rich in Nutrients, Vitamin A, Vitamins B (B1, B2 and B3), Vitamin C, Calcium, Iron, Phosphorus and Potassium
Contains natural mango pulp
Vitamin C, mango pulp, no sugar added
All natural, not from concentrate, no artificial sweetness
A delicious nectar that will pick you up when you are tired (note – not really a product feature)
Orangish-yellow color is very energizing
Discussion and conclusions
Understanding what to say about a beverage is important both in science and in commerce. The scientific understanding about communication gives the researcher a sense of how people in a given country respond to different ‘ideas’ about a beverage. There may be dramatically different groups of people, some responding to the sensory properties of the product, another group responding to the messages about nutrition, and a third group responding to brand and/or price. This finding suggests that the consumer is responsive to the different product features. Our study of mind-sets involving mango nectar suggest that the difference is much simpler. All mind-sets like low price and brand Nestle. Only one mind-set of the three responds to messages about the product, however. The reason for differences among products in terms of the nature of the messages to which one responds represents an entirely new area of investigation of the human mind, and human cultural differences.
From the point of view of business, knowing what to feature in a product guides the product developer in terms of what to create as a beverage (e.g., a product with pulp), as well as what to communicate in advertising. Furthermore, the sensitivity of respondents to price, or in our case the apparent lack of dramatic sensitivity, gives the marketer guidance about how the respondent is expected to respond to price information about the product.
Acknowledgment
Attila Gere thanks the support of the Premium Postdoctoral Researcher Program of the Hungarian Academy of Sciences
References
- Muralidhar, G, Radhika, P. & Bhave, M.H.V., 2012. Efficiency of Marketing Channels for Mango in Mahabubnagar District of Andhra Pradesh. IUP Journal of Management Research, 11(2).
- Shukla, R., Chaudhari, B., Joshi, G., Leua, A.K. & Thakkar, R.G., 2014. An analysis of marketing mix of various mango pulp brands in South Gujarat. Asian J. Dairy & Food Res, 33, 209–214.
- Avena, R.J. & Luh, B.S., 1983. Sweetened mango purees preserved by canning and freezing. Journal of food Science, 48,406–410.
- Kalra, S.K. and Tandon, D.K., 1995. Mango. In Handbook of Fruit Science and Technology, 139–186). CRC Press.
- Maneenpun, S. & Yunchalad, M., 2002, Developing processed mango products for international markets. In VII International Mango Symposium, 93–105.
- Moskowitz, H.R., Gofman, A., Beckley, J. & Ashman, H., 2006. Founding a new science: Mind genomics. Journal of sensory studies, 21, 266–307.
- Moskowitz, H.R. & Gofman, A., 2007. Selling blue elephants: How to make great products that people want before they even know they want them. Pearson Education.
- Green, P.E., Krieger, A.M. & Wind, Y., 2001. Thirty years of conjoint analysis: Reflections and prospects. Interfaces, 31(3_supplement), S56-S73.
- Gofman, A. and Moskowitz, H., 2010. Isomorphic permuted experimental designs and their application in conjoint analysis. Journal of Sensory Studies, 25, 127–145.
- Kahneman, D. & Egan, P., 2011. Thinking, fast and slow. New York: Farrar, Straus and Giroux.
- Moskowitz, H. & Kieger, B., 1998. International product optimization: a case history. Food Quality and Preference, 9, 443–454.
- Cadena, R.S. & Bolini, H.M.A., 2012. Ideal and relative sweetness of high intensity sweeteners in mango nectar. International Journal of Food Science & Technology, 47, 991–996.