Abstract
Nano-metal oxides (NMOs) offer significant improvement in the treatment of hazardous, toxic and non-biodegradable contaminants to enhance their biodegradability. Some of these metal oxides was separated with recovery process. Metal oxide nanoparticles are among the most used engineered nanoparticles (NPs) in various treatment plants in recent years since nanoparticles offer significant improvement with their extremely high specific surface area and associated sorption sites, short intraparticle diffusion distance, and tunable pore size and surface chemistry. Although some acute toxicities was detected in the performed ecotoxicological for NMOs studied below the NMOs should be used to treat the recalcitrant, non-biodegradable pollutants since their cost are lower. The acute toxicity tests should be monitored regularly to prevent the ecosystem since the cost spent for toxicity analysis is very low and their harmful effects remain largely unknown. The first aim of this study is to determine the cost of the removals of some pollutants in the petrochemical wastewater by using advanced treatment processes containing some nano composites. The treatment efficiencies of the processes namely membrane diatilation (MD), reverse osmosis (RO), membrane filtration (MF), ultrafiltration (UF), nanofiltration (NF) were calculated and compared. On the other hand, the toxicity of NMOs of ZnO, Co3O4, ZrO2, Bi2O3 and ATO (Antimony oxide) to Vibrio fischeri, crustaceans (Daphnia magna) and fish (Poecillia reticula – lepistes) were investigated. In the ecotoxicological tests; the EC50 values was calculated from the inhibitions of NMOs used at increasing concentrations (0.1 – 14 mg/l) for 24 and 48 hours. The bioaccumulation the NMOs given above were performed. It was found that the most sensitive organism was Vibrio fischeri – bacteria while the most resistant organism was fish – Poecillia reticula – lepistes. The most toxic NMO were Co3O4 with low EC5O values (1.5 mg/L, while the less toxic NMO was ATO with high EC30 values (12.5 mg/l). Furthermore, the cost of the toxicity test analysis were compared. Although some acute toxicities was detected in the performed ecotoxicological tests advanced treatment plants containing the NMOs below the toxicity values did not cause acute toxicity
Keywords
Acute Toxicity, Bioaccumulation, Cost, Daphnia Magna, Nanometal Oxides, Vibrio Fischeri, Wastewater Treatment
1. Introduction
Among the various emerging technologies, the advancement in nanotechnology has proved an incredible potential for the remediation of wastewater and various other environmental problems [1]. NMOs have extremely high specific surface area and associated sorption sites, and surface chemistry. They can be recovered and they can be reused, and relatively have low energy demand. Therefore, they are used in the pretreatment or treatment of refractory substances via photocatalysts. The low cost increased the extensively usage of NMOs. This means that an increasing number of NMOs will be released to the aquatic environment through production processes. Although some authors have published in the literature on the fate, and toxicological information of NMOs and proposed research strategies for evaluation of safety of NMOs, their release into the aquatic environment is continuous and their harmful effects on organisms is expected. Ecotoxicology is the studies to determine the effects of toxic chemicals on biological organisms. In both developing and industrialized countries, a growing number of contaminants like micropollutants, pharmaceuticals, PCB, and PAHs are entering to the water bodies. The biological wastewater treatment is widely applied but these are usually slow, limited due to the presence of non-biodegradable contaminant, and sometimes causes toxicity to microorganisms due to some toxic contaminants [2]. With conventional treatment processes (sequential anaerobic and aerobic treatments and SBR) are not enough to treat the chemicals aforementioned and reach to the discharge standard by regulations and by the authorities. Therefore, there is a real requirement for more efficient, cheaper and powerful technologies for treatment of industrial wastewaters [3]. Nanotechnology-enabled water and wastewater treatment promises to not only overcome major challenges faced by existing treatment technologies, but also to provide new treatment capabilities that could allow economic utilization of unconventional water sources to expand the water supply. Efficiency of conventional adsorbents is usually limited by the surface area or active sites, the lack of selectivity, and the adsorption kinetics. Nano-adsorbents offer significant improvement with their extremely high specific surface area and associated sorption sites, short intraparticle diffusion distance, and tunable pore size and surface chemistry. It is a useful pretreatment for hazardous and non-biodegradable contaminants to enhance their biodegradability. Photocatalysis can also be used as a polishing step to treat recalcitrant organic compounds. Although there are already some studies on potential hazard of manufactured NPs, their release into the aquatic environment and their harmful effects remain largely unknown.
In this study it was aimed to determine the removal efficiencies and the cost of the some advanced treatment plants (membrane diatilation (MD), reverse osmosis (RO), membrane filtration (MF), ultrafiltration (UF),nanofiltration (NF)) for treating the pollutants from a petrochemical industry wastewater by the utilization of some nano-metal oxides. Therefore, the ecotoxicity of NMOs (nano-ZnO, nano-Co2O3, nano-Bi2O3, nano- ZrO2 and nano-ATO) to bioluminescence bacteria – Vibrio fischeri, anaerobic methane Archaea bacteria and water flea – Daphnia magna were studied. Among the inhibitions plots the EC50 values (NMOs concentration inhibiting 50 % of the organisms) of NMOs were calculated. Their bioaccumulation tests were determined in an aquatic environment during 28 days based on the soluble COD concentrations.
1.1 Theoretical Background
The properties of advanced processes used in this study were summarized below:
Membrane distillation (MD) is a thermally driven separational program in which separation is enabled due to phase change. A hydrophobic membrane displays a barrier for the liquid phase, allowing the vapour phase (e.g. water vapour) to pass through the membrane’s pores. Capillary polypropylene membranes (Accurel PP S6/2, Membrane GmbH, Germany), with the outside/inside diameter dout/din = 2.6 mm/1.8 mm containing 0, 2 mg/l nano ZnO. The capillary membranes have the pore size with the maximum and nominal diameter of 0.55 and 0.22 μm, respectively, and the porosity of 72%. The membranes were arranged as a parallel bundle of braided capillaries (three membranes in the braid). The total active surface area of membranes (A) for the mass transfer was calculated for the internal capillary diameter and amounted to 0.0889 m2. The values of the permeate flux were calculated from the equation J = 3,5 L/m2 .h :A hollow fiber PVC with UF membrane module with a nominal pore size of 0.01 μm and a total membrane area of 0.4 m2 was employed in the sMBR. Reverse osmosis (RO) is a water purification technology that uses a partially permeable membrane to remove ions, molecules and larger particles from drinking water. In reverse osmosis, an applied pressure is used to overcome osmotic pressure, a colligative property, that is driven by chemical potential differences of the solvent, a thermodynamic parameter. Reverse osmosis can remove many types of dissolved and suspended chemical species as well as biological ones (principally bacteria) from water, and is used in both industrial processes and the production of potable water. The result is that the solute is retained on the pressurized side of the membrane and the pure solvent is allowed to pass to the other side. To be “selective”, this membrane should not allow large molecules or ions through the pores (holes), but should allow smaller components of the solution (such as solvent molecules, i.e., water, H2O) to pass freely. Nanofiltration (NF) is a relatively recent membrane filtration process used most often with low total dissolved solids water such as surface water and fresh groundwater, with the purpose of softening (polyvalent cation removal) and removal of disinfection by-product precursors such as natural organic matter and synthetic organic matter. Forward osmosis (FO) is an osmotic process that, like reverse osmosis (RO), uses a semi-permeable membrane to effect separation of water from dissolved solutes. The driving force for this separation is an osmotic pressure gradient, such that a “draw” solution of high concentration (relative to that of the feed solution), is used to induce a net flow of water through the membrane into the draw solution, thus effectively separating the feed water from its solutes. In contrast, the reverse osmosis process uses hydraulic pressure as the driving force for separation, which serves to counteract the osmotic pressure gradient that would otherwise favor water flux from the permeate to the feed. Hence significantly more energy is required for reverse osmosis compared to forward osmosis.
1.2 Cost Analysis for the Novel Treatment Processes
In every treatment process the total treatment cost was defined based on the total expenses spent to treat 1 m3 wastewater. The total cost is the sum of the all normalized investment cost, the energy cost(natural gas, methane gas, electricity, thermal and steam costs) used during treatment processes, membrane charges during filer changing , personal and chemical costs, pumps and mechanic stirring device costs , bakıve onarımcosts (Tables 1, 2). For MD membran process flowrate: 30,000 m3/day, the ratio of permeat velocity to the food velocity 95%; yearly productiob capacity=: 30.000 m3/day x 365 day/year x 0.95 = 104.045.000 m3/year; First investment-capital cost: It can be calculated by the assumption of the capacity factor. The cost of a new MD process can be calculated with a similar known MD process cost and capacity. In order to calculate the normalized first investment cost.
The first normalized capital cost to treat the 1 m3 wastewater Equation (1) was used
The known capital of the old MD Process / the first capital cost of the second MD
= (MD-1 capacity/MD-2 capacity)m (Equation 1);
m is the capacity factor, and indicated the slope of the log curve in MD process for mall or big membrane process. The capacityfactor in MD system was accepted as 0.6 olarak alınır (Bick et al, 2012). The first investment cost (Euro/(m3/day ) for a flowrate of 30.000 m3/day was calculated as 850 Euro/m3.day (Bicket al, , 2012).
[(850 Euro/m3.day) × (30.000 m3/day)] × [(30.000 m3/day /29.000 m3/DAY)]0.6 = 27,270.596 Euro,
Capital recovery factor (CRF); cost reduction rate (r), and the sum of the cost payment numbers in the years in the future was (n)’ dir. r and n was taken as 7% and 10, respectively.
CRF is equal to r(1 + r)n/(1 + r n)–1 = [0.07 [ (1 + 0.07) 10/(1 + 0.07 10) –1]= 0,02 ( Equation 2) (Kesime et al., 2012)
normalized first investment cost is equal to : CRF × [ first investment cost (euro/year)/membran capacity (m3/yEAR) ]
The normalized first investment cost= 0,02 × [27,270,596 Euro/(104,045,000 m3/yıl)]= 0.005 Euro/m3 Electrical cost: Energy cost (Euro/m3) = Energy cost (Euro/kWh) x specific energy consumption (kWh/m3).
This specific energy comcumption for electricity was taken as 0,5 kWh/m3 (Kesime ve diğerl, 2012).
The specific energy consumption for natural – methane gas utilization was taken as 0.4 kWh/m3 (2, 33). 1 kWh electricity cost is =23 krş = 0,23 TL = 0.07 Euro, 1 Euro=3.1 TL alınmıştır.
Electricity requirement is equal to 0,07 Euro/kWh × 0,5 kWh/m3 = 0,035 Euro/m3
The cost of 1 kwh of natural gas is 0,08 TL = 0,02 Euro.
Natural gas requirement for methane gas is equal to 0.02 Euro/kwh x 0,4 kwh/m3 = 0.008 Euro/m3, Steam and thermal energy requirement for MD; 0,001 m3 STEAM energy is equal to 0,072 m3 methane gas
Steam energy cost = 0.0024 Euro/kwh (9). Specific energy consumption for steam energy = 100 kwh/m3,
Steam enegy expense (Euro/m3) = Energy cost (Euro/kWh) × specific energy consumption (kWh/m3);
Steam expense is accepted as 10% of the thermal energy; the steam energy expenses is = 0,0024 Euro/kwh × 100 kwh/m3 × 10/100 = 0,024 Euro/m3; Membrane changing cost: Membrane upflow rate = 6 kg/m2/h, membran cost 1,5 Euro/m2, membrane alteration cost is 20% , membran replacement rate = one in a year.
Membrane cost (Euro/m3) = [membrane price(euro/m2) × membrane changing rate (1/y)] × [ (1000 (l/m3) ]/[(membran akısı (6 kg/m2 × h) × 8760 h/yıl)] = 1,5 Euro/m2 × 0,20 × [(1000 l/m3)/(6 × 8760)], = Membran replacement expense= 0,005 Euro/m3,
Membran maintenance cost is calculated as 2% of the normalized investment cost of the mambran:. Membrane maintenance expense = 0,005 Euro/m3 × 0,02 = 1 × 10⁻⁴ Euro/m3
Personal cost (Euro/m3) = personal expense (TL-/day)/wastewater flow rate (m3/day), Personel cost: 30 days 2000 TL ( with assurance) person/month= 66 TL person/day = 21,3 Euro/day, Personal cost= 0.0007 Euro/m3; emission cost= Carbon cost= (Euro/m3) = Energy requirement (kwh/m3) x Emission factor (kg CO2-e/kwh) x carbon tax (Euro/ton CO2-e)X 1/1000 (ton/kg); for 1 ton carbon the tax is accepted as 17 Euro/ton. Emission factor for electricity= 1.22 kg CO2-e/kwh; Emission factor for methane gas is 18,4 kg CO2-e/kwh; Energy for electricity requirement is 0,5 kWh/m3 (2, 33).
Energy requirement for natural gas is accepted as 0,4 kWh/m3 (2, 33);
Carbon emission cost for electricity = 0,5 × 1,22 × 17/1000= 1,25 × 10⁻³ Euro/m3; Carbon emission cost for natural gas= 0,4 × 0,184 × 17/1000 = 7,36 × 10⁻⁵ Euro/m3; Cost for chemicals ( = H2SO4 1 L = = 10 Euro/L, NaOH 1 L= 9,67 Euro, For 30.000 m3/day flowrate 0,5 N’ lik 20 ml H2SO4 consumption= 2 × 10⁻⁴ Euro/m3; For 30.000 m3/gün flowrate 0.5 N 20 ml naoh consumption = 1,67 × 10⁻⁴ Euro/m3, cost for chemicals = 3,67 × 10⁻⁴ Euro/m3; Cost for pressured and vakuum pumps (4) = 225 Euro; Dört Investment cost of four pumps: Euro/(m3/day) is taken as 225 Euro/year. In recovery factor (KGF); Price reduction rate ® in recovery factor (KGF-RF), and the sum of the expensess will be paid ın the nex years is (n). (r = %3, n = 3 ). In the determination of Pump cost; recycling factor for pump ( RF = 0,02) normalized investment cost was calculated according to equation 3
RF × ( investment cost (Euro/year)/ pump capacity(m3/year) ( Eq… 3)
Pump capacity 30.000 m3/day × 365 day/year = 10,950,000 m3/year;
Normalized investment cost of pump is = 0,02 × [225 Euro/(10,950,000 m3/year)]= 4 × 10⁻⁴ Euro/m3’
The cost for all membran processes are güven based on unit m2. With the same way the total cost for all treatment processes were calculated. The cost were 1,5 , 0,90 , 1,4, 1,40, 1,42 , 1,49 and 0,0045 Euro per m2 membran area for the processes MD, UF, RO, NF,DCMD, PRO and for FO forward osmosis. MD için 1,5 Euro/m2; batık fiber delikli UF = 0,90 Euro/m2, RO = 1,4 Euro/m2; UF için 1,40 Euro/m2; NF için 1,42 Euro/m2, DCMD için 1,49 Euro/m2, PRO için 0,045 Euro/m2, and for forwarded osmosis is 0,28 Euro/m2.
Table 1. The results of toxicity tests performed by NMOs
|
Daphnia magna |
ATA |
Vibrio fischeri |
Bioaccumulation |
|||||
|
24 h (mg/l) |
48 h (mg/l) |
24 h (mg/l) |
48 h (mg/l) |
30 min (mg/l) |
10 mg/l COD |
100 mg/l COD |
1000 mg/l COD |
|
|
ZnO |
EC30=7,2 |
EC50=6,2 |
EC50=5,1 |
EC50=2,9 |
EC50=7,1 |
BCF 2 |
BCF 15 |
BCF 250 |
|
Co3O4 |
EC50=8,7 |
EC50=5,2 |
EC50=6,8 |
EC50=1,5 |
EC50=8,1 |
BCF 5 |
BCF 20 |
BCF 400 |
|
ZrO2 |
EC50=7,1 |
EC50=5,1 |
EC50=8 |
EC50=7,9 |
EC50=6,1 |
BCF 8 |
BCF 38 |
BCF 450 |
|
Bi2O3 |
EC50=5,1 |
EC50=4,2 |
EC50=4,9 |
EC50=2,9 |
EC50=9,9 |
BCF 9 |
BCF 45 |
BCF 460 |
|
ATO |
EC50=7,9 |
EC50=6,2 |
EC50=6,9 |
EC50=4,9 |
EC30=12,5 |
BCF 4 |
BCF 23 |
BCF 300 |
Table 2. Cost analysis for Ecotoxicity Tests
|
Cost for ecotoxicity test : Daphnia magna : 20 tests in year: 1,2 euro |
|
Cost for ecotoxicity test : Vibrio fischeri 20 test in year : 2.8 Euro |
|
Cost for ecotoxicity test : Anaerobic bacteria 20 test in year : 0.9 euro |
|
Cost for Bioaccumulation : 2.9 euro |
|
Total : 9.7 euro per year for 20 test |
2. Material and Methods
2.1 Analytical Procedures
2.1.1 Vibrio fischeri Acute Toxicity Test:
Bioluminescent tests were performed under a NaCl concentration of 2% at 18⁰C (with incubation block) according to ISO/EN/DIN 11348 with Vibrio fischeri. The effective concentration, EC50, is defined as the NMO concentration decreasing the 50% of the light emitted by the Vibrio fischeri.
2.1.2 Anaerobic Toxicity Test – ATA
Anaerobic Toxicity Assay (ATA) measures the adverse effect of NMOs on the rate of the methane gas production (Owen et al, 1979). ATA were performed at 35ºC at volume of 150 ml amber bottle reactors. Anaerobic sludge used for this test providing 3000 mg/l anaerobic VSS (volatile suspended solids).
2.1.3 Daphnia magna Acute Toxicity Test
Acute toxicity assays with D. magna were conducted following OECD 202 (2004). Different nano material concentrations and 10 neonates (24 h old) D. magna were exposed to each NMOs. Median (50%) effective concentration levels (EC50) was calculated from percentage of inhibition graphics for each NMOs.
2.1.4 Bioaccumulation (BCF) Test
The bioaccumulation of NMOs was evaluated according to OECD 305 (1996).
For bioaccumulating substances, it can be expected that a time-weighted average (TWA) is the most relevant exposure concentration in water (Cw) within the allowed range of fluctuation . It is recommended to calculate a TWA water concentration, it should be noted that the transformation of the water concentration is suitable when exponential decay between renewal periods is expected, e.g. in a semi-static test design. In a flow through system,transformation of exposure concentrations may not be needed. If TWA water concentrations are derived, they should be reported and used in subsequent calculations.
In a standard fish BCF test uptake and depuration can be described in terms of two first order kinetic processes.
Rate of uptake = k1 × Cw (Eq.1)
Overall loss rate = (k2 +kg +km +ke) × Cf (Eq.2)
k1= First order rate constant for uptake into fish (L·kg-1·day-1).
k2 = First order rate constant for depuration from fish (day-1).
kg = First order rate constant for fish growth (‘growth dilution’) (day-1)
km = First order rate constant for metabolic transformation (day-1)
ke = First order rate constant for faecal egestion (day-1)
Cw = Concentration in water (mg·L-1).
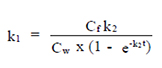
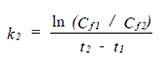
The test consists of two phases: the exposure (uptake) and post-exposure (depuration) phases. k1 is the uptake rate constant (day-1) (Eq. 1). Cw is the NMOs concentration in the water (mg/l), k2 is the depuration constant (day-1) (Eq. 2) and Cf is the NMOs concentration in the fish.
At steady-state, assuming growth and metabolism are negligible (i.e. the values for kg and km cannot be distinguished from zero), the rate of uptake equals the rate of depuration. BCF is the bioaccumulation Factor and it was calculated by k1/k2 in Equation 3 (Eq. 3).
The ratio of k1/k2 is known as the kinetic BCF (BCFK) and should be equal to the steady-state BCF (BCFSS) obtained from the ratio of the steady-state concentration in fish to that in water, but deviation may occur if steady-state was uncertain or if corrections for growth have been applied to the kinetic BCF. However, as k1 and k2 are constants, steady-state does not need to be reached to derive a BCFK.
BCF = k1 / k2 (Eq. 3)
 (Eq. 4)
 (Eq. 5)
2.1.5 Operational Conditions for the Membrane Processes
RO
A Hidrotek RO membrane consisting of ESPA2 LD and 0,4 mg/m2 nano ZnO with a surface area of 24 m2 at 21 bar Maximum pressure with a1,2 ml / min feed flow rate at 26°C at a pH =8 in continous mode(continuous operation) at a recovery of 85% was used.
MD
Js, the transmembrane flux is 0,7 kg m−2s−1), the lowest membrane pore is 0.0082, the porosity was 80–87%,feed flow rate 0,056 L/sec, the membrane material consist from PVDF with a paralel modül and contained 0,03mg/m2 Co2O3.
Hollow membrane
The membrane material consist from PVDF at a prseure of 3,5 bar, tensil module 06 0,0066 m2 at a flow rate of 0,23 L/sec, permeate flow rate 0f 0,6 L/sec, effective fiber lenttgh 0,6 m WİT A 0,02 mg/m2 ZrO2.
Pro Pressure Retarded Osmosis
The PRO process consisting from commercial cellulose triacetate provided by USA membrane production Center. An FO membrane supported by a USA (CTA-W) and an FO membrane (CTA-NW) was used. The RO experiments were conducted at 90 psi at 25 ± 0.2 °C. The PRO consisted from stainless steel with active membrane area of 110 cm2. The effluent was recirculated by a high pressure pump. The pressure in the draw solution was set by a back pressure regulator located downstream to the PRO. The temperature was 25 ± 0.2 °C with a Cross-flow velocity OF 8.5 cm/sEC WİTH 0,03 mg/m2 ATO.
MBR
The experimental MBR system comprised a bioreactor WİTH 20 L aerated tank AND with submerged flat sheet MF module consisting from a hydrophilic polypropylene membrane having a pore size of , 0.2μm. The channels between the membrane modules had a gap of 5 mm. The organic loading rate is 0,5 g COD/m3/day. The permeate suction pressure WA is 0.20 kPa with optimum SRT and HRT of 30 days and 6 days the aeration intensity and the permeate flux were 0,65 m3/m2 h and 14 L/m2 h at pH =8,0 with 0,09 mg/m2 ZnO
UF
UF membrane consinting from MWCO cntaining hollow fiber with a lentgh of 1,1 m, iner diameter is 0,65 μm with a 0,5 mg/m2 Co2O3 at a inlet flow rate of 4,86 ml/sec and a flux rate of 3,6 L/h.m2@20”C with a recovery of 90%.The molecular weigth cut-off is 30.000 D in YM30.
DCMD
Inlet flow rate is 1,5 L/sec, porosity 70%, length of Cross sectional area of flow channel is 0,0003 m2 with a 0,06 mg/m2 ZrO2 while the flow rate (Perimeter length of flow channel) is 0,115 m with a velocity of 0,135 m/h.
FO
The initial flux is 7.0µm/sec(25.2 L/m2 h while the hydraulic pressure is 3102.6 kPa (450 psi) containing 0,07 mg/m2 ATO. The flux is 7.04 m/s (25.2 L/m2 h), cross-flow velocity is 8.5 cm/sec, and the temperature was 21.0±1.0 ºC.
3. Results and Discussion
3.1 Comparison of Costs for Conventional and Advanced Treatment Plants
With conventional treatment processes (sequential anaerobic and aerobic treatments, Membrane processes and SBR) are not enough to threat the chemicals aforementioned and to reach to the discharge standards given by regulations. Furthermore, oxidation with chlorination, ozonation, chemical precipitation, UV/phenton processes consume high amount of chemical agents and, can produce toxic by-products and excess sludge. Furthermore, the cost of the conventional biological treatment plant are high compared to the advanced treatment plants utilizing the nanoparticles (data not shown). In advanced treatment processes in which the NPs was utilized, the total cost in RO, NF, UF and reduce to 0,0515 Euro, 0,0576 and 0,0576Euro to treat 20.000 m3 wastewater(data not shown). As result, the advanced treatment plants containing NMOs are significantly cheaper than conventional biological treatment plant. The cost in conventional treatment plants is 10 fold higher than that advance treatment plants containing NMOs (data not shown). Therefore, there is a real requirement for more efficient, cheaper and powerful technologies for treatment of industrial wastewaters. Among the various emerging technologies, the advancement in nanotechnology has proved an incredible potential for the remediation of wastewater and various other environmental problems [3].
3.2 Daphnia magna Acute Toxicity Test
The most toxic NMO is Bi2O3 with a low EC50 of 5.1 mg/l to D. magna after 24 h (Table 2). The least toxic NMO is Co3O4 with high EC50 value of 8.7 mg/l after 24 h incubation period (Table 2). After 48 h incubation the most toxic NMO was found to be Bi2O3 with the lowest EC50 value of 4.2 mg/l (Table 2). The least toxic NMOs were nano-ATO and nano-ZnO with the highest EC50 values of 6.2 mg/l (Table 2). The trophic transfer of ZnO NMO and ZnO-octyl NP from daphnids (Daphnia magna) to zebra fish (Danio rerio) was studied by [4]. For ZnO NMO and ZnO-octyl NP fast uptakes in D. magna were observed, whereas no measurable uptake took place for ZnO-OH NMO.
It was reported that the zinc recovered in the animals was not solely due to soluble zinc, but agglomerates/aggregates of ZnO NMO or ZnO-octyl NP contributed to the body burdens. [5] recently found that ZnO NP significantly accumulated and distributed in various tissues of juvenile carp (Cyprinus carpio). Only very few studies have reported on trophic transfer of engineered NMO. [6] demonstrated transfer of TiO2 NMO from D. magna to Danio rerio and studies using QD found evidence of potential trophic transfer [7]. The size distribution data showed a trend of ZnO NMO having the smallest hydrodynamic diameter, followed by Bi2O3, Co3O4, ZrO2 and ATO. In this study it was found that the NMO containing nanoparticles affected their EC50 values to D. magna. Though a combination of soluble, complexed Zn-species, and ZnO NMO as particles may contribute to the acute toxicity behavior observed in this study, the uptake of particles and aggregates contribute significantly to the overall acute toxicity observed. While dissolution may play a role in the uptake pattern observed for ZnO particles it is more likely that agglomerates contribute more inexplainable the higher uptake of bulk ZnO.
3.3 Anaerobic Toxicity Test – ATA
The least toxic NMO to anaerobic methane Archaea bacteria is Nano ZrO2 with the highest EC50 value of 8 mg/l after 24 h incubation while the most toxic NMO is Bi2O3 with the lowest EC50 value of 4.9 mg/l (Table 2). After 48 h incubation the EC50 values decreased at all NMO. The most toxic NMOs were nano-Co3O4 with the lowest EC50 values of 1,5 mg/l (Table 1). The least toxic NMO is nano ZrO2 with the highest EC50 value of 7.9 mg/l (Table 2). The biocidal potential of zinc oxide NPs against bacterial strain Pseudomonas aeruginosa was studied by Dwivedi et al. (2014). The NPs at a concentration of 100 µg/mL significantly inhibited the growth of bacteria and biofilm formation. The biofilm inhibition by ZnO-NPs was also confirmed via bio-transmission electron microscopy. ZnO-NPs treated bacteria confirmed the deformation and damage of cells. The bacterial growth in presence of NPs concluded the bactericidal ability of NPs in a concentration dependent manner. It has been speculated that the antibacterial activity of NPs as a surface coating material, could be a feasible approach for controlling the pathogens. No reports have described the toxicity of Bi2O3 nanoparticles, which indicates the necessity of investigating this area of nanotoxicology. Co3O4 nanoparticles, exert oxidative stress on human lymphocytes, damage DNA, and cause inflammatory responses [8]. Oxidative stress is an important factor for toxicity and causes the induction of apoptosis. Co3O4 nanoparticles induced cytotoxicity, morphological transformation, and genotoxicity in Balb3T3 cells [9]. All of these effects were most likely because of cobalt ion dissolution from the nanoparticles. Although cobalt metal oxide nanoparticles led to time- and concentration-dependent cytotoxicity, free Co2+ ions were more toxic.
3.4 Vibrio fischeri Acute Toxicity Test
The least toxic NMO was nano ATO with the highest EC30 value of 12.50 mg/l after 30 min for V. fischeri while the most toxic NMO was ZrO2 with the lowest EC50 value of 6.1 mg/l (Table 2). EC50 values obtained for ZnO from two models are comparable with effective concentrations of ZnO suspensions obtained by [10] (1.9 ppm) and [11] (4.8 ppm). The test results and calculation of effective concentration (EC) values showed that MCM-41 and nano-ZnO have the lowest and highest toxicity after 5 min exposure time to V. fischeri respectively. MCM-41 after 30 min contact time to Vibrio fischeri, was more toxic than nano SiO2. MCM-41s are listed to the latticed silica nano particles which are quite porous and have meso pore structure, while silica (SiO2) is nonporous-spherical nanoparticle. Bi2O3 although has attracted a great deal of attention as a semiconductor that is sensitive to visible light and has superior photocatalytic activity for environmental purposes, such as water treatment it was found to be toxic to Vibrio fischeri [12].
3.5 Bioaccumulation test of NMOs
The most accumulative NMO is Bi2O3 with high BCF values of 9, 45 and 460 mg/l at COD concentrations of 10, 100 and 1000 mg/l (Table 2). The least accumulative NMO İS ZnO with low BCF values of 2,15 and 250 mg/l, respectively (Table 2). According to REACH (Registration, Evaluation and Authorization of Chemicals) (REACH-EU, 2007) criteria if BCF values are less than 1000, the chemical is not bioaccumulative. Therefore all BCF values of NMOs used in this study were not higher than 1000 so these NMOs are not bioaccumulative according to REACH criteria.
3.6 Cost analysis for Ecotoxicity Test
Although some acute toxicities in bacteria, daphnids and methane Archaea bacteria the used NMOs were not bioaccumulative. Since the cost spent to conventional treatment plants are high in order to remove the pollutants from the wastewaters. Therefore, due to low investment costs of NMOs, in recent years the NMOs will be extensively used in the treatment of non-biodegradable pollutants at low concentrations. The acute toxicities of the NMOs should be monitored and the cost for these test was not so expensive (Table 2). For all acute toxicity tests and bioaccumulation the total cost is only 9.7 euro per year for 20 tests.
3.7 Treatment efficiencies in the novel processes containing the nano metal oxides
High removal efficiencies was obtained for all pollutants present in petrochemical industry wastewater (Table 3).
Table 3. Removal efficiencies in the novel processes containing NMOs
|
Parameter |
|||||||||
|
Removal efficiencies (%) |
MD |
PRO |
Submerged porous UF |
RO |
MF |
UF |
NF |
DCMD |
FO |
|
COD |
96 |
98 |
98 |
99,9 |
97 |
97 |
96 |
97 |
99 |
|
TOC |
95 |
98 |
98 |
99,9 |
97 |
98 |
97 |
99 |
|
|
Polyphenols |
95 |
98 |
97 |
99 |
97 |
98 |
96 |
98 |
|
|
TDS |
95 |
98 |
97 |
99 |
97 |
98 |
95 |
99 |
|
|
DOC |
96 |
98 |
98 |
99 |
96 |
97 |
96 |
98 |
|
|
Color |
95 |
98 |
98 |
99 |
98 |
98 |
95 |
98 |
|
|
Aromatic amines |
96 |
98 |
99 |
99 |
98 |
99 |
97 |
97 |
|
|
TN |
95 |
98 |
98 |
100 |
97 |
97 |
96 |
97 |
|
|
TP |
95 |
98 |
98 |
100 |
97 |
98 |
96 |
97 |
|
|
PAH |
94 |
98 |
99 |
99 |
98 |
98 |
96 |
97 |
|
The total cost for all studied advanced treatment processes are low to treat 1 m3 petrochemical wastewater (Table 4).
Table 4. Calculated costs for some advanced processes containing NMOs
|
Parameter |
MD |
Submerged porous UF |
RO |
MF |
UF |
NF |
|
Investment cost |
0,005 |
0,0077 |
0,0034 |
0,004 |
0,008 |
0,009 |
|
Energy cost for natural gas |
0,008 |
0,008 |
0,008 |
0,008 |
0,008 |
0,008 |
|
Energy cost for electricity |
0,035 |
0,035 |
0,035 |
0,035 |
0,035 |
|
|
Steam energy cost |
0,024 |
0,0011 |
0,0011 |
0,0012 |
0,005 |
0,003 |
|
Membrane exchange cost |
0,005 |
0,001 |
0,005 |
0,003 |
0,005 |
0,0055 |
|
Membran maintance cost |
0,0001 |
0,00002 |
0,0001 |
0,0001 |
0,0001 |
0,0001 |
|
Total cost |
0,0771 |
0,05172 |
0,0515 |
0,0151 |
0,3711 |
0,0576 |
Conclusion
The advanced treatment processes containing the NMOs were effectively used in the treatment of pollutants from the petrochemical industry wastewater. The cost of these treatment plants are low therefore should be preferred in the treatment of wastewaters containing refractory pollutants. With the utilization of nano metals below the inhibitions and toxicity levels high treatment efficiencies will be obtained in the industrial wastewater. The toxicity analysis results showed that the most toxic NMO is nano-Co3O4 to methane Archaea because of lowest EC50 value (1,5 mg/l) after 48 h. The least toxic NMO is ATO due to high EC50 value for organism (Vibrio fischeri ; 12,5 mg/l after 30 min). The results showed that nano-Co3O4 and Nano Bi2O3 are the most toxic NMOs with high acute toxicity compared to other NMOs. The most bioaccumulative NMO is nano-Bi2O3 due to the highest BCF value [13]. The least bioaccumulative NMO is nano-ZnO due to the lowest BCF value [13]. The concentrations of NMOs should be taken into consideration in the utilization of the novel treatment plant processes.
Acknowledgement
This study was prepared in the scope of Master of Sciences in Environmental Earth Sciences, and at the same time it was supported by the Department of Scientific Resource Project (2014.KB.FEN.019), in Dokuz Eylül University Graduate School of Natural and Applied Sciences. Also, the author acknowledged The Scientific and Technological Research council of Turkey (TÜBİTAK) for financial support (2210-C).
References
- Hull MS, Bowmann (2014) Nanotechnology Environmental Health and Safety: Risks, Regulation, and Management.
- Aruoja V, Dubourguier HC, Kasemets K, Kahru A (2009) Toxicity of nanoparticles of CuO, ZnO and TiO2 to microalgae Pseudokirchneriella subcapitata. Science of Total Environment 407: 1461–1468.
- Zare N (2007) Renewable and Alternative Energy: Concepts, Methodologies, Tools, and Applications, USA.
- Skjoldinga LM, Winther N, Baun A (2014) Trophic transfer of differently functionalized zinc oxide nanoparticles from crustaceans (Daphnia magna) to zebrafish (Danio rerio). Aquatic Toxicology 157: 101–108.
- Hao L, Chen L, Hao J, Zhong N (2013) Bioaccumulation and sub-acute toxicity of zinc oxide nanoparticles in juvenile carp (Cyprinus carpio): a comparative study with its bulk counterparts. Ecotoxicol Environ Saf 91: 52–60. [crossref]
- Zhua H, Wang J, Zhang X, Chang Y, Chen Y (2010) Trophic transfer of Ti O2 nanoparticles from daphnia to zebrafish in a simplified freshwater food chain. Chemosphere 79: 928–933.
- Woo ML (2015) Evidence of three-level trophic transfer of quantum dots in an aquatic food chain by using bioimaging. Nanotoxicology 9: 407–412.
- Zhang H, Ji S, Xia T, Meng H, Loe C (2012) Use of Metal Oxide Nanoparticle Band Gap To Develop a Predictive Paradigm for Oxidative Stress and Acute Pulmonary Inflammation. ACS Nano 6: 4349–4368.
- Cavallo D, Ciervo A, Fresegna AM, Maiello R, Tassone P, et al. (2015) Investigation on cobalt-oxide nanoparticles cyto-genotoxicity and inflammatory response in two types of respiratory cells. Journal of Applied Toxicology 35: 102–113.
- Heinlaan M, Ivask A, Blinova I, Dbourguier HC, Kahru (2008) Toxicity of nanosized and bulk ZnO, CuO and TiO2 to bacteria Vibrio fischeri and crustaceans Daphnia magna and Thamnocephalus platyurus. Chemosphere 71: 1308–1316.
- Mortimer M, Kasemets K, Heinlaan M, Kurvet I, Kahru A (2008) High throughput kinetic Vibrio fischeri bioluminescence inhibition assay for study of toxic effects of nanoparticles. Toxicology in Vitro 22: 1412–1417.
- Ana J, Jeong S, Moon HS, Jho EH, Nam K (2012) Prediction of Cd and Pb toxicity to Vibrio fischeri using biotic ligand-based models in soil. Journal of Hazardous Materials 203–204: 69–76.
- Hanna S, Miller RJ, Zhou D, Keller AA, Lenihan HS (2013) Accumulation and toxicity of metal oxide nanoparticles in a soft-sediment estuarine amphipod. Aquatic Toxicology 142–143, 441–446.