Abstract
Objective: to evaluate the presence and type of cardiovascular damage in normogonadic and hypogonadic male rats with a induced condition of mild hyperuricemia and exposed to a high-fructose diet.
Methods: Fifty six (56) male adult Wistar rats were used in the present work. Animals were divided into two groups; normogonadic (NGN) and hypogonadic (HGN), and each group was divided into four subgroups according to their treatment: control with only water (C), Fructose (F), Oxonic acid (OA) and Fructose plus Oxonic acid (FOA). Cardiovascular changes were evaluated by measuring systolic blood pressure , myocyte volume, fibrosis and intima media of aorta.
Results: The FOA group significantly increased blood pressure, myocyte volume (p<0.0001), the percentage of fibrosis was significant in the group receiving OA (p<0.001). When comparing NGN vs HGN, hypogonadic animals showed a less favorable lipid profile.
Conclusion: Hypogonadic, hyperuricemic conditions and a high-fructose diet favor blood pressure increase, along with changes in the cardiac hypertrophy, fibrosis and thickness increase of the intima media.
Key words
Hyperuricemia, Hypogonadism, Normogonadism, Cardiovascular Damage, Hypertension.
1. Introduction
Cardiovascular disease (CVD) is the main cause of mortality in the world 1] and is the first cause of morbi-mortality in the elderly adult man. The increase of CVD may be related to the concomitant decrease in testosterone levels, which can be associated with cardiovascular risk factors such as Body Mass Index (BMI) increase, abdominal obesity, inflammatory markers, insulin resistance, dyslipidemia, diabetes, hypertension and arteriosclerosis [2]. It is still controversial whether or not a testosterone decrease is an independent factor of CVD. The Rancho Bernardo study monitoring 1000 men aged from 40 to 79 during 12 years did not find any relation between testosterone levels and CVD [3]. Similar findings were observed in the Baltimore Longitudinal Study of Aging [4] and in the Honolulu Heart Program [5]. Conversely, in a 5-year monitoring study, Ohlsson and coll. [6] found that men with higher testosterone levels showed less CVD incidence. Likewise, other authors found that low levels of testosterone showed a greater CVD incidence [7–9].
Uric acid is the end product of purine catabolism. Although many mammals such as rats have uricase, an enzyme that degrades uric acid into allantoin, humans lost uricase during the course of evolution. Hyperuricemia may be the result of a purine-rich diet, an overproduction due to the increment in the action of the xanthine oxidase enzyme, as well as a decrease excretion of urates; although more often it is due to a high-fructose diet, being fructose a characteristic of fast food [10]. There is controversy regarding the oxidant and antioxidant actions of uric acid [11], including its effect on the CVD. Some studies have revealed a relationship between hyperuricemia and CVD such as NHANES I, LIFE study [12–14] whereas in others this relationship was not found [15–18]. Ranjith [19] and Tomiyana [20] observed a positive relationship between CVD, hyperuricemia and metabolic syndrome.
All studies were performed in adults and being them mostly men. But none of the studies expresses the gonadal state of men or testosterone levels. Unlike what happens in the studies of women, where the menopause marks a difference of the gonadal stage.
For this reason, the object of this paper is to evaluate the presence and type of cardiovascular damage in normogonadic and hypogonadic male rats with a induced condition of mild hyperuricemia and exposed to a high-fructose diet.
2. Experimental
2.1 Animals
Fifty six male adult Wistar rats from the Department of Physiology, School of Medicine, University of Buenos Aires were used for this experiment. Animals were housed in a light, temperature and humidity controlled environment (lights on from 07.00 am to 07.00 pm, T 22–24° C), and were fed ad libitum, having access to chow and water during the experiment. When the experiment began animals were 70 days old. Animal handling and experiments were performed in line with the “Ethical principles and guidelines for experimental animals” of the Swiss Academy of Medical Sciences (3rd Edition 2005).The study was granted by the Animal Care and Ethics Committee of the School of Medicine-UBA (CICUAL).
2.2 Experimental Design
Eight groups of adult male Wistar rats (n= 7/group) four normogonadic (NGN) and four hypogonadic (HGN), were studied over a period of 5 weeks;
The NGN groups were divided into four subgroups (n= 7/group; weight 200 grams ± 5 grams): a) Control group (C): fed with a standard commercial diet and water. b) Fructose group (F): fed with the same diet plus 10% (w/v) fructose (100% fructose, Tate&Lyle, USA) in the drinking water during 5 weeks. c) Oxonic Acid group (OA) (97% oxonic acid potassium salt, Sigma Aldrich n°:156124, St.Louis, MO, USA): fed with a standard commercial diet and water, and receiving the uricase inhibitor OA by intragastric gavage (750 mg/kg BW, daily) (21). d) Fructose and Oxonic Acid group (FOA): fed with the control diet plus 10% (w/v) fructose in the drinking water during 5 weeks and receiving also the oxonic acid by intragastric gavage (750 mg/kg BW, daily), during the same period. All animals were fed with balanced food for laboratory rodents (Cooperation, ACA-16014007, Argentine Cooperative Association, Animal Nutrition Division, Argentina Industry).Animals in all groups were provided from same diet lots at the same time during the course of the study, to control across groups for possible variation in the content of the diet.
In the second group (HNG), young adult male rats (70 days old) were orchiectomized bilaterally through an anterior median incision in the scrotum and each duct deferens was isolated, ligated and cut, and so the testicle could be removed. One month after that, HNG animals (100 days old) began the experimental period and were divided into the same four subgroups (n= 7/group; weight 280 grams ± 5 grams) that received the same treatment as the four NGN groups: a) Control group (C), b) Fructose group (F), c) Oxonic acid group (OA), d) Fructose and Oxonic acid group (FOA).
In all control and fructose groups without OA, animals received water vehicle administered by intragastric gavage. In such way all animals had the same level of stress by gavage.
2.3 Body Weight and Systolic Blood Pressure Measurements
Animals body weight was measured daily (g) were carried out using an analytical balance (Scaltec model SAC-62), with an accuracy of (10–4 grams), following the recommendations of Cossio-Bolaños et al [22]. Amount of beverage consumed by each group of rats was calculated and measured daily according to the volume of liquid consumed.
Systolic blood pressure (SBP) was measured in conscious rats by a validated volume-based tail-cuff method connected to an amplifier and a data acquisition system (Rat Tail System; Innovators in Instrumentation, Landing NJ, USA). All animals were preconditioned for blood pressure measurements 1 week before each experiment. SBP was measured at baseline, at the end of week 2, and at the end of week 4. Prior to measurements, rats were placed in a holder preheated to 35°C. An average value from three SBP readings (that differed by no more than 2 mm Hg) was determined for each animal after they had become acclimatized to the experimental environment.
2.4 Blood Measurements
At the end of the 5-week-treatment period all animals were sacrificed between 9:00 – 10:00 am by decapitation and trunk blood samples were collected to measure plasma glucose, creatinine, uric acid, and lipid profile total-cholesterol, triglycerides (TG), and HDL-cholesterol. The TG/HDL-cholesterol index was calculated as a surrogate marker of insulin resistance (IR) [23]. All these values were assayed with commercial kits (Bayer Diagnostics, Argentine) implemented in an automated clinical analyzer. Testosterone was measured by Electrochemiluminescence immunoassay (ECLIA) (Roche Diagnostics Ltd., Switzerland).
2.5 Cardiovascular Outcomes
The whole heart from seven animals from each experimental group was carefully dissected and removed and its wet weight was recorded; thereafter, a piece of each heart was obtained, fixed in 10% formaldehyde and embedded in paraffin. The sections were stained with hematoxylin & eosin and Periodic Acid Schiff (PAS).
2.5.1 Morphometric determination of myocyte size
We measured cardiomyocyte sizes previously stained with hematoxylin, eosin and PAS. To be consistent, myocytes positioned perpendicularly to the plane of the section with a visible nucleus and cell membrane clearly outlined and unbroken were then selected for the cross sectional area measurements. Myocyte volume (myocyte hypertrophy) was calculated from individual myocyte area (formula: length (μm) × width (μm) × 7.59 × 10⁻³) based on the previously demonstrated correlation between these parameters [24]. A total of 50 myocytes per animal were selected from the left ventricle of each heart and analyzed by an observer blinded to the experimental treatment.
2.5.2 Fibrosis
Sections were stained with Masson’s trichrome. Positive blue color was analyzed in Image Pro Plus (Media Cybernetics).
2.5.3 Intima Media Aorta
At the end of the experiment, only in hypogonadic rats, the thoracic aorta (from the arch to the diaphragm) was harvested, cut in half, and either fixed in buffered formalin or snap frozen. Aorta rings were embedded in paraffin and sections were cut at 4 μm and prepared for hematoxylin and eosin (HE) staining. Quantification of injured area in HE-stained aorta sections was analyzed using Image-Pro Plus software and analyzed by an observer blinded to the experimental treatment.
2.6 Statistical Analysis
Values are expressed as means ± SEM. Significant differences between treatment groups were determined by two-way ANOVA. When p<0.05, ANOVA post test comparisons were made using a Bonferroni multiple-comparison test. The relationship between variables was assessed by correlation analysis (Pearson correlation). Statistical analysis was performed with Prism version 5.04 (Graph Pad Software, San Diego, CA).
3. Results
3.1 Body weight
Although there was an increase in weight between the start and the end of the experiment in all the groups (p < 0.001), no significant difference was found at the end of the experiment between groups, both in NGN and HGN animals (not shown).
3.2 Water intake
All animals receiving fructose (F) drank more liquid volume than the control group or animals receiving other treatments, NGN group: (C: 122.5 ± 17.5, F: 258 ± 65, OA: 107.5 ± 22.5, FOA: 250 ± 50 ml/day (p<0.01), HGN: (C: 125 ± 15, F: 235 ± 65, OA: 105 ± 5, FOA: 250 ± 50 ml/day (p<0.01) (not shown).
3.3 Blood Pressure
In normogonadic animals: Control group did not show SBP changes during the experiment. Nevertheless, there was a significant increment in the F group (p<0.01), in the OA group (p<0.0001) and in the FOA group (p<0.0001) compared to basal state. At the end of the experimental period, SBP was significantly higher in all treatment vs control group (p<0.0001). In addition, a significant difference was found between F vs OA and FOA groups (p<0.01), reaching maximal SBP levels in FOA, which was significantly higher than in the OA group (p<0.01) (Figure 1).
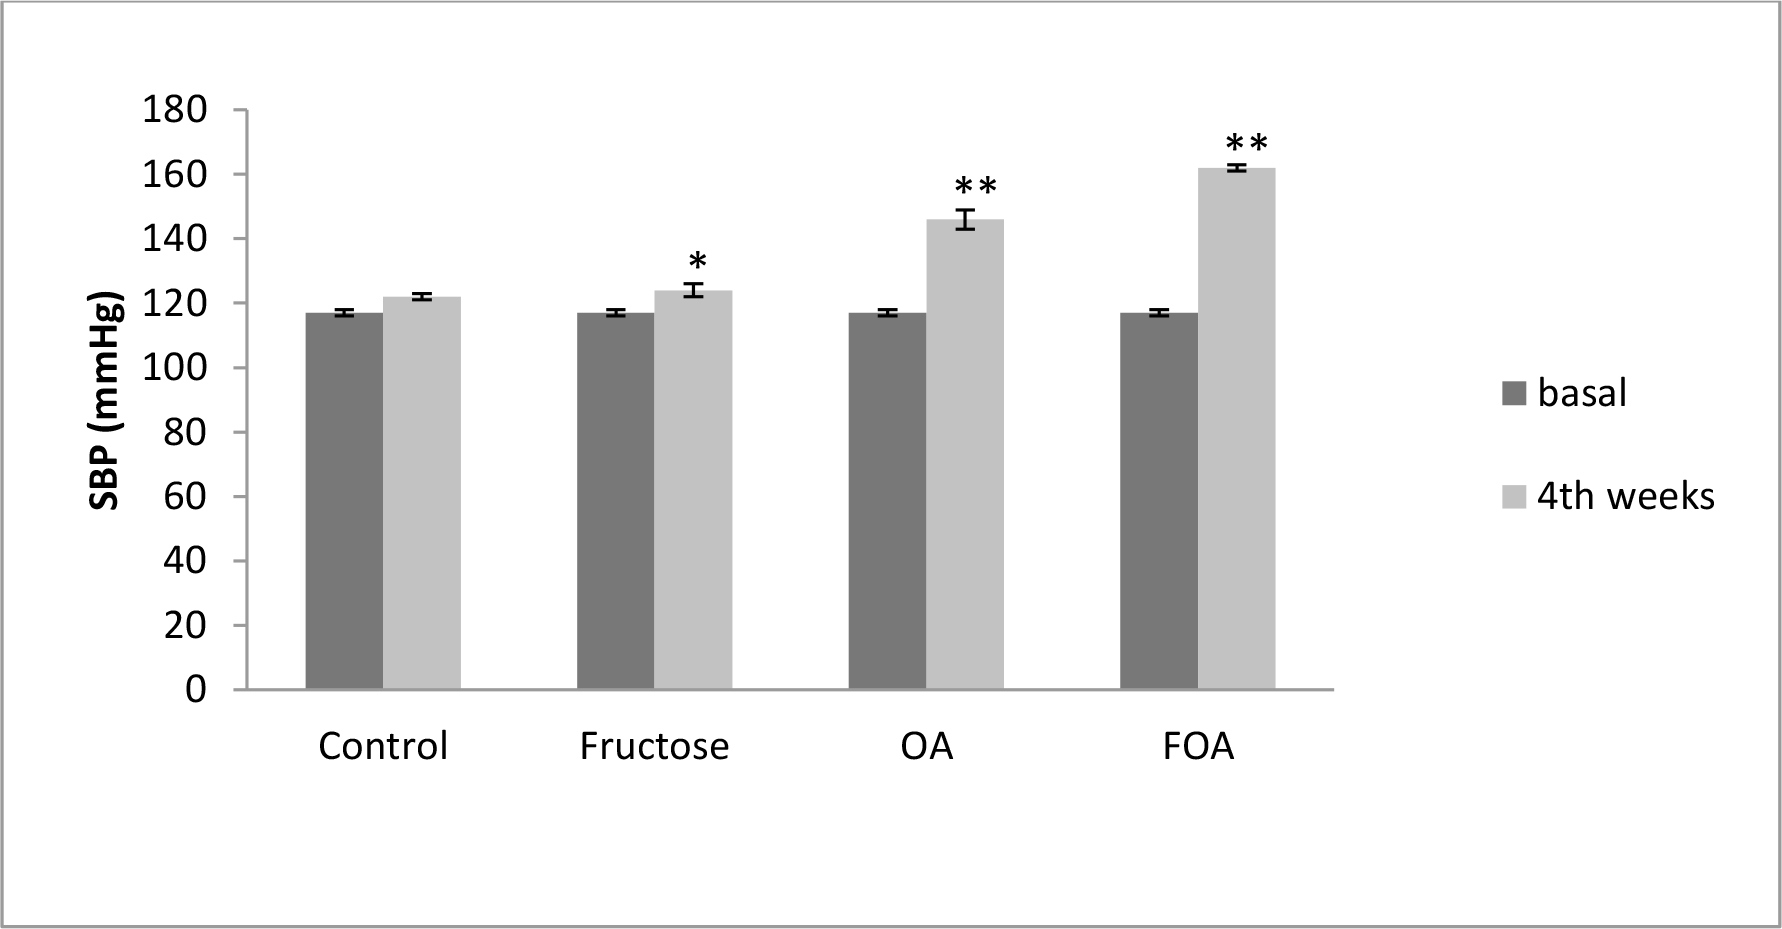
Figure 1. Blood Pressure in NGN groups, at basal and 4th weeks after beginning treatment.
Data are expressed as mean ± SEM. NGN (Normogonadic), OA (Oxonic acid); FOA (Fructose and oxonic acid)
* p<0.05 Fructose at 4th week vs Fructose basal.
** p<0.001 OA and FOA groups at 4th weeks vs respective basal groups.
In hypogonadic animals: Contrary to normogonadic rats, the control group showed a significant (p<0.01) increment in SBP during the time of experiment. Also there was a significant (p<0.001) increment in the F, OA (p<0.0001) and FOA groups (p<0.0001). At the end of the experiment, SBP was significantly higher in all treatments vs. control group (p<0.001). In addition, a significant difference was found between F vs. OA and FOA groups (p<0.01), reaching maximal SBP levels in FOA, that were significantly higher than in the OA group (p<0.01). (Figure 2).
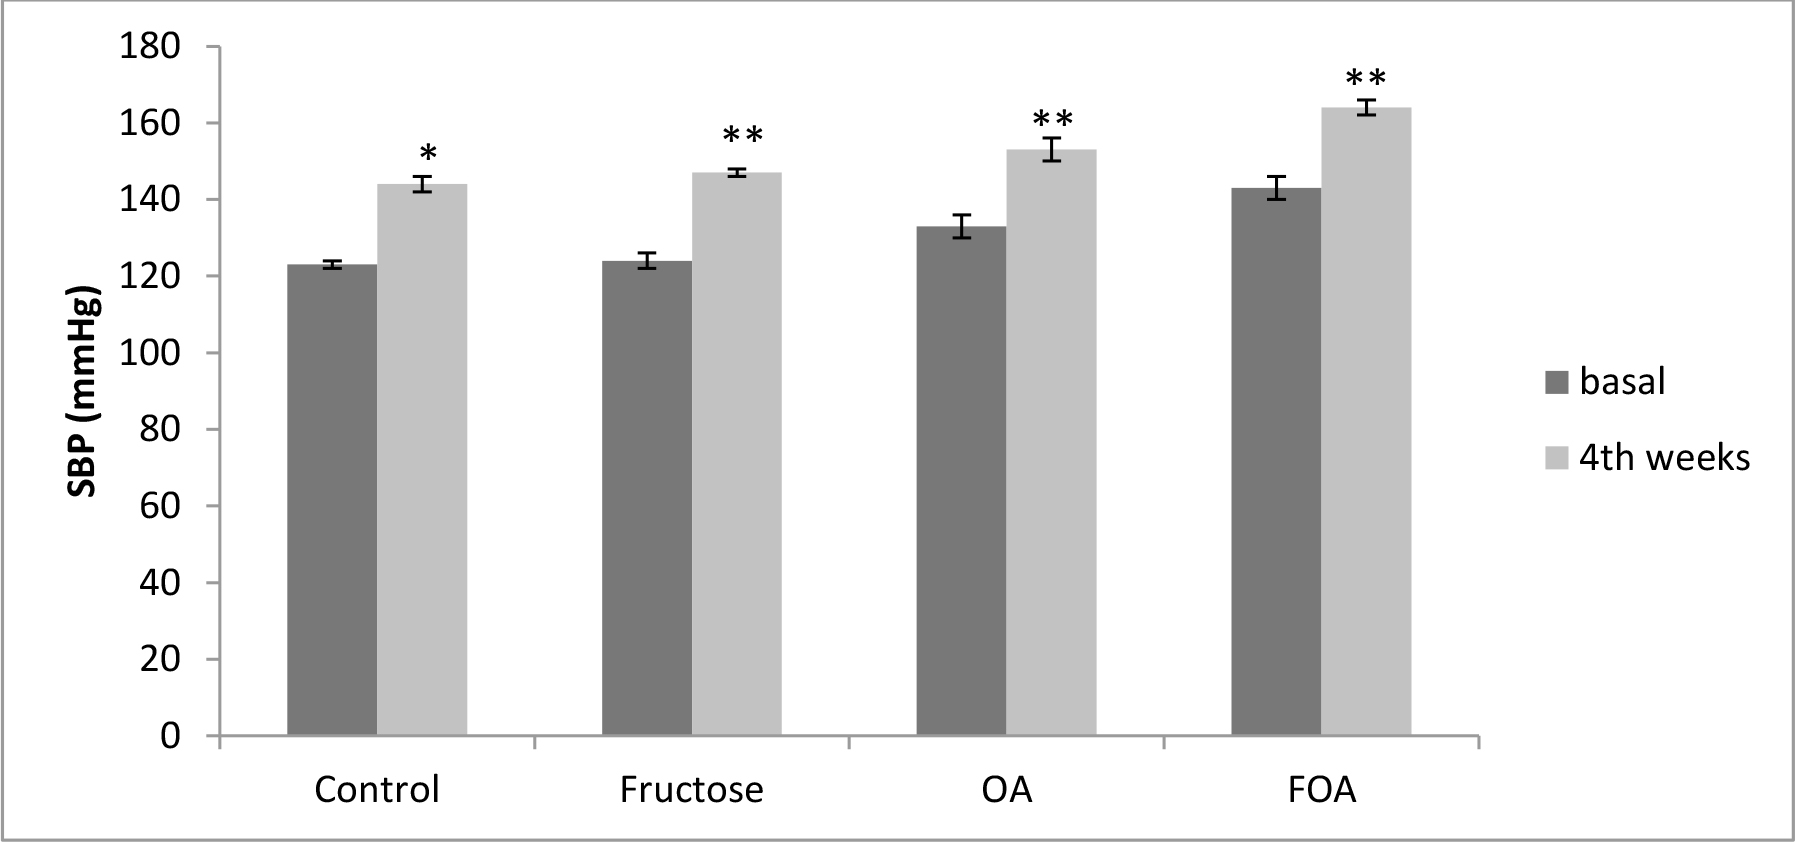
Figure 2. Blood Pressure in HGN groups, at basal and 4th weeks after beginning treatment.
Data are expressed as mean ± SEM. HGN (Hypogonadic), OA (Oxonic acid); FOA (Fructose and oxonic acid)
*p<0.001 Control at 4th week vs Control basal.
**p<0.0001 Fructose, OA and FOA groups at 4th week vs respective basal groups.
When comparing gonadal condition, HGN rats presented -in all groups and during the whole experimental time- higher SBP levels than NGN rats (p <0.0001), except at the end of experimental time in OA and FOA groups.
3.4 Biochemical Variables
As expected, testosterone levels decreased to a very low level in all hypogonadic animals compared to all non castrated rats (p<0.0001). Nevertheless, in both normogonadic and hypogonadic groups there were no plasmatic testosterone levels differences between different treatments. There was no difference in plasmatic creatinine levels when comparing treatment groups. Also no significant differences were observed in fasting glucose levels between normo and hypogonadic groups with different treatments.
Uric acid levels were significantly higher in normogonadic animals treated with OA (UA: 1.27 ± 0.13 mg/dl) and FOA (UA: 1.49 ± 0.1 mg/dl) when comparing them to the respective control group (UA: 0.97 ± 0.04 mg/dl) (p< 0.01). Also, uric acid levels were significantly higher in hypogonadic animals treated with FOA (UA: 1.29 ± 0.06 mg/dl) when comparing them to the respective control group (0.96 ± 0.67 mg/dl) (p< 0.01). Likewise, there were no significant differences when comparing NGN and HGN animals undergoing same beverage treatment.
Regarding the lipid profile, NGN animals showed no significant difference in Total Cholesterol (TC), triglycerides (TG), HDL-c levels, in no-HDL-c, in the TG/HDL index in the different experimental groups.
HGN animals in the fructose (F) group showed a significant increase (p<0.01) in TG and TC levels, accompanied by an increase of no HDL-c (p<0.05) with no changes in the HDL fraction. These changes translated into a significant increase (p<0.05) of the TG/HDL index. Conversely, the lipid profile showed no changes in OA and FOA groups when comparing them to the control group.
Hypogonadic animals showed -when faced to fructose administration- a significant increase in CT plasmatic levels (p<0.0001), TG (p<0.01), no HDL-c (p<0.0001) and a decrease of HDL (p<0.0001) accompanied by an increase of the TG/HDL index (p<0.004) as compared to the normogonadic animals. Likewise, hyperuricemia induction (OA) in HGN animals produced an HDL decrease (p<0, 001) with a rise of no HDL-c (p< 0, 001) accompanied by an increase of the TG/HDL index (p<0.02); and the combined treatment (FOA) in the same group showed a decrease of HDL (p<0.02) with an increase of no HDL (p<0.04) (Table 1)
Table 1. Lipid Profile. Comparative effect of the gonadal condition at different stages of treatments.
|
Cholesterol (mg/dl) |
NGN |
HGN |
p (NGN vs HGN) |
|
Control |
53.71 ± 10.12 |
59.83 ± 2.56 |
NS |
|
Fructose |
56.00 ± 5.68 |
74.79 ± 3.21* |
0.0001 |
|
OA |
55.28 ± 5.85 |
60.22 ± 2.84 |
NS |
|
FOA |
63.00 ± 2.20 |
60.38 ± 4.11 |
NS |
|
Triglycerides (mg/dl) |
|||
|
Control |
64.14 ± 16.65 |
67.5 ± 6.85 |
NS |
|
Fructose |
69.28 ± 14.28 |
103.15 ± 9.58** |
0.01 |
|
OA |
48.00 ± 7.69 |
59.25 ± 5.66 |
NS |
|
FOA |
67.14 ± 15.84 |
68.03 ± 7.23 |
NS |
|
HDL-c (mg/dl) |
|||
|
Control |
41.71 ± 4.39 |
27.75 ± 1.85 |
0.001 |
|
Fructose |
44.71 ± 6.01 |
30.89 ± 2.06 |
0.0001 |
|
OA |
44.28 ± 5.54 |
31.95 ± 1.57 |
0.001 |
|
FOA |
44.00 ± 6.72 |
34.58 ± 2.21 |
0.02 |
|
TG/HDL |
|||
|
Control |
1.05 ± 0.58 |
1.47 ± 0.31 |
NS |
|
Fructose |
1.52 ± 0.45 |
3.49 ± 0.54*** |
0.004 |
|
OA |
1.10 ± 0.24 |
1.86 ± 0.16 |
0.02 |
|
FOA |
1.58 ± 0.48 |
2.06 ± 0.31 |
NS |
|
No HDL-c (mg/dl) |
|||
|
Control |
22.00 ± 6.30 |
32.08 ± 0.95 |
0.01 |
|
Fructose |
19.28 ± 4.59 |
43.9 ± 2.80€ |
0.0001 |
|
OA |
19.00 ± 2.45 |
28.26 ± 2.27 |
0.01 |
|
FOA |
19.00 ± 4 |
25.20 ± 2.35 |
0.04 |
Data are expressed as mean ± SEM . NGN: normogonadic HNG: hypogonadic, OA: oxonic acid; FOA: Fructose and oxonic acid. NS: non significant.
*p< 0.01 HGN Control vs HGN Fructose group.
**p< 0.01 HGN Control vs HGN Fructose group
*** p< 0.05 HGN Control vs HGN Fructose group.
€p< 0.05 HGN Control vs HGN Fructose group.
A weak positive correlation was found between the testosterone and HDL levels (r: 0.313, p<0.02) and a weak reverse relationship between the testosterone and no HDL levels (r -0.345, p<0.01) (Figure 3).
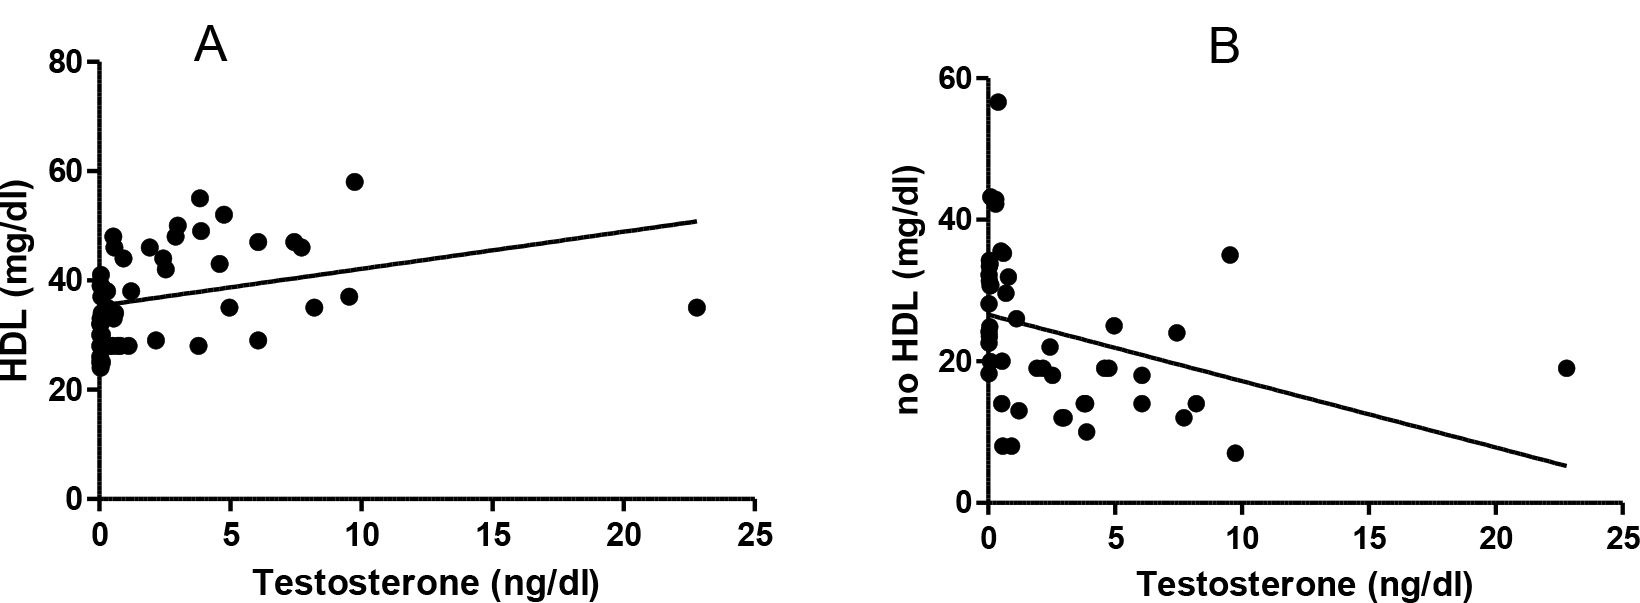
Figure 3. Testosterone and lipids correlation. A: Testosterone and HDL (r: 0.313 p< 0.02). B: testosterone and no HDL levels (r -0.345, p<0.01).
3.5 Cardiovascular Histology
3.5.1 Morphometric determination of myocyte size
In the NGN group of animals there was significant difference between groups, the ones treated with FOA showed a greater volume (p<0.001), followed by the ones treated with OA (p<0.001); then animals treated with F (<0.05), while control animals had the lowest volume (Figure 4 A)
Same pattern with significant difference was observed in the HGN group. The FOA group showed a greater volume (p<0.001), followed by the ones treated with OA (p< 0.001); then animals treated with F (NS), while control animals had the lowest volume. (Figure 4B)
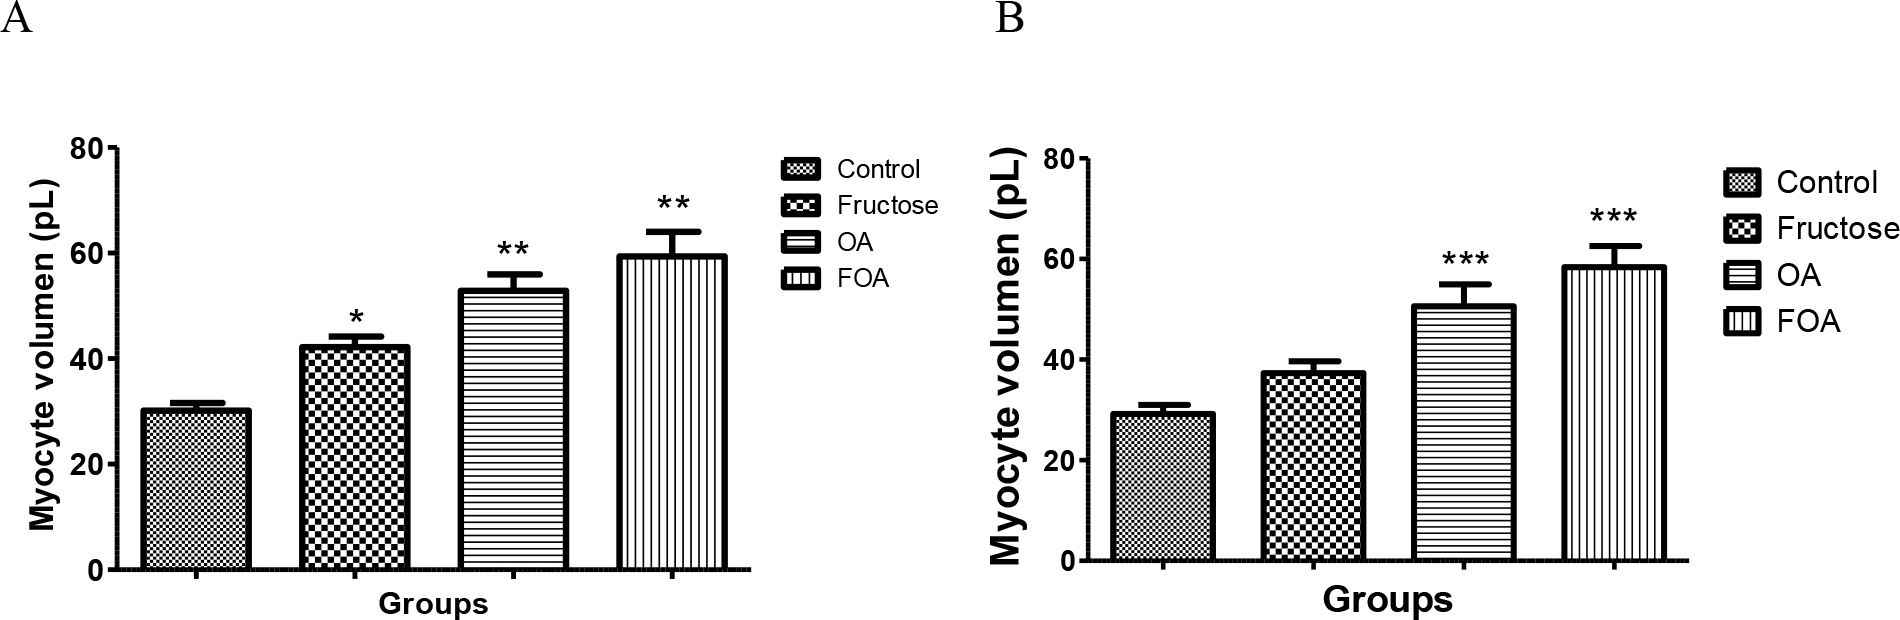
Figure 4. Myocyte volume of normogonadic (A) and hypogonadic rats (B).
Data are expressed as mean ± SEM. OA: oxonic acid, FOA: Fructose and oxonic acid.
*p < 0.05 Fructose vs Control NGN group
** p < 0.001 OA and FOA vs Control NGN group
*** p < 0.001 OA and FOA vs Control HGN group
No significant differences were found when analyzing different groups (NGN vs HGN) with same treatment.
3.5.2 Fibrosis
Animals in NGN groups treated with FOA showed a greater fibrosis percentage vs control (p<0, 009) also in F group (p<0.03 vs control). Animals in HGN groups treated with FOA and OA showed more fibrosis than control group (p<0.01) When comparing the different experimental groups (NGN vs HGN) under same treatment, we found a greater fibrosis in HGN animals treated with OA than in NGN animals under same treatment (p<0.04). Even though it was not significant, same pattern was observed in animals treated with FOA (Table 2).
Table 2. Percentage of miocardic fibrosis.
|
NGN |
HGN |
p |
|
|
Control |
2.69 ± 0.19*‡ |
2.56 ± 0.06**† |
NS |
|
Fructose |
3.25 ± 0.14‡ |
3.26 ± 0.34 |
NS |
|
OA |
2.97 ± 0.17 |
4.33 ± 0.62† |
0.04 |
|
FOA |
3.43 ± 0.14* |
5.96 ± 1.23** |
0.06 |
Data are expressed as mean ± SEM. NGN: normogonadic, HNG: hypogonadic, OA: oxonic acid; FOA: Fructose and oxonic acid. NS: non significant
*p <0.009 control group NGN vs FOA group NGN
‡p <0.03 control group NGN vs F group NGN
**p< 0.01 control group HGN vs FOA group HGN. † p< 0.01 control group HGN vs OA group HGN
3.5.3 Intima media of aorta
The intima media was significantly thicker in FOA (p<0.001), OA (p<0.001) and F (p<0.001) groups when compared to control animals, with no evidence of differences between the treated groups (Figure 5)
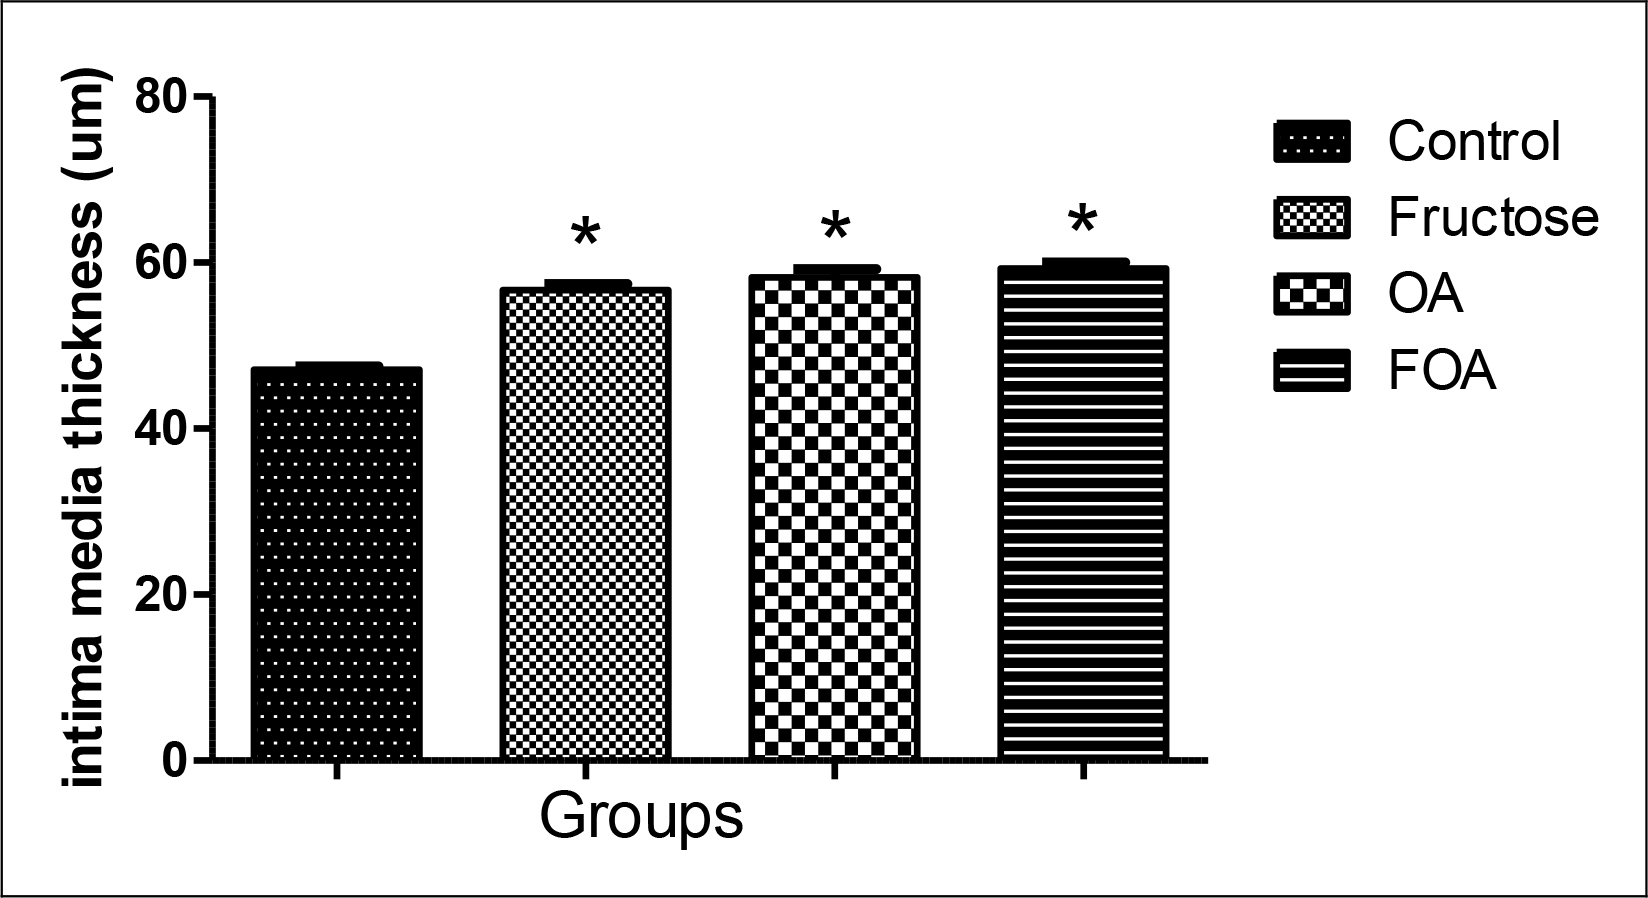
Figure 5. Intima media thickness in hypogonadic rats.
Data are expressed as mean ± SEM. OA: oxonic acid, FOA: Fructose and oxonic acid.
* p<0.001 Fructose, OA and FOA vs Control group.
4. Discussion
During our work we found that animals in both groups (NGN and HGN) treated with FOA showed a greater volume of myocyte, followed by OA groups while only normogonadic animals treated with F showed a greater volume when compared to control animals; this effect was not influenced by gonadal condition. Similar results were observed when systolic blood pressure was examined; probably the increase of same is -in part- the cause of the myocyte hypertrophy found.
Hyperuricemia leads -in its initial phase- to an endothelial dysfunction [25, 26], increase in the oxidative stress and activation of the rennin-angiotensin- aldosterone system [27] and in a second phase favors inflammatory changes [28]. Likewise, Saygin et al. showed recently that a high-fructose diet also produces endothelial damage [29]. Hypogonadic animals treated with F, OA and FOA showed an increase in the intima media when compared to the control group. So, we could observe that a high-fructose diet and hyperuricemia share mechanisms to favor the increase of intima media thickness, endothelial damage and arterial hypertension and in this way favoring arteriosclerosis [25, 26, 30] and cardiac hypertrophy. This is consistent with the observations made in our experiment where the FOA group showed the highest values of systolic blood pressure, greater thickness of the intima media and cardiac hypertrophy.
We also noticed that hypogonadic animals showed higher levels of blood pressure than the normogonadic ones. The blood pressure increase could be partly due to the weight increase observed in these animals, as well as insulin resistance and cytokine increase which favor vasoconstriction. Testosterone is a vasodilating agent; some experiments have theorized about an inhibition of the Voltage Gated Calcium Channels (VGCC) and/or activation of potassium channels in the vascular smooth muscle, and it could also be a result of an up regulation of endothelial nitric oxide synthase enzyme expression (eNOS) [31, 32].
Animals treated with FOA in both groups showed greater cardiac fibrosis when comparing with their respective controls: Likewise animals in the hypogonadic OA group showed a greater fibrosis compared with normogonadic OA, and the same tendency was observed in FOA groups. Chen et al. [33] showed that hyperuricemia increases cardiac fibrosis and Mellory et al. [34] found that the high-fructose diet also increases cardiac fibrosis. Unfortunately, there is a strong controversy regarding the role of testosterone over the cardiovascular effects [35] as to assert that the testosterone deficit causes cardiovascular damage and fibrosis.
Regarding the lipid profile, it is clear that hypogonadic animals showed a less favorable profile, where the fructose group is the one with higher levels of cholesterol, triglycerides, no-HDL and the TG / HDL ratio, a marker of insulin resistance [23].
High fructose diets lead to a hepatic insulin resistance with an increased influx of free fatty acids, synthesis and triglyceride storage, and VLDL synthesis excess. This overproduction of VLDL alters the lipoprotein lipase (LPL) function. Hypertriglyceridemia is normally associated with low HDL levels [36].
This occurs, and is partly due to an increment of the Cholesteryl ester transfer protein (CETP) activity which favors HDL decrease (36). In the resistance to insulin an alteration of hepatic and endothelial lipase activity has been observed; which increases the HDL catabolism [36].
So we can assert that high levels of triglycerides and a decrease in HDL levels are independents predictors of insulin resistance and cardiovascular disease [23].
Likewise, low testosterone levels are linked to a pro-atherogenic lipid profile. A positive correlation between HDL and testosterone levels was found in several works [37, 38]. Rancho Bernardo study also showed a reverse relation between testosterone and VLDL levels [39]. On the other hand, in all treatments we found a uric acid level increase in normogonadic animals compared to the hypogonadic ones. This could be the result of testosterone stimulant action on the urate transporter -1 (URAT-1) expression responsible for the reabsorption of urates at tubular level. Also the monocarboxylate transporter expression coupled with sodium type 1 and 2 which facilitates the presence of essential lactate for the urate/lactate transport by URAT-1 [40].
On the other hand we observed an inversely significant correlation between testosterone and body weight. Studies in humans [41–43] have shown that hypogonadic men have an increase in body weight (BMI) and in waist circumference. Although the mechanism has not been completely clarified, it was stated that adipocytes express androgen receptor [44] and that testosterone inhibits Lipoprotein Lipase (LPL) activity, responsible for the uptake of triglycerides by the fat cell, and so producing an inhibition of the triglyceride uptake and a decrease of visceral adipose tissue [45]. On the contrary, the lack of testosterone produces a higher triglyceride uptake with the subsequent increase of visceral fat. This increment favors a rise in the aromatase, increasing the estrogen synthesis. Likewise, it produces the resistance to insulin, which leads to an SHBG decrease, thus increasing the testosterone metabolism [46].
Undoubtedly animals treated with FOA, OA and F showed some morphologic and functional cardiovascular changes, shown by the increment in systolic arterial pressure and therefore a higher hypertrophy and fibrosis. These changes were affected by gonadal conditions. Likewise, hypogonadic animals showed greater weight, worse lipid profile (less HDL and more HDL) and a higher TG/HDL index as insulin resistance marker, which carries a greater atherosclerotic risk.
Fructose is a simple sugar that is present in fruits and honey and is responsible for their sweet taste. Excessive fructose intake (>50 g/d) may be one of the underlying etiologies of metabolic syndrome and type 2 diabetes. [47] One of the more striking aspects of fructose is its ability to stimulate uric acid production. As ATP is consumed, AMP accumulates and stimulates AMP deaminase, resulting in uric acid production. Researchers have reported a dose dependent relationship between fructose ingestion and serum uric acid levels in both men and women, although in another study this relationship was confirmed only in men [45] It has been proved that fructose administration to normal rats for different time periods sequentially induces impaired glucose tolerance and type 2 diabetes [48–50]. Also rats have an active uricase, and these findings explain why higher concentrations of fructose are required to induce greater metabolic changes in rats, whereas humans, who lack uricase, appear to be much more sensitive to the effects of fructose. For this reason, we induce mild hyperuricemia with an inhibitor of uricase, oxonic acid. That in humans would be given by a serum value between 6 to 7.0mg/dl [51]. Likewise, we believe that the age of the rats used in this present experiment, did not influence the results, since the male Wistar rats acquire their reproductive capacity at 60 days. We wanted to simulate a state of hypogonadism similar to a man around the age of forty, when testosterone begins to decline [52], without becoming an elderly adult.
A high fructose diet as well as hyperuricemia conditions, favor the increment of blood pressure and cardiovascular damage, and these effects are more relevant in animals with both conditions simultaneously. Likewise, it was also shown that the lipid profile is linked to testosterone levels. The combination of these conditions might explain why western fast food diets associated with a testosterone decrease favor the presence of cardiovascular disease in older men. In any case, it is necessary to carry out more studies to understand the mechanisms involved in such changes.
In short, cardiovascular damage was worse in rats with hypogonadism with a condition induced by mild hyperuricemia exposed to a high fructose diet than the normal gonadal state with a similar condition.
Authors’ Contributions
Study design was conducted by Jimena Soutelo, who also performed experiments, analyzed data, and wrote the paper. Yanina Alejandra Samaniego and María Cecilia Fornari were responsible for sample collection. Carlos Reyes Toso was responsible for performed experiments and data analysis. Osvaldo Ponzo analyzed data and wrote the paper.
Acknowledgement
This work was supported by Grants from University of Buenos Aires (UBACYT) Project number 20020130100439BA. We thank Angela Ciocca Ortúzar for the manuscript translation and revision.
References
- World Health Organization (WHO) Global status report on noncommunicable diseases 2014. 2014: 1–302. Available at: http://www.who.int/nmh/publications/ncd-status-report-2014/en/
- Shores MN, Biggs ML, Arnold AM, Smith NL, Longstreth WT, et al. (2014) Testosterone, dihidrotestosterone, and incident cardiovascular disease and mortality in the cardiovascular health study. J Clin Endocrinol Metab 99: 2061–2068.
- Barrett-Connor E, Khaw KT (1988) Endogenous sex hormones and cardiovascular disease in men. A prospective population-based study. Circulation 78: 539–545.
- Contoreggi CS, Blackman MR, Andres R, Muller DC, Lakatta EG, et al. (1990) Plasma levels of estradiol, testosterone, and DHEAS do not predict risk of coronary artery disease in men. J Androl 11: 460–470. [crossref]
- Phillips GB, Yano K, Stemmermann GN (1988) Serum sex hormone levels and myocardial infarction in the Honolulu Heart Program. Pitfalls in prospective studies on sex hormones. J Clin Epidemiol 41: 1151–1156.
- Ohlsson C, Barrett-Connor E, Bhasin S (2011) High serum testosterone is associated with reduced risk of cardiovascular events in elderly men. The MrOS (Osteoporotic Fractures in Men) study in Sweden. J Am Coll Cardiol 58: 1674–1681.
- Malkin CJ, Pugh PJ, Morris PD, Asif S, Jones TH, et al. (2010) Low serum testosterone and increased mortality in men with coronary heart disease. Heart 96: 1821–1825.
- Wehr E, Pilz S, Boehm BO, März W, Grammer T, Obermayer-Pietsch B (2011) Low free testosterone is associated with heart failure mortality in older men referred for coronary angiography. Eur J Heart Fail 13: 482–488.
- Hyde Z, Norman PE, Flicker L, Hankey GJ, Almeida OP, et al. (2012) Low free testosterone predicts mortality from cardiovascular disease but not other causes: the Health in Men Study. J Clin Endocrinol Metab 97: 179–189. [crossref]
- Johnson RJ, Segal MS, Sautin Y, Nakagawa T, Feig DI, et al. (2007) Potential role of sugar (fructose) in the epidemic of hypertension, obesity and the metabolic syndrome, diabetes, kidney disease, and cardiovascular disease. Am J Clin Nutr 86: 899–906. [crossref]
- Oda M, Satta Y, Takenaka O (2002) Loss of urate oxidase activity in hominoids and its evolutionary implications. Mol Biol Evol 19, 640–653.
- Alderman MH, Cohen H, Madhavan S (1999) Serum uric acid and cardiovascular events in successfully treated hypertensive patients. Hypertension 34: 144–150.
- Fang J, Alderman MH (2000) Serum uric acid and cardiovascular mortality the NHANES I epidemiologic follow-up study, 1971–1992. National Health and Nutrition Examination Survey. JAMA 283: 2404–2410.
- Høieggen A, Alderman MH, Kjeldsen SE, Julius S, Devereux RB, et al. (2004) The impact of serum uric acid on cardiovascular outcomes in the LIFE study. Kidney Int 65: 1041–1049. [crossref]
- Wannamethee SG, Shaper AG, Whincup PH (1997) Serum urate and the risk of major coronary heart disease events. Heart 78: 147–153. [crossref]
- Culleton BF, Larson MG, Kannel WB, Levy D (1999) Serum uric acid and risk for cardiovascular disease and death: the Framingham Heart Study. Ann Intern Med 131: 7–13. [crossref]
- Wheeler JG, Juzwishin KD, Eiriksdottir G (2005) Serum uric acid and coronary heart disease in 9,458 incident cases and 155,084 controls: prospective study and meta-analysis. PLoS Med 2:76.
- Kim SY, Guevara JP, Kim KM, Choi HK, Heitjan DF, et al. (2010) Hyperuricemia and coronary heart disease: a systematic review and meta-analysis. Arthritis Care Res (Hoboken) 62: 170–180. [crossref]
- Ranjith N, Myeni NN, Sartorius B, Mayise C (2016) Association Between Hyperuricemia and Major Adverse Cardiac Events in Patients with Acute Myocardial Infarction. Metabolic syndrome and related disorders 15: 1–8.
- Tomiyama H, Higashi Y, Takase B, Node K, Sata M, Inoue T, et al. (2011) Relationships Among Hyperuricemia, Metabolic Syndrome, and Endothelial Function. American Journal of Hypertension 24: 770–774.
- Tapia E, Cristóbal M, García-Arroyo FE, Soto V, Monroy-Sánchez F, et al. (2013) Synergistic effect of uricase blockade plus physiological amounts of fructose-glucose on glomerular hypertension and oxidative stress in rats. Am J Physiol Renal Physiol 304: 727–736. [crossref]
- Cossio MA, Gómez R, Arruda M, Hochmuller R ( 2010) Valores de confiabilidad de indicadores somáticos en ratas machos wistar. Actualizacion en Nutricion 11: 296–302.
- McLaughlin T, Abbasi F, Cheal K, Chu J, Lamendola C, et al. (2003) Use of Metabolic Markers To Identify Overweight Individuals Who Are Insulin Resistant. Ann Intern Med 139: 802–809.
- Satoh H, Delbridge LM, Blatter LA, Bers DM (1996) Surface volume relationship in cardiac myocytes studied with confocal microscopy and membrane capacitance measurements: species-dependence and developmental effects. Biophys J 70: 1494–1504.
- Tian TT, Li H, Chen SJ, Wang Q, Tian QW, Zhang BB, et al. (2018) Serum uric acid as an independent risk factor for the presence and severity of early onset coronay artery disease: A case control study. Disease Markers Volume, Article ID 1236837, 8 pages.
- Lan M, Liu B, He Q (2018) Evaluation of the association between hiperuricemia and coronary artery disease. A strobe- compliant articule. Medicine 97: 44–50.
- Yang X, Gu J, Lv H, Li H, Cheng Y, et al. (2019) Uric acid induced inflammatory responses in endothelial cells via up-regulating (pro) rennin receptor. Biomedicine & Pharmacotherapy 109: 1163–1170.
- Kanbay M, Segal M, Afsar B, Kang DH, Rodriguez-Iturbe B, et al. (2013)The role of uric acid in the pathogenesis of human cardiovascular disease. Heart 99: 759–766.
- Saygin M, Asci H, Cankara FN, Bayram D, Yesilot S, et al. (2016) The impact of high fructose on cardiovascular system: Role of α-lipoic acid. Hum Exp Toxicol 35: 194–204. [crossref]
- Liu Z, Chen T, Niu H, Ren W, Li X, et al. (2016) The Establishment and characteristics of rat model of aterosclerosis induced by hiperuricemia. Stem Cells International Article ID 1365257, 7 pages.
- Kelly DM, Jones TH (2013) Testosterone: a vascular hormone in health and disease. J Endocrinol 217: 47–71. [crossref]
- Chistiakov DA, Myasoedova VA, Melnichenko AA, Grechko AV, Orekhov AN, et al. (2018) Role of androgens in cardiovascular pathology. Vasc Health Risk Manag 14: 283–290. [crossref]
- Chen Ch, Hsu YJ, Lee TM (2011) Impact of elevated uric acid on ventricular remodeling in infacted rats with experimental hiperuricemia. Am J Physiol Heart Circ Physiol 301: 107–117.
- Mellor KM, Bel JR, Young MJ, Ritchie RH, Delbrigde L (2011) Myocardial autophagy activation and suppressed survival signaling is associated with insulin resistance in fructose fed mice. Journal of Molecular and Cellular Cardiology 50: 1035–1043.
- Testes RC, Carneiros FS, Carvalho MHC, Reckelhoff JF (2016) Reactive oxygen species: Players in the cardiovascular effects of testosterone. Am J Physiol Regul Integr Comp Physiol 310: 1–14.
- Cornier MA, Dabelea D, Hernandez TL, Lindstrom RC, Steig AJ, et al. (2008) The metabolic syndrome. Endocr Rev 29: 777–822. [crossref]
- Haffner SM, Mykkänen L, Valdez RA, Katz MS (1993) Relationship of sex hormones to lipids and lipoproteins in nondiabetic men. J Clin Endocrinol Metab 77: 1610–1615. [crossref]
- Mäkinen JI, Perheentupa A, Irjala K, Pöllänen P, Mäkinen J, et al. (2008) Endogenous testosterone and serum lipids in middle-aged men. Atherosclerosis 197: 688–693. [crossref]
- Khaw KT, Barrett-Connor E (1991) Endogenous sex hormones, high density lipoprotein cholesterol, and other lipoprotein fractions in men. Arterioscler. Thromb 11: 489–494.
- Hosoyamada M, Takiue Y, Shibasaki T, Saito H ( 2010) The effect of testosterone upon the uratere absorptive transport system in mouse kidney. Nuclesides, Nucletides and Nucleic Acids 29: 574–579.
- Vermeulen A, Goemaere S, Kaufman JM (1999) Testosterone, body composition and aging. J Endocrinol Invest 22: 110–116. [crossref]
- Tsai EC, Boyko EJ, Leonetti DL, Fujimoto WY(2000) Low serum testosterone level as a predictor of increased visceral fat in Japanese-American men. International Journal of Obesity and Related Metabolic Disorders 24: 485–491.
- Corona G, Giagulli VA, Maseroli E, Vignozzi L, Aversa A, et al. (2016) Testosterone supplementation and body composition: results from a meta-analysis of observational studies. J Endocrinol Invest 39: 967–981.
- Bjorntorp P (1996) The regulation of adipose tissue distribution in humans. International Journal of Obesity and Related Metabolic Disorders 20, 291–302.
- Mårin P, Odén B, Björntorp P (1995) Assimilation and mobilization of triglycerides in subcutaneous abdominal and femoral adipose tissue in vivo in men: effects of androgens. J Clin Endocrinol Metab 80: 239–243. [crossref]
- Cohen PG (1999) The hypogonadal-obesity cycle: role of aromatase in modulating the testosterone-estradiol shunt–a major factor in the genesis of morbid obesity. Med Hypotheses 52: 49–51. [crossref]
- Johnson RJ, Perez-Pozo SE, Sautin YY (2009) “Hypothesis: could excessive fructose intake and uric acid cause type 2 diabetes?” Endocrine Reviews 30: 96–116.
- Thorburn AW, Storlien LH, Jenkins AB, Khouri S, Kraegen EW (1989) Fructose-induced in vivo insulin resistance and elevated plasma triglyceride levels in rats. Am J Clin Nutr 49: 1155–1163.
- Catena C, Giacchetti G, Novello M, Colussi G, Cavarape A et al. (2003) Cellular mechanisms of insulin resistance in rats with fructose-induced hypertension. Am J Hypertens 16: 973–978.
- Panchal SK, Brown L (2011) RodentModels forMetabolic Syndrome Research. Journal of Biomedicine and Biotechnology Volume 2011, Article ID 351982, 14 pages.
- Kuwabara M (2015) Hyperuricemia, Cardiovascular Disease, and Hypertension. Pulse 3: 242–252.
- Feldman HA, Longcope C, Derby CA, Johannes CB, Araujo AB, et al. (2002) Age Trends in the Level of Serum Testosterone and Other Hormones in Middle-Aged Men: Longitudinal Results from the Massachusetts Male Aging Study. J Clin Endocrinol Metab 87: 589–598.