DOI: 10.31038/JMG.2018114
Abstract
Background: Genetic diversity is greatest within Africa, in particular Southern Africa. Within the United States, African ancestry has been linked to lethal high-risk prostate cancer. Here we investigate the contribution of African ancestral fractions to high-risk prostate cancer in two South African populations.
Methods: Genetic fractions were determined for 152 South African men of African (Black) or African-admixed (Coloured) ancestries, in which 40% showed high-risk prostate cancer.
Results: Averaging an equal African to non-African ancestral contribution in the Coloured, we found African ancestry to be linked to high-risk prostate cancer (P-value = 0.0477).
Adjusting for age, the associated African ancestral fraction was driven by a significant KhoeSan over Bantu contribution, defined by Gleason score ≥ 8 (P-value = 0.02329) or prostate specific antigen levels ≥ 20 ng/ml (P-value = 0.03713). Although not significant, the mean overall KhoeSan contribution was increased in Black patients with high-risk (11.8%) over low-risk (10.9%) disease. Using KhoeSan ancestry as a surrogate for high-risk prostate cancer, we identified four potential risk loci within chromosomal regions 2p11.2, 3p14, 8q23 and 22q13.2 (P-value = all age-adjusted < 0.01).
Conclusions: This is the first study to suggest a link between ancient KhoeSan ancestry and a common modern disease.
Key words
African ancestry; prostate cancer; KhoeSan; high-risk disease; ancestral fractions; ancestry informative markers
Introduction
High-risk prostate cancer (HRPCa) accounts for approximately 15% of diagnoses in Western countries, with significant potential for associated lethality [1]. Although a number of HRPCa classifications have been proposed, including variations in the requirement for clinical tumor staging and serum prostate specific antigen (PSA) levels, HRPCa is typically defined as pathological Gleason score (GS) ≥ 8 or PSA ≥ 20 ng/ml at diagnosis. In the United States, African American men are disproportionally affected by HRPCa and in turn present with the highest associated mortalities [2]. Additionally, HRPCa is disproportionally observed in men from sub-Saharan Africa and Southern Africa [3, 4]. In the latter study, compared with African Americans, Black South African men are at a 2.1-fold and 4.9-fold greater risk for presenting at diagnosis with GS ≥ 8 and PSA ≥ 20 ng/ml, respectively. While socioeconomic and lifestyle factors, as well as late detection, all contribute to the disproportionate impact of HRPCa within African Americans, the significance of genetic contribution is becoming increasingly evident [2,5]. However, data within Africa is severely lacking.
In addition to significant HRPCa presentation in Black South Africans, [4] HRPCa is also elevated within the African-admixed population from South Africa, the South African Coloured [4, 6]. While Black South Africans represent a uniquely African ancestry, predominantly Bantu, with contributing KhoeSan heritage, the Coloured arose as a result of intermarriage between initial European colonists, Dutch East Indian slaves and indigenous Bantu and KhoeSan Southern Africans [7, 8]. Therefore, the genetic ancestral fractions of the South African Coloured uniquely represent the broad spectrum of prostate cancer racial disparity reported in the United States, specifically African-biased high-risk, European-biased intermediate-risk (GS = 7) and Asian-biased low-risk prostate cancer (LRPCa; GS = 6). In this study we determine if African ancestry, specifically Bantu or KhoeSan African ancestry, is preferentially linked to HRPCa presentation in the region.
Participants and Methods
Study participants
South African men self-identifying as Black (n=68) or Coloured (n=84) presented at the urology clinics at Polokwane (Limpopo Province), Steve Biko (Gauteng Province) or Tygerberg (Western Cape Province) Academic Hospitals. Participants recruited within Limpopo and Gauteng form part of the previously described Southern African Prostate Cancer Study (SAPCS) [4,9] DNA was extracted from whole blood using standard methods (QIAGEN Inc., Germantown, Maryland).
Clinical and pathological presentation
Presence or absence of prostate cancer was provided by clinic-pathological diagnosis. All biopsy cores underwent independent rescoring for the 50 Black cases and 18 Black cancer- free patients as previously described [10] and the 84 Coloured cases (by AvW and WB). HRPCa defined as a GS ≥ 8, was confirmed for 33 Black (66%) and 27 Coloured (32%), or PSA ≥ 20 ng/ml (irrespective of pathological features), was observed for 36 Black (72%) and 39/81 Coloured (48%). LRPCa defined as a GS = 6, was observed for seven Black (14%) and 12 Coloured (14%), or PSA <10 ng/ml for six Black (12%) and 23 Coloured (28%). The remaining patients were classified as presenting with intermediate risk disease.
Genomic data generation
Illumina Infinium HumanCore Beadchip (>250K markers) genotype array data was either made available (68 Black)10 or generated (84 Coloured). Data inclusion was dependant on a GenTrain score (a measure representing the reliability of the genotype calls) of at least 0.5 or more (Illumina GenomeStudio 1.9.4) with further selection of autosomal markers based on a linkage disequilibrium r2 value >0.2 within a 50-variant sliding window, advanced by five variants at a time (SNP and Variation Suite 8.3.1, Golden Helix).
Determining ancestral fractions
Genomic data from population representatives (in brackets) for different African ancestral identifiers were used and defined as: KhoeSan (Ju/’hoan), [7] West African (Mandinka), Proto- Bantu (Yoruba), West Bantu (Bamoun and Fang), and East Bantu (Luhya), [11] while non- African ancestral identifiers included: Asian (Han Chinese) and European (Utah Americans) (Illumina iControl data). African American data (n=48) was sourced from the International Genome Sample Resource. Ancestral fractions were estimated using STRUCTURE 2.3.3 (5000/10000 burn-in iterations, 10000/20000 replicates) assuming different ancestral contributions (≥ five replications) [12].
Statistical analyses
Statistical analyses were performed in R (https: //www.r-project.org) using linear regression (lm) of continuous or categorical data. One-way ANOVA was used for establishing significant disease predictors. Two tailed t-test was used to determine an association between African ancestry and risk extremes, namely HRPCa versus LRPCa. RFMix analysis for local ancestry inference was used to estimate admixture across 22 individual pairs of autosomes [13]. Genotyping data of 84 Coloured patients were removed if unmapped to GRCh37, and phased using SHAPEIT2 with the 1000 Genomes Phase 3 reference panel [14]. RFMix was run with two expectation maximization iterations and 0.2 cM window size and results of each patient along with the population representatives described above were converted to genomic intervals with ancestral identifiers. The intervals where KhoeSan contributions between HRPCa and LRPCa (defined by either GS or PSA) differed greater than three times were compared using Fisher’ exact significance test and then Bonferroni correction (46 and 45 intervals compared based on GS and PSA values, respectively). Significant phased intervals greater than one megabase were chosen for single marker and haplotype block association tests using Haploview (https: //www.broadinstitute.org/haploview/haploview). The RFMix results with posterior probability greater than 0.9 were modelled for migration timing and gene flow estimation using the ancestry tracts analysis (TRACTS) program [15]. The best-fit model assuming KhoeSan, Bantu and Eurasian contributions, was selected based on likelihood values.
Results
Population specific ancestral fractions
STRUCTURE analysis using 10,295 autosomal markers provided detailed population substructure (Figure 1 based on eight reference populations). In contrast to African Americans, the African ancestral contributions to the study participants are almost exclusively Bantu and KhoeSan. While African Americans lack KhoeSan contributions, their African ancestral contribution is largely West African (non-Bantu with a lesser West/Proto-Bantu contribution) and East Bantu, with a significant European-biased non-African contribution.
The Bantu contribution in our study participants can be defined as uniquely Southern Bantu, 69.6% in the Black and 17.1% in the Coloured, with a smaller East Bantu fraction, 14.5% and 9%, respectively. KhoeSan contributions range from minimal up to 20.8% in the Black and as much as 68.1% in the Coloured.
While the Black participants show exclusive African heritage, the Coloured present overall with an almost equal non-African to African fraction. A 9-fold increase in the number of ancestry informative markers through limiting founder population inclusion (91,263 markers), allowed for further separation of the non-African Coloured fractions into European (range 0 to 62.3%) and Asian (range 0. 3 to 42.2%) (Supplementary Figure 1). To better understand the extent of African ancestral contributions in our study participants, we used TRACTS to model their migration history. Consequently, we defined the Coloured as migratory non-African, with significant KhoeSan contributions from 11 (31.5%) to 10 (7.1%) generations ago, followed by Bantu contributions appearing 8 (20.4%) and 7 (11.8%) generations ago (Figure 1). In contrast, the KhoeSan contribution to the Black population appeared as a single pulse migration event roughly 21 generations ago (11.1%; Optimal likelihoods value: -255.7).
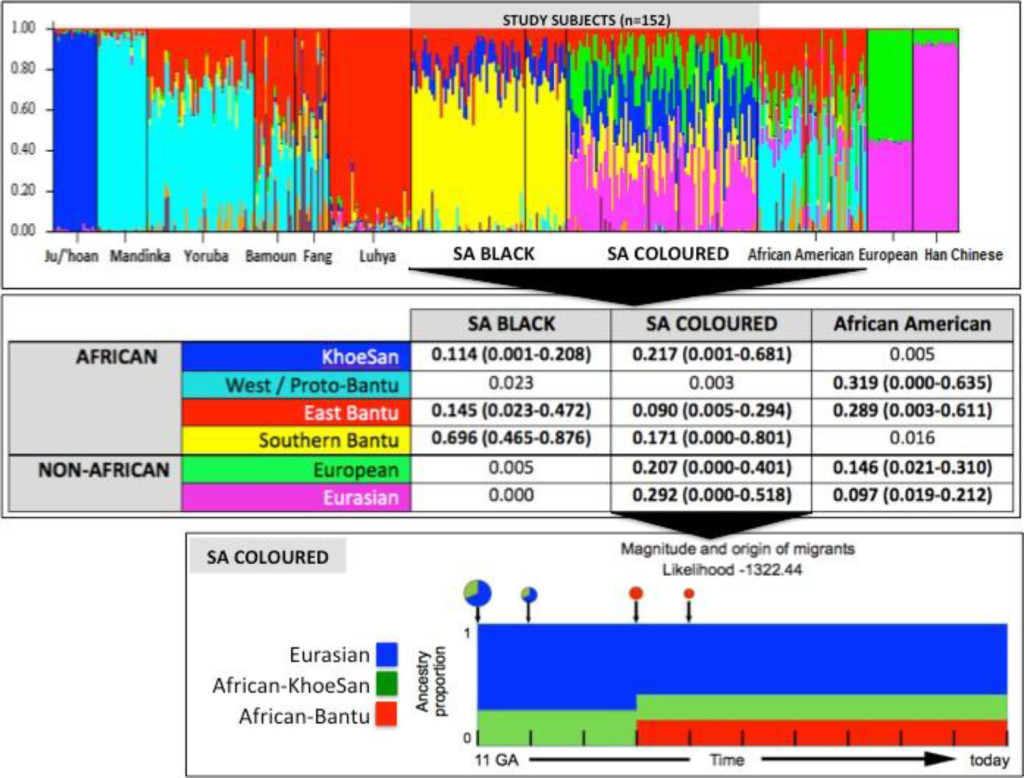
Figure 1. Population substructure of the study participants. (Top Panel) STRUCTURE analysis for 10,295 autosomal markers and eight ancestral populations for the 68 Black (50 cases and 18 controls) and 84 Coloured South African (SA) study participants compared with African Americans and reference populations from Africa (Ju/’hoan, Mandinka, Yoruba, Bamoun, Fang and Luhya) and outside of Africa (European and Han Chinese). (Middle Panel) Using STRUCTURE analysis we determined the African ancestral fractions, defined as KhoeSan, West/Proto-Bantu, East Bantu and Southern Bantu, as well as the non-African ancestral fractions, defined as European and Eurasian, within our study cohort with comparisons made with the African Americans. (Bottom Panel) Magnitude and origin of migrants is shown with different colors in bar and pie charts representing three ancestral contributions. The size of pie charts is proportional to percentage of migrants, with the earliest generation equal to 100% and a decrement in the next generation.
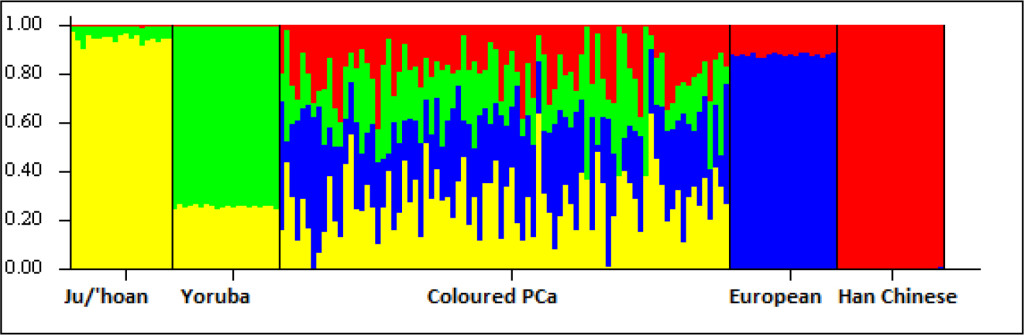
Figure S1. Ancestral fractions determined using STRUCTURE analysis 84 South African Coloured men with PCa using 114,199 autosomal markers and K=4 (5000 burn in and 10000 reps). Ancestral contributions are defined as African-KhoeSan (yellow), African-Bantu (green), European (blue) and Asian (red).
African ancestral fractions linked to HRPCa
Presenting with an almost even distribution of African to non-African heritage, the Coloured provide an ideal genetic resource to further evaluate the African ancestral contribution to HRPCa. We observed a significant association between total African ancestry and prostate cancer pathology. Patients with HRPCa (GS ≥ 8) showed an average of 54.8% African ancestry compared to the 37.3% observed for patients with LRPCa (GS = 6) (t = 2.0974, P– value = 0.0477). Furthermore, we observed a significant KhoeSan over Bantu African contribution to HRPCa, specifically the average KhoeSan contributions to GS ≥ 8 versus 6 tumors was 31% and 20.1%, respectively (t = 2.4491, P-value = 0.0233) and for PSA ≥ 20 versus < 10 ng/ml tumors, 31% and 24.1%, respectively (t=2.1455, P-value = 0.0371).
Although the total KhoeSan contribution to the Black patients was less significant (range 0% to 21%), we did note a slight increase in total KhoeSan ancestral contribution within patients presenting with GS ≥ 8 versus 6 tumors (mean 11.8% vs 10.9%; t = 0.3249, P-value = 0.754).
HRPCa loci enriched for KhoeSan ancestral contribution
Associating excess KhoeSan contribution within HRPCa presentation in the Coloured, we performed a local-ancestry inference analysis for KhoeSan-specific enrichment, using RFMix [13]. The most significant age-adjusted KhoeSan ancestral association with GS ≥ 8 was observed at chromosome 22q13.2 (95 markers; GRCh37 positions 40,178,619–42,552,253; ANOVA P–value = 0.0062) and chromosome 2p11.2 (332 markers; positions 80,741,406- 85,833,046; ANOVA P-value = 0.0083) (Figure 2). While KhoeSan ancestry was also associated with an elevated PSA ≥ 20 ng/ml at 2p11.2 (ANOVA P-value = 0.0004), two additional PSA-HRPCa associated loci were identified, including chromosome 3p14 (127 markers; positions 57,971,523–59,436,405; ANOVA P-value = 0.0026) and 8q23 (79 markers; positions 111,028,667 to 112,656,042; ANOVA P-value = 0.0052). Performing haplotype and single marker association test we identified two markers, rs10103786 and rs4504665, within 8q23 that remained significant after correcting for multiple testing (1,000 permutations; Chi-Square = 15.365 and 11.245; P–value = 0.007 and 0.048, respectively).
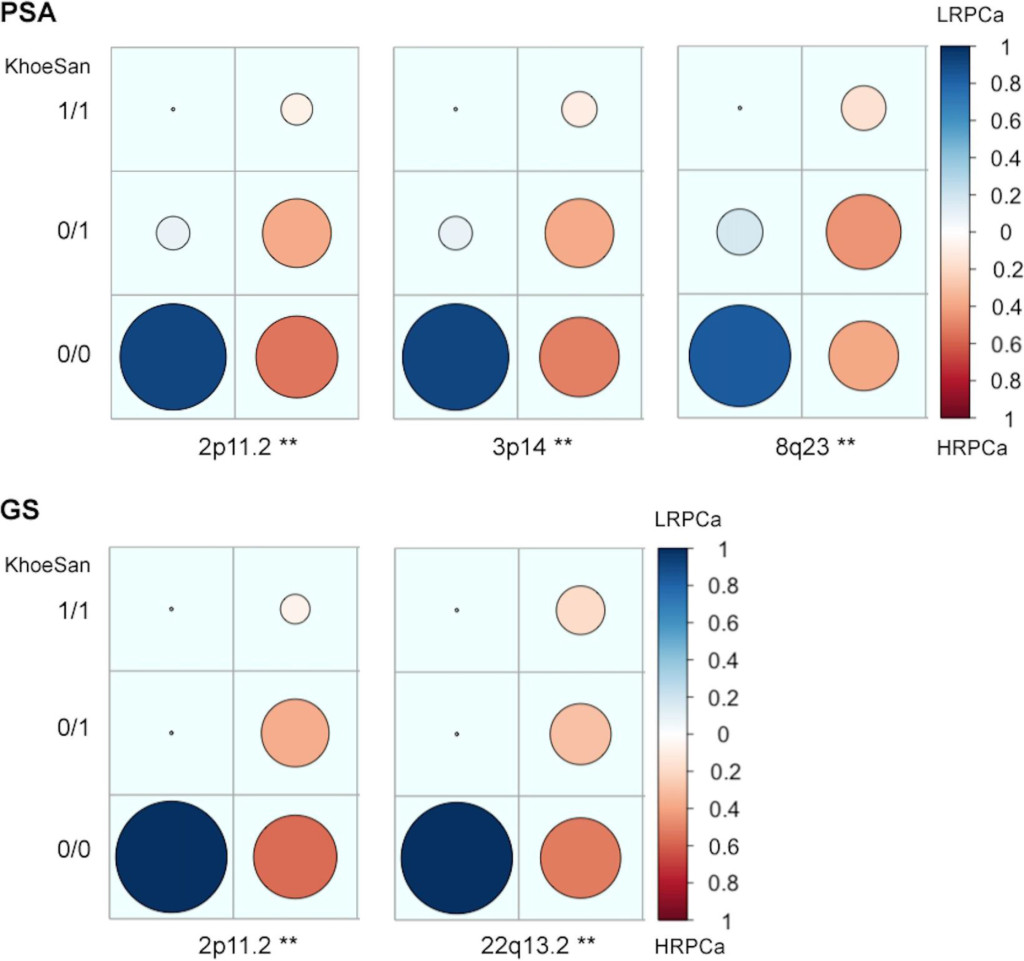
Figure 2. Candidate high-risk prostate cancer (HRPCa) chromosomal regions defined as an over-abundance of KhoeSan heritage. Legends show the proportion of Coloured patients presenting with HRPCa (red) versus low-risk prostate cancer (LRPCa; blue); asterisks (**) indicate regions with age-adjusted P-values < 0.01; 1/1, 0/1 or 0/0 represent the presence of KhoeSan ancestry within both DNA strands, a single strand or none, respectively. The local ancestry is defined using RFMix.
Discussion
We determined the contribution of African ancestral contributions defined as Bantu and KhoeSan to increased HRPCa presentation within South Africa. In contrast to African Americans, Black South Africans present with uniquely Bantu, specifically Southern over West Bantu or West non-Bantu contribution, with a single pulse KhoeSan contribution occurring over 550 years ago. The South African Coloured present, on average, with matched non-African to African genetic contributions. While the non-African fraction includes both European and Asian contributions, the African initiating admixture event predates African American admixture by two generations and includes significant KhoeSan contributions followed to a lesser extent by Bantu contribution. We demonstrate that the South African Coloured represents a unique and alternative resource to African American studies for identifying significant African ancestral contributions to elevated HRPCa.
Confirming an African ancestral link to HRPCa within the Coloured, we showed further that the observed significance appears to be driven largely by a KhoeSan over Bantu contribution. To the best of our knowledge, this is the first reported link between ancient KhoeSan ancestry and prognosis of a common modern condition. It would be reasonable to speculate that prostate cancer risk alleles would not be under negative selection within a hunter-gatherer society with an on average younger overall lifespan. Using KhoeSan ancestry as a surrogate for HRPCa, we identify four chromosomal regions as potential risk loci for aggressive presentation within the region. The 2p11.2 locus, enriched for both GS ≥ 8 and PSA ≥ 20 ng/ml, has previously been associated with PCa risk [16, 17]. A recent study, using capture-based Chromosome Conformation Capture (3C) sequencing, identified a significant physical long-range interaction between common variants within the largely non-coding 2p11.2 region and the candidate tumor suppressor gene CAPG, with expression quantitative trait locus signals at rs1446669, rs699664 and rs1078004 (absent within our array content) [18]. Additionally, the GS-associated 22q13.2 region has previously been associated with HRPCa in a roughly 1,000 strong Swedish genome-wide association study, with independent rs7291691 cross study validation. Located at position 38,778,569, the latter common variant is upstream of the region identified in this study, which may indicate a population specific impact [19]. Notably, the PSA-associated regions, 3p14 and 8q23, are both proximal to known prostate cancer risk loci, including a deletion of the 3p14.1–3p13 region HRPCa [20,21] and the common 8q24 prostate cancer risk loci [18].
In summary, this is the first study to link KhoeSan ancestry to prostate cancer, specifically HRPCa presentation within a uniquely admixed population with African, KhoeSan and Bantu, as well as non-African, European and Asian, ancestries. Using KhoeSan ancestry as a surrogate for HRPCa, we identify potential candidate loci, although one must caution that these regions are only suggestive and require larger study numbers to meet levels of genome-wide significance. However, previously two regions, 2p11 and 22q13 have been suggested as HRPCa risk loci, while two variants at 8q23 remained significant when accounting for multiple testing. Our findings suggest that modern humans earliest ancestors may have been carrying genomic signatures for HRPCa, which would not have been selected against due to later age of onset of prostate cancer.
Acknowledgements
The authors acknowledge the study participants, Sister Heather Money and nursing staff at Western Province Blood Transfusion Service (WPBTS), as well as additional urological members of the South African Prostate Cancer Study (SAPCS), Dr Richard L. Monare and Dr Smit van Zyl.
Contributors
DCP and VMH conceived and designed the study. DCP, PF, AvdM, PAV and MSRB enrolled study subjects and maintained clinical databases. MSRB and VMH direct, manage and fund the SAPCS. VMH sourced funding for genomic analyses. AvdM and MSRB provided clinical revision. AvW and WB performed pathological analyses. DCP and RJL isolated the samples, generated genomic data and provided genetic reports. DCP, WJ, EKFC and VMH performed data analysis and critical interpretation. DCP, WJ and EKFC performed statistical analyses. DCP, WJ and VMH drafted the manuscript. All authors reviewed the manuscript.
Funding
This work was supported by project grants supporting the Southern African Prostate Cancer Study (SAPCS) including: the Cancer Foundation of South Africa (CANSA), the National Research Foundation (NRF) of South Africa, and the Medical Research Council (MRC) of South Africa. Additional support was received from the Australian Prostate Cancer
Research Centre (APCRC) New South Wales (NSW) and by a Perpetual IMPACT grant to the Garvan Foundation, Australia. EFKC and DCP are supported by the Movember Australia and the Prostate Cancer Foundation Australia (PCFA) Prostate Cancer Bone Metastasis (ProMis) Movember Revolutionary Team Award (MRTA), while VMH is supported by the Petre Foundation and University of Sydney Foundation, Australia.
Competing interests: None declared.
Ethics approvals and permits: Participants were recruited and consented according to research ethics approvals granted from the Provincial Government of Limpopo (#32/2008) and the University of Limpopo Medical Research Ethics Committee (#MREC/H/28/2009), the University of Pretoria Human Research Ethics Committee (HREC #43/2010, including US Federal wide assurance FWA00002567 and IRB00002235 IORG0001762), Stellenbosch University HREC (#N08/03/072) or the SANBS HREC (#2012/11). DNA was shipped to Australia under the Republic of South Africa Department of Health Export Permits in accordance with the National Health Act 2003 (J1/2/4/2 #1/10, #1/12 and #3/15) and as per institutional Material Transfer Agreements. Genomic interrogation was performed in accordance with St Vincent’s Hospital (SVH) HREC site-specific approval (#SVH15/227).
References
- Chang AJ, Autio KA, Roach M 3rd, Scher HI (2014) High-risk prostate cancer-classification and therapy. Nat Rev Clin Oncol 11: 308–323. [crossref]
- Chang AJ, Autio KA, Roach M 3rd, Scher HI (2014) High-risk prostate cancer-classification and therapy. Nat Rev Clin Oncol 11: 308–323. [crossref]
- McGinley KF, Tay KJ, Moul JW1 (2016) Prostate cancer in men of African origin. Nat Rev Urol 13: 99–107. [crossref]
- Rebbeck TR, Devesa SS, Chang BL, et al. (2013) Global patterns of prostate cancer incidence, aggressiveness, and mortality in men of african descent. Prostate Cancer 2013: 560857.
- Tindall EA, Monare LR, Petersen DC, van Zyl S, Hardie RA, et al. (2014) Clinical presentation of prostate cancer in black South Africans. Prostate 74: 880–891. [crossref]
- Tan DS, Mok TS2, Rebbeck TR (2016) Cancer Genomics: Diversity and Disparity Across Ethnicity and Geography. J Clin Oncol 34: 91–101. [crossref]
- Heyns CF, Fisher M, Lecuona A, et al. (2011) Prostate cancer among different racial groups in the Western Cape: presenting features and management. S Afr Med J 101: 267–70.
- Petersen DC, Libiger O, Tindall EA, Hardie RA, Hannick LI, et al. (2013) Complex patterns of genomic admixture within southern Africa. PLoS Genet 9: e1003309. [crossref]
- Patterson N, Petersen DC, van-der-Ross RE, et al. (2010) Genetic structure of a unique admixed population: implications for medical research. Hum Mol Genet 19: 411–19.
- Tindall EA, Bornman MS, van-Zyl S, et al. (2013) Addressing the contribution of previously described genetic and epidemiological risk factors associated with increased prostate cancer risk and aggressive disease within men from South Africa. BMC Urol 13: 74.
- McCrow JP, Petersen DC, Louw M, et al. (2016) Spectrum of mitochondrial genomic variation and associated clinical presentation of prostate cancer in South African men. Prostate 76: 349–58.
- Henn BM, Gignoux CR, Jobin M, et al. (2011) Hunter-gatherer genomic diversity suggests a southern African origin for modern humans. Proc Natl Acad Sci U S A 108: 5154–62.
- Pritchard JK, Stephens M, Donnelly P (2000) Inference of population structure using multilocus genotype data. Genetics 155: 945–59.
- Maples BK, Gravel S, Kenny EE, Bustamante CD (2013) RFMix: a discriminative modeling approach for rapid and robust local-ancestry inference. Am J Hum Genet 93: 278–288. [crossref]
- Delaneau O, Marchini J (2014) 1000-Genomes-Project-Consortium. Integrating sequence and array data to create an improved 1000 Genomes Project haplotype reference panel. Nat Commun 5: 3934.
- Gravel S (2012) Population genetics models of local ancestry. Genetics 191: 607–619. [crossref]
- Akamatsu S, Takata R, Haiman CA, Takahashi A, Inoue T, et al. (2012) Common variants at 11q12, 10q26 and 3p11.2 are associated with prostate cancer susceptibility in Japanese. Nat Genet 44: 426–429, S1. [crossref]
- Kote-Jarai Z, Olama AA, Giles GG, et al. (2011) Seven prostate cancer susceptibility loci identified by a multi-stage genome-wide association study. Nat Genet 43: 785- 91.
- Du M, Tillmans L, Gao J, Gao P, Yuan T, et al. (2016) Chromatin interactions and candidate genes at ten prostate cancer risk loci. Sci Rep 6: 23202. [crossref]
- Sun J, Zheng SL, Wiklund F, Isaacs SD, Li G, et al. (2009) Sequence variants at 22q13 are associated with prostate cancer risk. Cancer Res 69: 10–15. [crossref]
- Feik E, Schweifer N, Baierl A, et al. (2013) Integrative analysis of prostate cancer aggressiveness. Prostate 73: 1413–26.