Abstract
Background: Disturbance of sodium and potassium chemistry is commonly present during an emergency medical admission; we analyse the interaction of these ions and relate K+/ Na+ Ratios to hospital mortality outcomes.
Methods: All emergency medical admissions between 2002 and 2017 were studied. We log transformed sodium and potassium values and calculated their respective ratios as a predictor of 30-day mortality outcomes using a multivariable logistic model.
Results: There were 106,586 admissions in 54,928 patients. Patients with higher K+/ Na+ ratios at admission were older at 66.5 years (IQR 47.0–79.3) compared with 59.0 years (IQR 39.9–75.5) and more likely to be female (51.9% vs. 45.5%). They had a higher 30-day hospital mortality rate – 5.4% vs 3.5% (p<0.001). Across consecutive deciles of K+, rising admission levels linearly predicted outcomes unlike Na+ where falling levels linearly predicted an increased mortality. Disturbed K+/ Na+ balance (log ratio) was prognostic – 30-day mortality OR 1.12 (95%CI 1.11–1.13). Increasing age predicted an increased likelihood of an abnormal K+/ Na+ balance.
Conclusion: Disturbed K+/ Na+ is linearly predictive of 30-day hospital mortality and is strongly age associated; possibly it is a consequence of Na+ leaving the extracellular space (ECF) and K+ transit to the ECF due to impaired cellular membrane homeostatic function.
Keywords
Emergency Medical Admission, Potassium Sodium Balance
Introduction
An emergency hospital admission with an urgent clinical condition requiring immediate or specialist management 1] is a high risk period but has shown improved outcomes over time 2,3] particularly since the establishment of Acute Medical Admission Units [4,5]. Risk management of critical admissions requires reliable predictors and there has been debate regarding disturbance of sodium [6–10] and potassium homeostasis [11,12] in this regard.
In terms of sodium levels, abnormalities in the laboratory range are said to occur in about 15% of hospitalized patients [7]; a U-shaped curve is described with major morbidity and mortality at the extremes of the sodium distribution in many patient groups including general internal medicine patients (13–15). Hyponatraemia in particular is prognostic for specific groups of patients with cardiovascular disease, such as congestive heart failure [16,17] but also for patients with pulmonary hypertension [18]. In terms of potassium levels, a U-shaped curve for mortality is also described with lowest all-cause mortality for potassium values between 4.0 and <5.0 mEq/L. [19]; in a geographically diverse population (n = 911,698) 27.6% had a potassium <4.0 mEq/L, and 5.7% had a value ≥ 5.0 mEq/L. A further commentary on two large studies, of the relationship between cardiovascular outcomes and potassium levels, noted that there were not a significant association between hypokalaemia and mortality in the fully adjusted Cox model, but there was a trend toward higher mortality at lower serum potassium [20].
The problem with such analyses is that the conclusions drawn will not be identical if based on a unit versus a frequency based analysis. The unit based analysis (by K+ / Na+ interval) is unintentionally biased as some intervals may contain small numbers who are actually outliers in the distributions; the results in generalisation from the specific to the general population. However, a decile based analysis for sodium, indicated that, for emergency medical admissions, the highest quantile (decile) had the lowest mortality risk and that mortality progressively increased over every other decile [21]. As a generality, the same applies to potassium except that rising deciles determine worse outcomes. The exception, dictating bad outcomes for a few, should not confuse an overall understanding of the mortality relationship to the admission levels of sodium and potassium. We have previously shown that mortality is far more influenced by other factors such as the Acuity Illness Severity Score (AISS) [22,23], sepsis status [24] and the overall burden of disease as reflected by summative comorbidities – Charlson Comorbidity Index [25] or Chronic Disabling Disease Score [26]. In this paper we consider the relevance of the balance between potassium and sodium, at time of an emergency medical admission, in determining 30-day mortality in over 100,000 emergency medical admissions and draw inferences from these findings.
Methods
Background
St James’s Hospital, Dublin serves as a secondary care centre for emergency admissions in a catchment area with a population of 270,000 adults. All emergency medical admissions were admitted from the Emergency Department to an AMAU, the operation and outcome of which have been described elsewhere [2,3,27,28]. As a city centre hospital St James’s admits persons resident elsewhere but working in the capital in addition to visitors to Dublin who became acutely ill. The number of emergency medical admissions resident in the catchment area was 74.5%; this compares with a figure of 59% for ED presentations where the social influences on emergency department visitations on two London hospitals have been examined [29].
Data Collection
During any emergency hospital admission information on the clinical episode is entered into the Patient Administration System (PAS), admission metrics are determined and entered into the emergency room database and following admission data is recorded on the patient electronic record, different laboratory systems; abstracted data is subsequently processed by dedicated staff for downloading to the National Hospital In-Patient Enquiry (HIPE) scheme. HIPE is a national database of coded discharge summaries from acute public hospitals in Ireland [30,31]. International Classification of Diseases, Ninth Revision, Clinical Modification (ICD-9-CM) has been used for both diagnosis and procedure coding from 1990 to 2005 with ICD-10-CM used since then. Data included parameters such as the unique hospital number, admitting consultant, date of birth, gender, area of residence, principal and up to nine additional secondary diagnoses, principal and up to nine additional secondary procedures, and admission and discharge dates. We in 2002 designed programs to extract the HIPE data and admission biochemistry and haematological variables (linked via the Medical Record Number) to monitor the performance of the Acute Medical Admission Unit. These data were then anonymized using an ID sequence and the MRN to link the data that is held on our system in multiple separate files. These files are assembled into memory at time of statistical analysis (using Stata coding). The data does not exist as a discrete database; it is updated annually and is a closed system accessible only by the Principal Investigators. GDPR does not apply to anonymous datasets.
Acute Illness Severity Score
Derangement of biochemical parameters may be utilised to predict clinical outcome. We derived an AISS based on laboratory data – this is an age adjusted 30-day in-hospital mortality risk estimator, representing an aggregrate laboratory score based on the admission serum sodium, serum potassium, serum urea, red cell distribution width, white blood cell count, serum albumin and troponin values at admission (23, 32); the score predicts 30-day in-hospital mortality from the biochemical parameters recorded in the Emergency Department (33). The AISS can be enhanced with data from the ICD9/10 discharge codes to compute Co-Morbidity (as per the Charlson Index (25)) or Disability (26) status. This Risk Score is exponentially related to the 30-day mortality outcome with a range of mortality outcomes from 0.5% (0.40%–0.53%) to 39% (37.8%-40.2%). We have demonstrated using a nomogram that this laboratory model derives most of its predictive power from the admission values of albumin, urea and haemoglobin (34).
Comorbidity Instrument
Hospital HIPE codes [30,31] were interrogated to construct a measure of multi-morbidity. To devise the score, we searched ICD9 hospital episode discharge codes (back-mapping ICD10 codes to ICD9 as appropriate) based on the definition proposed by the US Department of Health and Human Services for chronic physical or mental health disorders, that limit people ‘in activities that they generally would be expected to be able to perform’. These ICD codes were similar to those proposed by the Canadian group for multi-morbidity (35) and the work of Quan [36,37]; they were grouped by system into the following ten groups: (i) cardiovascular, (ii) respiratory, (iii) neurological, (iv) gastrointestinal, (v) diabetes, (vi) renal, (vii) neoplastic disease, (viii) others (including rheumatological disabilities), (ix) ventilatory assistance required and (x) transfusion requirement. We have previously detailed the ICD9 codes for chronic physical or mental health disorders utilized as a supplementary Table [38]. In addition, we searched other hospital databases for evidence of diabetes (Diamond database), respiratory insufficiency (FEV1 < 2 L data pulmonary function laboratory), troponin status (high sensitivity troponin > 25 ng/L) [33], low albumin (<35 G/dL) and anaemia (haemoglobulin levels < 10 G/dL) or chronic renal insufficiency – MDRD < 60 mL/min*1.73 m2 [39]. The ‘morbidity score’ for each individual’s clinical episode during the study, was weighted by its relative important against the 30-day mortality outcome in the multivariable regression analysis.
Statistical Methods
Descriptive statistics were calculated for background demographic data, including means/standard deviations (SD), medians/interquartile ranges (IQR), or percentages. Comparisons between categorical variables and mortality were made using chi-square tests.
We employed a logistic model with robust estimate to allow for repeated admissions; the correlation matrix thereby reflected the average dependence among the specified correlated observations [23]. Logistic regression analysis identified potential mortality predictors and then tested those that proved to be significant univariate predictors (p<0.01 by Wald test). Mortality results have been presented either by admission (all admissions counted) or by patient (only one admission considered – last admission if > one). In an extended time series (16 yr.), 48.7% of patients were readmitted at least once, 9.3% > 5 times and 20 patients > 50 times each; whether per admission or per patient mortality analysis is optimal is uncertain. We used the margins command in Stata to estimate and interpret adjusted predictions for sub-groups, while controlling for other variables such as time, using computations of average marginal effects. Margins are statistics calculated from predictions of a previously fitted model at fixed values of some covariates and averaging or otherwise over the remaining covariates. In the multivariable model (logistic), we adjusted univariate estimates of effect, using the previously described outcome predictor variables. The model parameters were stored; post-estimation intra-model and cross-model hypotheses could thereby be tested.
Adjusted odds ratios (OR) and 95% Confidence Intervals (CI) were calculated for those predictors that significantly entered the model (p<0.10). Statistical significance at P<0.05 was assumed throughout. Stata v.15 (Stata Corporation, College Station, Texas) statistical software was used for analysis. This study had no interventional component, used anonymised routinely collected data, complied with data protection legislation and was undertaken as part of the Hospital Quality Improvement Programme to assess the overall impact of the Acute Medical Admission Initiative.
Results
Patient Demographics
During the 16-year study period (2002–2017), there were a total of 106,586 admissions in 54,928 unique patients. This represented all emergency medical admissions, including patients admitted directly into the Intensive Care Unit or High Dependency Unit. The proportion of males was 48.5%. The median (IQR) Length Of Stay (LOS) was 4.3 days (1.7–8.9). The median (IQR) age was 58.9 years (38.2–76.3) with the upper 10% boundary at 85.0 years.
The demographic characteristics (Table 1) are outlined with a cut at the midpoint of the calculated admission K+ / Na+ ratio. The K+ and Na+ data was log (natural) transformed prior to the analysis mainly to equalize the data spread of the two elements despite their numerical difference – anticipated to make the data easier to handle and interpret. Above and below that midpoint, the patient group characteristics are tabulated by Acute Illness Severity [23,32], Charlson Index [25], Co-Morbidity and Sepsis status [24]. Patient in the upper half of the K+ / Na+ ratio distribution were older 66.5 years (IQR 47.0–79.3) compared with 59.0 years (IQR 39.9–75.5) but had equivalent hospital LOS – 4.9 days (IQR 1.9–9.7) versus 5.1 days (IQR 2.3–9.7). Admissions with a K+ / Na+ ratio distribution above the median were more likely to be female (51.9% vs. 45.5%) and had a higher 30-day hospital mortality rate – 5.4% vs 3.5% (p<0.001). Those with a K+ / Na+ ratio distribution above the median had a higher Acute Illness Severity Score (top two groups 66.1% vs. 53.4%) and higher Charlson Comorbidity Index (top two groups 39.6% vs. 33.0%).
Mortality related to admission K+ / Na+ levels
The 30-day per patient mortality declined between 2002 and 2017 from 12.4% to 4.8%. This represented a relative risk reduction (RRR) of 61.3% with a number needed to treat (NNT) of 13.1. Lower admission sodium levels were associated with a linear increase in patient mortality rate across all deciles (OR 0.89 (95% CI 0.88–0.90); from decile 1 (lowest sodium) – 16.9% (95% CI 16.0%-17.8%) to decile 5 – 11.4% (95% CI 11.0%-11.8%) and decile 10 – 6.7% (95% CI 6.2%-7.2%). Higher admission potassium level predicted mortality – OR 1.07 (95%CI: 1.06, 1.09) and there was a progressive increase in 30-day in-hospital mortality across all deciles from decile 1 (lowest) – 8.9% (95%CI: 8.3%, 9.4%) to decile 5 – 11.0% (95%CI: 10.6%, 11.3%) and decile 10 – 14.2% (95%CI: 13.5%, 14.8%). This is a different interpretation to the conventional wisdom of a U shaped curve for both K+ and Na+ and mortality outcomes. However, an analysis by decile lacks numerical bias where very difference frequencies fall within discrete ranges. For Na+ for example, and taking decile 10 with the lowest overall mortality risk, the lower boundary is 142 mEq/l, with the median, 75% and 95% points at 144, 145 and 150 mEq/l. For K+ for example, and taking decile 1 with the lowest overall mortality risk, the upper boundary is 3.4 mEq/l, with the median, 75% and 95% points at 3.2, 3.0 and 2.6 mEq/l. Therefore the correct distribution mortality relationship is that 30-day mortality outcome, as determined by K+ and Na+ admission values, is that mortality increases with each decile of K+ decile, from lowest to highest with the opposite being true for admission Na+ levels.
Table 1. Characteristics of Emergency Admissions by Median K+ / Na+ Ratio.
|
Lower |
Upper |
p-Value |
|
|
Age (yr.) |
|||
|
Mean (SD) |
57.4 (20.78) |
62.5 (20.29) |
<0.001 |
|
Median (Q1, Q3) |
59.0 (39.9, 75.5) |
66.5 (47.0, 79.3) |
|
|
Length Stay (day) |
|||
|
Mean (SD) |
7.2 (6.45) |
7.0 (6.51) |
<0.001 |
|
Median (Q1, Q3) |
5.1 (2.3, 9.7) |
4.9 (1.9, 9.7) |
|
|
Gender |
|||
|
Male |
20530 (45.5%) |
26321 (51.9%) |
<0.001 |
|
Female |
24605 (54.5%) |
24405 (48.1%) |
|
|
30-day Hospital Mortality |
|||
|
Alive |
43542 (96.5%) |
48000 (94.6%) |
<0.001 |
|
Dead |
1593 (3.5%) |
2726 (5.4%) |
|
|
Acute Illness Severity |
|||
|
1 |
1835 (4.3%) |
1094 (2.5%) |
<0.001 |
|
2 |
3916 (9.2%) |
2595 (5.8%) |
|
|
3 |
6234 (14.7%) |
4630 (10.4%) |
|
|
4 |
7768 (18.3%) |
6773 (15.2%) |
|
|
5 |
8638 (20.3%) |
8329 (18.7%) |
|
|
6 |
14072 (33.1%) |
21064 (47.4%) |
|
|
Co-Morbidity Score |
|||
|
< 6 |
11387 (38.3%) |
11247 (32.4%) |
<0.001 |
|
>=6 < 8 |
8547 (28.7%) |
9744 (28.0%) |
|
|
>=8 < 12 |
8181 (27.5%) |
11098 (31.9%) |
|
|
>=12 < 20 |
1643 (5.5%) |
2674 (7.7%) |
|
|
Charlson Index |
8638 (20.3%) |
8330 (18.7%) |
|
|
0 |
22226 (49.3%) |
21771 (43.0%) |
<0.001 |
|
1 |
12063 (26.8%) |
13830 (27.3%) |
|
|
2 |
10768 (23.9%) |
15042 (29.7%) |
|
|
Sepsis Group |
|||
|
1 |
33695 (74.7%) |
39653 (78.2%) |
<0.001 |
|
2 |
9828 (21.8%) |
9426 (18.6%) |
|
|
3 |
1612 (3.6%) |
1647 (3.2%) |
|
*LOS: length of stay, MDC: Major Disease Category, IQR: Inter-Quartile Range
Mortality related to admission K+ / Na+ Ratio (Figs 1 / 2)
The admission K+ / Na+ Ratio was predictive of episode 30-day hospital mortality – OR 1.12 (95% CI 1.11–1.13). This compared with the predictive capacity of the Acute Illness Severity Score of OR 3.28 (95% CI 3.03–3.56) , the Charlson Comorbidity Index of OR 1.20 (95% CI 1.18–1.23) and sepsis status OR 1.61 (95% CI 1.51–1.71). The admission K+ / Na+ Ratio was a linear predictor (Fig 1) of 30-day hospital mortality over the range of deciles from the lowest D1 with predicted mortality of 5.6% (95% CI: 5.2%, 5.9%), to D5 6.2% (95% CI: 6.0%, 6.4%) and D10 7.2% (95% CI: 6.9%, 7.5%), After adjustment for the above predictors, the predictive value of K+ / Na+ Ratio was reduced to 1.03 (95% CI 1.02–1.04).
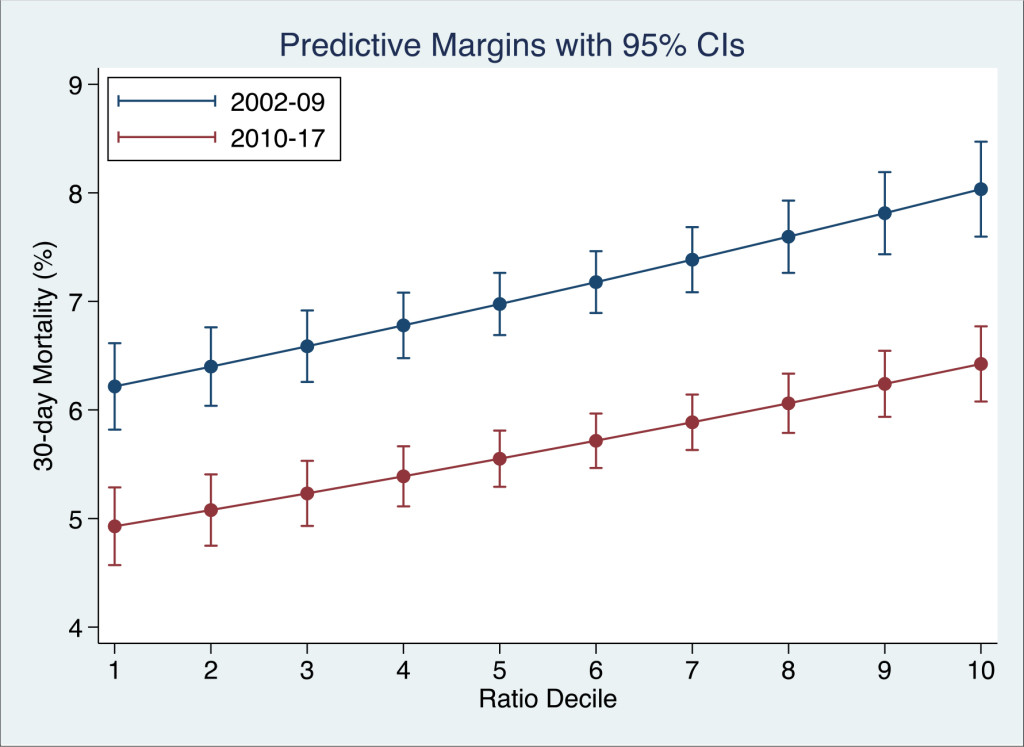
Figure 1. The relationship between the admission K+ / Na+ ratio and 30-day in-hospital mortality. For each decile of the ratio, the 30-day in-hospital mortality rate was derived from the logistic regression model and adjusted for the Charlson Co-Morbidity, Co-Morbidity and Sepsis Scores.
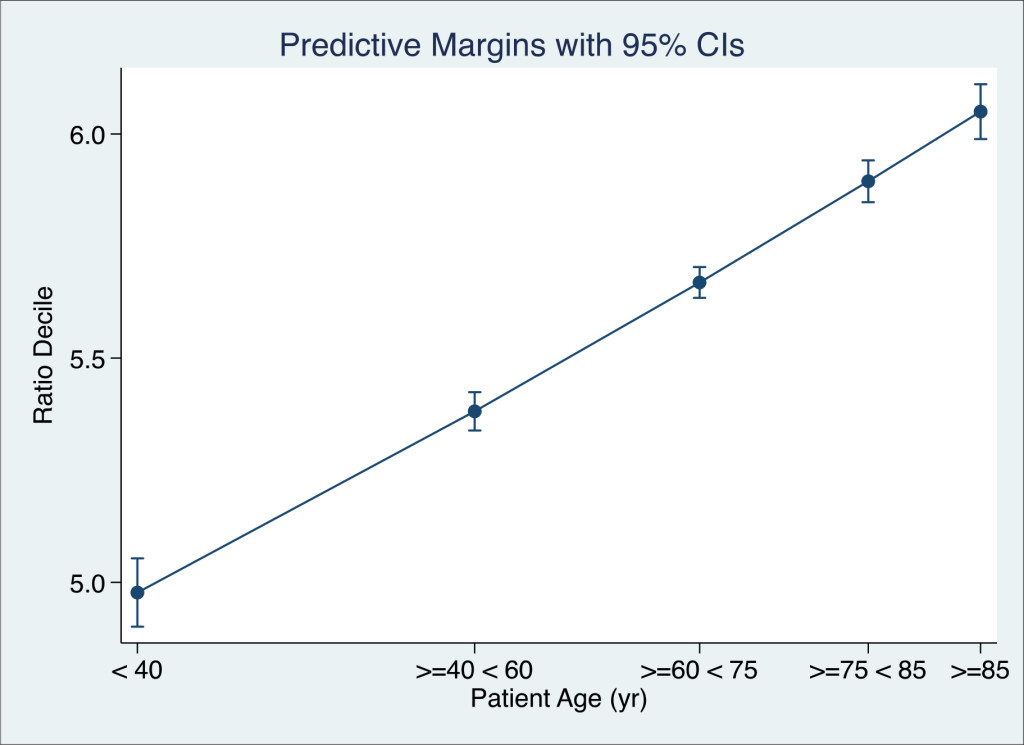
Figure 2. The relationship between the admission K+ / Na+ ratio and patient age. The Decile of the Ratio, at time of admission, was regressed against the age group (Zero Poisson truncated) and adjusted for the Acute Illness Severity and Co-Morbidity and Sepsis Status. The Decile of K+ / Na+ ratio at time of admission was a linear function of age.
We also examined the likelihood that the admitted K+ / Na+ Ratio was age related – over the admitted age range by relating the likelihood that older admissions would fall into higher K+ / Na+ Decile Ratios. We regressed the age groups < 40, 40 + – 60, 60+ – 75, 75+ – 85 and >85 against counts of K+ / Na+ Ratio (zero truncated Poisson regression) by patient and adjusted for the Acute Illness Severity (22, 23), Charlson Comorbidty Index (25) and Sepsis Status (24). There was a linear relationship between the underlying age and the likelihood of being in a higher K+ / Na+ Decile Ratio.
Discussion
Our data shows that over a period of 16 years potassium and sodium levels at the time of an emergency medical admission were predictive of 30-day mortality outcomes. Although the mortality outcomes have improved over time, the predictive value consistent irrespective of such quality improvements. Falling deciles of sodium were associated with increasing mortality outcomes; the 30-day patient mortality comparing the highest and lowest decile was 6.7% vs 16.9%. For potassium the opposite was true; rising deciles were associated with increasing mortality from lowest decile rate of 8.9% to highest rate of 14.2%. Therefore in overall terms neither hypokalaemia nor hypernatraemia were prognostic risk factors of a 30-day hospital death. That is not to argue that specific patients with very disturbed admission hypokalaemia or hypernatraemia were not at risk. However, for high sodium levels (top decile > 142 mEq/l) only 25% of that decile were > 145 mEq/l. and 5% > 150 mEq/l. For the lowest potassium decile (<3.4 mEq/l), only 25% of that decile were < 3.0 mEq/l. and only 5% < 2.6 mEq/l. Thus taking what might occur in a small minority of any population distribution, and seeking to make statements regarding the overall population risk is an approach that may result in a misconceived view of the risk reality in the mind of the clinician.
If increasing potassium or decreasing admission levels are linearly prognostic, as our model relating deciles of each to 30-day mortality outcome, then a reasonable presumption might be that the disturbance in both would be linked. Sodium being the principal extracellular ion and potassium being intracellular might leak from their respective domains as the system aged; disorder of the pair might be thought of as reflecting impaired membrane function and the energetic process involved in maintaining the transmembrane electro-chemical gradient. The likelihood of being in a higher risk decile certain was strongly age dependent in our analysis. We wondered if the relationship of the two ions, as reflected in the K+ / Na+ Ratio, might be a better prognostic indicator that their individual ability to predict mortality outcome. The univariate prediction of the K+ / Na+ Ratio was considerably attenuated when other independent outcome predictors such as Acute Illness Severity Score, Charlson Comorbidity Index and sepsis status were accounted for in the multivariable model. This would suggest that in overall terms, disorders of these ions, whilst of clinical relevance in certain specific patient subsets, in general are part of more complex disorder of homeostasis, driven by illness severity and the overall burden of disease [40,41]. As linking the analysis to the combined behaviour, with the K+ / Na+ Ratio, did not improve the prognostic prediction over that from independent analysis of each, one cannot assume that the behaviour of the K+ and Na+ is linked in emergency medical admissions on average.
Of course, the practicing physician is rightly focused on clinical outcomes at the extremes of distribution due to the high mortality rates [42] and the need for urgent interventions to correct the disorder and mitigate the consequences [43]. Generally speaking disturbed biochemistry has been recognised to predict hospital mortality outcomes and been incorporated into laboratory score systems [44–46]. We must however distinguish a population based interpretation of the risk relating a predictor variable that is disturbed to mortality outcomes in general from that at the extremes of population or in certain specific high-risk subgroups, and as to whether patients die with or as a consequence of hyponatraemia [47] or if most deaths are caused by underlying diseases [42]. The widely quoted work of Gheorghiade et al. demonstrated a marked correlation between serum sodium < 135 mEq/l and both hospital LOS and mortality and an apparent “U shaped’ curve with increased mortality if serum sodium was greater than 140 mEq/l [16]. However, a recent large meta-analysis on dysnatraemia concluded that hyponatremia (HR 1.34; 95% CI: 1.15–1.57) but not hypernatremia (HR 1.12; 95%: CI 0.93–1.34), was independently associated with increased risk of all-cause mortality, when compared than the normonatremia category [48].
In respect of potassium levels and mortality outcomes, in 6515 patients prior to randomization in the MERLIN-TIMI trial, the lowest risk of cardiovascular death was observed in patients with admission potassium levels between 3.5 and 4.5 mEq/L. Both lower and higher levels of potassium were associated with tachyarrhythmias and bradyarrhythmias, suggesting a potential mechanistic explanation for the increased risk of cardiovascular death at the extremes of potassium homeostasis [49]. Krogager et al. [50] reported, in a cohort of nearly 2600 patients post myocardial infarction, a U-shaped relationship between serum potassium concentration on hospitalization and 90-day mortality; these observations of increased mortality also applied to low and high normal serum potassium levels. Hughes-Austin et al. [51] found that high serum potassium concentration is significantly associated with a higher risk for all-cause mortality independent of kidney function or other cardiovascular disease risk factors; no significant association between hypokalaemia and mortality was found in the fully adjusted Cox model. We found that from lower to higher deciles of potassium a progressively rising risk of an adverse mortality outcome. Similarly, Loprinzi and Hall [12] investigated the potassium-mortality relationship in the general population of the United States, using data from the 1999–2006 National Health and Nutrition Examination Survey were employed, with follow-up through 2011. In a Cox proportional hazards model, after adjusting for confounding variables found that a 1-mmol/L increase in potassium was associated with a 40% increased risk of mortality (adjusted hazard ratio 1.40; 95% CI, 1.15–1.70).
Broadly speaking then we would conclude, that in an unselected population admitted with medical emergencies over 16 years that although disturbances of potassium or sodium were predictive of 30-day mortality outcomes in general, the lowest decile of admission potassium or the highest decile of sodium conferred the lowest risk, when adjusted for other major independent outcome predictors. Over all deciles of admitted potassium, rising levels were positive associated with increased mortality; the contrary applied to sodium where the greatest risk was for the lowest admitted levels, and all higher deciles demonstrated a falling mortality trend. Furthermore, although both rising potassium levels and falling sodium levels were independently predictive, in the full model with adjustment as described, the influence of each of the combined ratio was attenuated This implies that disorders of potassium and sodium and their ratio is a secondary phenomenon, reflecting system disorder and a ‘sick cell’ or unbalanced homeostasis due to major illness associated with comorbidity.
Our study utilises comprehensive data gathered over a prolonged period of time, however this information is in essence extracted from the medical record through coding and other standard procedures; therefore the robustness of our data is entirely dependent on the accuracy of the original recordings. The external validity of our results will need to be established by complementary studies in other institutions and settings. We do not collect information on the specific treatment of individual patients, therefore we were not able to analyse any potential effects of interventions in those with abnormalities of potassium or sodium. Finally, the design of our study by its nature assesses for associations rather than causation, while we adjust for multiple variables in our analyses we cannot comment on any potential causative role for electrolyte imbalance on mortality.
In conclusion this study demonstrates that the ratio of admission serum potassium to sodium is both strongly associated with age and linearly predictive of 30-day hospital mortality. The interpretation of sodium and potassium homeostasis as an interdependent ratio did not add significant material value to analysing the cations independently.
References
- Langlands A, Dowdle R, Elliott A, Gaddie J, Graham A, Johnson G, et al. (2009) RCPE UK Consensus Statement on Acute Medicine, November 2008. British journal of hospital medicine 70: 6–7.
- Rooney T, Moloney ED, Bennett K, O’Riordan D, Silke B (2008) Impact of an acute medical admission unit on hospital mortality: a 5-year prospective study. Qjm 101: 457–65.
- Conway R, O’Riordan D, Silke B (2014) Long-term outcome of an AMAU–a decade’s experience. QJM 107: 43–49. [crossref]
- Byrne D, Silke B (2011) Acute medical units: review of evidence. Eur J Intern Med 22: 344–347. [crossref]
- Scott I, Vaughan L, Bell D (2009) Effectiveness of acute medical units in hospitals: a systematic review. Int J Qual Health Care 21: 397–407. [crossref]
- Whelan B, Bennett K, O’Riordan D, Silke B (2009) Serum sodium as a risk factor for in-hospital mortality in acute unselected general medical patients. QJM 102: 175–82.
- Asadollahi K, Beeching N, Gill G (2006) Hyponatraemia as a risk factor for hospital mortality. QJM 99: 877–880. [crossref]
- Stachon A, Segbers E, Hering S, Kempf R, Holland-Letz T, et al. (2008) A laboratory-based risk score for medical intensive care patients. Clin Chem Lab Med 46: 855–862. [crossref]
- Waikar SS, Mount DB, Curhan GC (2009) Mortality after hospitalization with mild, moderate, and severe hyponatremia. Am J Med 122: 857–865. [crossref]
- Conway R, Byrne D, O’Riordan D, Silke B (2014) Hyponatraemia in Emergency Medical Admissions-Outcomes and Costs. Journal of clinical medicine 3: 1220–1233.
- Conway R, Creagh D, Byrne DG, O’Riordan D, Silke B (2015) Serum potassium levels as an outcome determinant in acute medical admissions. Clinical medicine (London, England) 15: 239–243.
- Loprinzi PD, Hall ME (2017) Effect of Serum Potassium on All-Cause Mortality in the General US Population. Mayo Clin Proc 92: 320. [crossref]
- Nardi R, Fiorino S, Borioni D, Agostini D, D’Anastasio C, et al. (2007) Comprehensive complexity assessment as a key tool for the prediction of in-hospital mortality in heart failure of aged patients admitted to internal medicine wards. Arch Gerontol Geriatr 44 Suppl 1: 279–288.
- Wartenberg KE, Schmidt JM, Claassen J, Temes RE, Frontera JA, et al. (2006) Impact of medical complications on outcome after subarachnoid hemorrhage. Crit Care Med 34: 617–623.
- Kraft MD, Btaiche IF, Sacks GS, Kudsk KA (2005) Treatment of electrolyte disorders in adult patients in the intensive care unit. Am J Health Syst Pharm 62: 1663–1682. [crossref]
- Gheorghiade M, Abraham WT, Albert NM, Gattis Stough W, Greenberg BH, et al. (2007) Relationship between admission serum sodium concentration and clinical outcomes in patients hospitalized for heart failure: an analysis from the OPTIMIZE-HF registry. Eur Heart J 28: 980–988.
- Mohammed AA, Kimmenade RRJv, Richards M, Bayes-Genis A, Pinto Y, et al. (2010) Hyponatremia, natriuretic peptides, and outcomes in acutely decompensated heart failure: results from the International Collaborative of NT-proBNP Study. Circ Heart Fail 3: 354–3561.
- Forfia PR, Mathai SC, Fisher MR, Housten-Harris T, Hemnes AR, et al. (2008) Hyponatremia Predicts Right Heart Failure and Poor Survival in Pulmonary Arterial Hypertension. Am J Respir Crit Care Med 177: 1364–1369.
- Collins AJ, Pitt B Fau-Reaven N, Reaven N Fau-Funk S, Funk S Fau-McGaughey K, McGaughey K Fau – Wilson D, et al. (2017) Association of Serum Potassium with All-Cause Mortality in Patients with and without Heart Failure, Chronic Kidney Disease, and/or Diabetes. Am J Nephrol 46: 213–221
- Toto RD (2017) Serum Potassium and Cardiovascular Outcomes: The Highs and the Lows. CJASN 12: 220–221.
- McCarthy K, Conway R, Byrne D, Cournane S, Deirdre OR, et al. (2018) Hyponatraemia during an emergency medical admission as a marker of illness severity & case complexity. Eur J Intern Med (in press).
- Royston P, Reitz M, Atzpodien J (2006) An approach to estimating prognosis using fractional polynomials in metastatic renal carcinoma. Br J Cancer 94: 1785–1788.
- Silke B, Kellett J, Rooney T, Bennett K, O’Riordan D (2010) An improved medical admissions risk system using multivariable fractional polynomial logistic regression modelling. Quarterly Journal of Medicine 103: 23–32.
- Chotirmall SH, Callaly E, Lyons J, O’Connell B, Kelleher M, et al. (2014) Blood cultures in emergency medical admissions: a key patient cohort. Eur J Emerg Med
- Charlson ME, Pompei P, Ales KL, MacKenzie CR (1987) A new method of classifying prognostic comorbidity in longitudinal studies: development and validation. J Chronic Dis 40: 373–383. [crossref]
- Chotirmall SH, Picardo S, Lyons J, D’Alton M, O’Riordan D, et al. (2014) Disabling disease codes predict worse outcomes for acute medical admissions. Intern Med J 44: 546–553.
- Coary R, Byrne D, O’Riordan D, Conway R, Cournane S, Silke B (2014) Does admission via an acute medical unit influence hospital mortality? 12 years’ experience in a large Dublin hospital. Acute medicine 13: 152–158.
- Conway R, Byrne D, Cournane S, O’Riordan D, Silke B (2018) Fifteen-year outcomes of an acute medical admission unit. Ir J Med Sci 187: 1097–1105. [crossref]
- Beeknoo N, Jones R (2016) Factors Influencing A & E Attendance, Admissions and Waiting Times at Two London Hospitals. British Journal of Medicine & Medical Research 17: 1–29.
- O’Loughlin R, Allwright S, Barry J, Kelly A, Teljeur C (2005) Using HIPE data as a research and planning tool: limitations and opportunities. Ir J Med Sci 174: 40–45. [crossref]
- O’Callaghan A, Colgan MP, McGuigan C, Smyth F, Haider N, et al. (2012) A critical evaluation of HIPE data. Ir Med J 105: 21–23. [crossref]
- O’Sullivan E, Callely E, O’Riordan D, Bennett K, Silke B (2012) Predicting outcomes in emergency medical admissions – role of laboratory data and co-morbidity. Acute medicine 2: 59–65.
- Courtney D, Conway R, Kavanagh J, O’Riordan D, Silke B (2014) High-sensitivity troponin as an outcome predictor in acute medical admissions. Postgrad Med J 2014: 1–7.
- Cournane S, Conway R, Byrne D, O'Riordan D, Silke B (2017) Predicting Outcomes in Emergency Medical Admissions Using a Laboratory Only Nomogram. Computational and Mathematical Methods in Medicine 2017: 1–8.
- Tonelli M, Wiebe N, Fortin M, Guthrie B, Hemmelgarn BR, et al. (2015) Methods for identifying 30 chronic conditions: application to administrative data. BMC Med Inform Decis Mak 15: 31. [crossref]
- Quan H, Li B Fau-Saunders LD, Saunders Ld Fau-Parsons GA, Parsons Ga Fau-Nilsson CI, Nilsson Ci Fau -Alibhai A, et al. (2008) Assessing validity of ICD-9-CM and ICD-10 administrative data in recording clinical conditions in a unique dually coded database. Health Serv Res 43: 1424–1441.
- Quan H, Sundararajan V, Halfon P, Fong A, Burnand B, et al. (2005) Coding algorithms for defining comorbidities in ICD-9-CM and ICD-10 administrative data. Med Care 43: 1130–1139. [crossref]
- Ronald J. Ozminkowski PD MWS, Rosanna M. Coffey, Tami L. Mark, Cheryl A. Neslusan, John Drabek (2000) Private Payers Serving Individuals with Disabilities and Chronic Conditions 2000.
- Stevens PE, Levin A (2013) Evaluation and management of chronic kidney disease: synopsis of the kidney disease: improving global outcomes 2012 clinical practice guideline Ann Intern Med 158: 825–30.
- Byrne D, Conway R, Cournane S, O’Riordan D, Silke B (2018) Relationship of the clinical acuity & complexity to the outcome of an emergency medical admission. Acute medicine 17: 18–25.
- Conway R, Byrne D, O’Riordan D, Silke B (2015) Patient risk profiling in acute medicine: the way forward? QJM 108: 689–696. [crossref]
- Sterns RH (1987) Severe symptomatic hyponatremia: Treatment and outcome: a study of 64 cases. Annals of Internal Medicine 107: 656–664.
- Sonnenblick M, Friedlander Y, Rosin AJ (1993) Diuretic-induced severe hyponatremia. Review and analysis of 129 reported patients. Chest 103: 601–606. [crossref]
- Prytherch DR, Sirl JS, Schmidt P, Featherstone PI, Weaver PC, et al (2005) The use of routine laboratory data to predict in-hospital death in medical admissions. Resuscitation 6: 203–207.
- Froom P, Shimoni Z (2006) Prediction of hospital mortality rates by admission laboratory tests. Clin Chem 52: 325–328.
- Hucker TR, Mitchell GP, Blake LD, Cheek E, Bewick V, Grocutt M, et al (2005) Identifying the sick: can biochemical measurements be used to aid decision making on presentation to the accident and emergency department. Br J Anaesth 94: 735–741.
- Chawla A, Sterns RH, Nigwekar SU, Cappuccio JD (2011) Mortality and serum sodium: do patients die from or with hyponatremia? Clin J Am Soc Nephrol 6: 960–965. [crossref]
- Sun L, Hou Y, Xiao Q, Du Y (2017) Association of serum sodium and risk of all-cause mortality in patients with chronic kidney disease: A meta-analysis and sysematic review. Scientific reports 7: 15949-.
- Patel RB, Tannenbaum S, Viana-Tejedor A, Guo J, Im K, Morrow DA, et al (2017) Serum potassium levels, cardiac arrhythmias, and mortality following non-ST-elevation myocardial infarction or unstable angina: insights from MERLIN-TIMI 36. European heart journal Acute cardiovascular care 6: 18–25.
- Korgaonkar S, Tilea A, Gillespie BW, Kiser M, Eisele G, Finkelstein F, et al (2010) Serum potassium and outcomes in CKD: insights from the RRI-CKD cohort study. Clinical journal of the American Society of Nephrology : CJASN 5: 762–769.
- Hughes-Austin JM, Rifkin DE, Beben T, Katz R, Sarnak MJ, Deo R, et al (2017) The Relation of Serum Potassium Concentration with Cardiovascular Events and Mortality in Community-Living Individuals. Clin J Am Soc Nephrol 12: 245–252.